Abstract
Membrane proteins are key players in all living cells. To achieve a better understanding of membrane protein function, significant amounts of purified protein are required for functional and structural analyses. Overproduction of eukaryotic membrane proteins, in particular, is thus an essential yet non-trivial task. Hence, improved understanding of factors which direct a high production of eukaryotic membrane proteins is desirable. In this study we have compared the overproduction of all human aquaporins in the eukaryotic host Pichia pastoris. We report quantitated production levels of each homologue and the extent of their membrane localization. Our results show that the protein production levels vary substantially, even between highly homologous aquaporins. A correlation between the extents of membrane insertion with protein function also emerged, with a higher extent of membrane insertion for pure water transporters compared to aquaporin family members with other substrate specificity. Nevertheless, the nucleic acid sequence of the second codon appears to play an important role in overproduction. Constructs containing guanine at the first position of this codon (being part of the mammalian Kozak sequence) are generally produced at a higher level, which is confirmed for hAQP8. In addition, mimicking the yeast consensus sequence (ATGTCT) apparently has a negative influence on the production level, as shown for hAQP1. Moreover, by mutational analysis we show that the yield of hAQP4 can be heavily improved by directing the protein folding pathway as well as stabilizing the aquaporin tetramer.
Introduction
Membrane proteins are essential components of all cells responsible for key functions such as transporting ions and metabolites, send and receive chemical signals, facilitate cell to cell contacts and interactions, govern energy transduction, as well as control the organization and maintenance of the shape of organelles and the cell Citation[1]. Due to these properties and because they constitute a group of potential pharmaceutical targets, membrane proteins have acquired considerable attention from both academic and applied science. Consequently, integral membrane proteins, such as GPCRs and ion channels, comprise more than 50% of all human drug targets Citation[2].
To gain deeper insight into the action of existing drugs and to aid development of new drugs, a better understanding of the function of membrane proteins is needed. As three-dimensional protein structures may unify a large body of biochemical and functional data, they are crucial tools to achieve such understanding. Despite this fact, membrane proteins are still dramatically under-represented in structural databases, and the rate with which membrane protein specific structural information is increasing is significantly slower than for soluble proteins Citation[3]. This point is well illustrated by the fact that, although membrane proteins comprise approximately 30% of any proteome Citation[4], there are no more than 182 unique membrane protein structures Citation[5] available in the Protein Data Bank database (http://www.rcsb.org/). Of the 39 unique eukaryotic integral membrane protein structures reported at higher than 4 Å resolution, only twelve are human. Of these, only seven have been heterologously overproduced and their structures recently reported Citation[6–12]. Since the majority of medically important membrane protein targets are present in tissues at very low concentrations, the challenging task of overproducing stable and functional eukaryotic membrane proteins in sufficient yields for structural determination and characterization is of great importance Citation[13].
Yeast is a well suited host for overproduction of eukaryotic proteins; it has the advantage of providing the eukaryotic machinery for post-translational modifications while it is as easy to handle as a prokaryotic host in terms of manipulation, cultivation and optimization Citation[14–16]. The polypeptide elongation is slower in eukaryotes compared to prokaryotes and the mechanism for protein insertion into the membrane is different between the two Citation[13]. With regards to membrane proteins, studies in yeast have shown that the main limiting factor for production is determined by co- or post translational events Citation[17] and the importance of a functional secretion pathway has been pointed out Citation[18]. In addition, the lipid composition between prokaryotes and eukaryotes differs, which may have consequences for the localization and functionality of the produced membrane protein Citation[19]. Taken together, it is more likely to achieve a successful overproduction experiment for a eukaryotic membrane protein target in a eukaryotic host. The suitability of yeast for production of eukaryotic membrane proteins is indeed proven by the high resolution X-ray structures resulting from heterologous production of recombinant proteins; the plant aquaporin SoPIP2;1 Citation[20], the potassium channel Kv Citation[21], rabbit Ca-ATPase Citation[22], LTC4Citation[6], Citation[10] and hAQP5 Citation[9]. Four of these five proteins have been produced in the methylothrophic yeast P. pastoris, which grows to high cell densities and has a promoter (AOX1) which is one of the strongest and most tightly regulated known. Notably, P. pastoris holds the record of the highest yield of a purified eukaryotic membrane protein per litre of culture, namely hAQP1 also being included in this study Citation[23].
Recombinant membrane protein production is still widely regarded as a matter of trial-and-error Citation[24]. This fact does not meet the wide interest in detailed information about eukaryotic membrane proteins gained from functional and structural characterization, which in turn is achieved by methods necessitating large quantities of purified and homogenous protein sample. Hence, the field would strongly benefit from improved and controlled production of this group of molecules. The first step in this direction is increased insight into factors directing high membrane protein production. In order to gain such an understanding we selected a set of proteins, the 13 homologous human aquaporins, which we produced in an appropriate host, namely Pichia pastoris. AQPs constitute a family of conserved membrane proteins from which hAQP1 has been most thoroughly studied Citation[25], Citation[26]. Proteins from this family are divided into two major sub classes; orthodox aquaporins that only facilitate water transport and aquaglyceroporins, which in addition are permeable to other small solutes. Members of the aquaporin family have been recognized in bacteria, yeast, plants and animals. In humans, 13 aquaporin homologues have been identified; seven orthodox aquaporins (AQP0, AQP1, APQ2, AQP4, AQP5, AQP6, AQP8) and four aquaglyceroporins (AQP3, AQP7, AQP9, AQP10) Citation[27] (see ).
Figure 1. Structural and phylogenetic relationship between the human aquaporins. (A) Snake-plot of human aquaporin 1 showing similar (red), conserved (blue), and invariable (purple) residues among all the human aquaporins. Polar residues (yellow) refer to the three residues pointed out to be important for folding path and tetramer stability, which when mutated caused a considerably increase in hAQP4 production. The plot was made using TEXshade and TEXtopo Citation[57], Citation[58]. (B) Phylogenetic tree representing all 13 human aquaporins where aquaporins giving a high protein yield (green boxes) and a yield below the detection limit (red boxes), respectively, are marked. The sequences were aligned using ClustalW2 (http://www.ebi.ac.uk/Tools/clustalw2/) and the tree generated using the TreeViewX v.0.5 program. This Figure is reproduced in colour in Molecular Membrane Biology online.
![Figure 1. Structural and phylogenetic relationship between the human aquaporins. (A) Snake-plot of human aquaporin 1 showing similar (red), conserved (blue), and invariable (purple) residues among all the human aquaporins. Polar residues (yellow) refer to the three residues pointed out to be important for folding path and tetramer stability, which when mutated caused a considerably increase in hAQP4 production. The plot was made using TEXshade and TEXtopo Citation[57], Citation[58]. (B) Phylogenetic tree representing all 13 human aquaporins where aquaporins giving a high protein yield (green boxes) and a yield below the detection limit (red boxes), respectively, are marked. The sequences were aligned using ClustalW2 (http://www.ebi.ac.uk/Tools/clustalw2/) and the tree generated using the TreeViewX v.0.5 program. This Figure is reproduced in colour in Molecular Membrane Biology online.](/cms/asset/758270ac-bcde-4111-a4c0-244616059cef/imbc_a_386380_f0001_b.jpg)
In the human body these proteins govern a surprisingly broad spectrum of physiological functions Citation[28–30] ranging from concentration of urine in the kidneys Citation[31] and the maintenance of water homeostasis within the brain Citation[32] to the facilitation of cell migration during angiogenesis Citation[33]. Aquaporins consists of six transmembrane helixes (1–6) with five connecting loops (A–E), where loop B and E each contain a highly conserved Aspargine-Proline-Alanine (NPA) motif. Both the N and C termini are located on the intracellular side (A). Aquaporins arrange as homotetramers, where each subunit is functional and contains a single water channel. From mutational analysis, AQPs were first predicted to adopt an ‘hourglass model’ structure Citation[34], and this was confirmed by a number of AQP structures recovered at increasingly high resolution Citation[35–37].
By developing a system of internal controls, based upon a stable reference membrane protein, we were able to recover reliable quantitative results for membrane protein yields in the total protein fraction (total production level) as well as the degree of membrane insertion (membrane localized fraction). Our results establish that it is possible to place eukaryotic membrane protein overproduction studies on firm quantitative footing, which is an essential step towards elucidating the complex factors which can influence the final membrane protein yield. Although the human AQPs are highly homologous proteins, large variations in their total production levels were observed. However, our findings suggest that the substrate specificities, tetramer stability and folding pathway may affect membrane integrated production. A positive relationship was also associated with the first nucleic acid encoding the second amino acid in the protein sequence: when guanine occupied this position higher overproduction levels were typically observed. In contrast, a thymine in the +6 position apparently had a negative influence on the final yield. Interestingly, these observations agree with our results for hAQP1 and hAQP8 where the use of the mammalian Kozak sequence after ATG was superior compared to the yeast consensus sequence for the second codon, or an adaptation thereof. Moreover, mutational analysis of a low producing target, hAQP4, showed that an intended change of folding pathway and improved tetramer stabilization led to increased total yield. Taken together, our findings suggest that the overproduction level of a eukaryotic membrane protein in P. pastoris could be improved by introducing small changes in the nucleotide or protein sequence that influence the maturation, folding and stability of the nascent peptide chain.
Materials and methods
Construction of recombinant human aquaporins for production in P. pastoris
The cDNA from hAQP0-hAQP12 (Table S1, online version only) was amplified by PCR using forward and reverse primers (Invitrogen) listed in Table S2 (online version only) with the restriction sites underlined. A yeast consensus sequence Citation[38] was introduced making the sequence around the start codon similar to AAA ATG TCT. However, to avoid mutations in the protein sequence caused by adding the serine codon triplet (TCT) by default, silent mutations have been introduced in such a way that the nucleic acid sequence of the second triplet in the protein sequence approaches TCT. For detection and subsequent purification, a C-terminal hexa histidine tag was introduced and added in all the reverse primers. The resulting PCR product for each hAQP was cloned into the P. pastoris vector pPICZB (Invitrogen) resulting in the constructs hAQP0-His6 to hAQP12-His6. For introduction of point mutations in hAQP1-Myc-His6, hAQP4-His6 and hAQP8-His6, the QuikChange mutagenesis kit (Stratagene) was used. Correct sequences for all constructs were confirmed by sequencing (MWG Biotech).
Protein production in P. pastoris
The constructs where linearized with the restriction enzyme PmeI, purified and transformed to the P. pastoris wild type strain X-33 by the LiCl method (Invitrogen). From the resulting colonies, 10 transformants where chosen and a small scale screen for protein production was performed, as previously described Citation[39]. Briefly, the transformants were cultured overnight in BMGY (glycerol containing media, Invitrogen) followed by a change to methanol containing media, BMMY (Invitrogen), to induce the protein production. The start OD600 was adjusted to one and cultures were transferred to a 24-deep well block. Expression was maintained by adding methanol (final concentration 0.5% (v/v)) at 24 h and 48 h and cell samples were collected at 6 h, 22 h and 54 h post induction. For analyses, cells were pelleted by centrifugation and heated at 95°C for 10 min in sample buffer with DTT. Protein samples were loaded onto a 12.5% Tris-HCl Criterion Precast Gel (Bio-Rad) and transferred to a nitrocellulose membrane (Hybond-ECL, GE Healthcare). The membrane was analyzed with immunodetection using an anti-His6 monoclonal antibody (Clonetech) in combination with an anti-mouse IgG-HRP conjugate antibody (Promega). The protein signals were detected using the ECL Plus Western Blotting Detection System (GE healthcare) and the chemiluminescence mode of the LAS-1000 imaging system (Fujifilm). Signals were captured with Image Reader LAS-1000 Pro v.2.6 and analyzed with Multi Gauge V3.0 (both from Fujifilm).
Quantitation of total production levels
For reliable quantitation, we used an accurate and precise method for comparison between different growth and immunoblot experiments. This included analysis of growth experiments in triplicates together with a production control (the spinach aquaporin SoPIP2;1) as well as the use of an internal scaling standard on the immunoblots (purified hAQP1). Based on the protein signal, one well-producing transformant from each AQP was selected for localization and quantitation studies. This was performed in small scale production using 250 ml shaker flasks. As previously described, each transformant was cultured in triplicates and SoPIP2;1 was used as a reference Citation[23]. In short, overnight cultures were grown as described above and protein production was induced by a change to BMMY. The starting OD600 was adjusted to one in a total volume of 25 ml. After 6 h, the cultures were harvested, resuspended in cell resuspension buffer (CRB; 20 mM Tris-HCl pH 7.6, 100 mM NaCl, 0.5 mM EDTA, 5% (w/v) glycerol) and mixed with glass beads (0.5 mm) in a 1:1:1 (w/v/w) ratio. Cells were broken in a FastPreP-24 (Savant); 3×20 sec at 6.5 m/s and samples chilled on ice for 1 min between each run, and centrifuged at 500 g for 10 min to remove unbroken cells and large cell debris. For subsequent quantitation, a sample representing the total production was taken from the 500 g supernatant. The rest of the 500 g supernatant was further centrifuged at 10,000 g for 30 min to remove remaining cell debris. The resulting supernatant was centrifuged at 100,000 g for 90 min to collect the total membrane fraction. All centrifugation steps were performed at 4°C. The resulting membrane pellet was resuspended in 100 µl CRB and used for localization studies representing the membrane localized fraction. The total protein concentrations of all samples were determined using Bio-Rad protein assay using BSA as protein standard. Known amounts (5–50 µg) of total protein from the different fractions were mixed with SDS-sample buffer and heated at 65°C for 10 min prior analysis by immuno blot as described above.
Densitometry measurements
To analyze the degree of saturation of the pixels from images captured with the Image Reader LAS-1000 system, the Multi Gauge program was used. Protein bands were analyzed using the “Quant” option in the software. A background box of the same size was also used to subtract the noise contribution and get a more realistic value. Using Microsoft Office Excel, the mean value and standard deviation was calculated from samples from triplicate cultures of the same clone. In order to compare different immunoblots, we used an internal scaling standard (based on the overproduction of hAQP1 Citation[23]), i.e., a known amount of the same sample was loaded on every gel. To further verify the accuracy of the method, a triplicate of SoPIP2;1 Citation[20] was always grown in parallel, prepared in the same way as the samples and loaded on the gels. To facilitate interpretation of the total production, the data was scaled to the production of SoPIP2;1, for which the production was set to 1.0. All quantitation results were compared to this standard and reported as relative signal. Finally, the method was verified by controlling that the SoPIP2;1 overproduction was near constant (within 3% deviation) between the different growth experiments.
Localization study
From the densitometry measurements a value for both the total production level (500 g supernatant) and the membrane localized production (100,000 g pellet) could be calculated for each protein. The ratio between these two gives an indication of how well the protein is incorporated in the membrane (membrane localized fraction). Recombinant SoPIP2;1 is used as a reference, since this AQP both crystallizes and is functional when isolated from the P. pastoris membranes Citation[20], indicating that this protein is successfully produced, localized and folded in its functional form.
Results
A major variation in production levels and membrane insertion were observed for the hAQPs
All 13 human AQP homologues were successfully cloned into the expression vector pPICZB and transformed into P. pastoris. Selected clones, one for each hAQP, were grown in small scale cultures (25 ml) and overproduction yields were quantitated using immunoblot analysis on yeast extracts. Total protein production and membrane localization of the product were recorded for each target (). For the total production, the yield was related to a control, SoPIP2;1, for which the production level was set to one. SoPIP2;1 was chosen as a reference for successful production since it is produced to very high levels, efficiently localized to the membrane and also purified to high yields (115 mg/l) when produced in P. pastoris. For the different human AQP homologues produced in P. pastoris, a striking production variation was observed in the total yield (, A). Seven clones resulted in high yields (+ + ): hAQP0, hAQP1, hAQP3, hAQP5, hAQP7, hAQP10 and hAQP12; two resulted in yields near the threshold for useful overproduction (+): hAQP2 and hAQP8; and four resulted in yields below the detection limit; hAQP4, hAQP6, hAQP9 and hAQP11 ().
Figure 2. Immunoblots showing total and membrane integrated production of hAQPs in P. pastoris. (A–D) Samples representing the total and membrane integrated production are loaded in triplicates for each hAQP produced in P. pastoris together with a production control (SoPIP2;1) and an internal scaling standard (purified hAQP1). The amount of total protein loaded for each hAQP is stated above each immunoblot. *For hAQP8, 7.5 µg is loaded in lane 3.
Figure 3. Total and membrane integrated production of hAQPs in P. pastoris. (A) Bar chart showing the total production level of the different human aquaporins produced in the host P. pastoris relative the SoPIP2;1 production (in grey), for which the production is set to one. The y-axis represents average from triplicate cultures, error bars show the standard deviation (n=3). (B) Bar chart showing the membrane localized fraction for the hAQPs produced with moderate to high yield. The typical fraction of membrane localization is also shown for the reference protein, SoPIP2;1 (grey). High values indicate that a large fraction of the overproduced protein is entering the membrane. The hAQPs are grouped by their position in the phylogenetic analysis (Figure 1B); aquaporins are blue and aquaglyceroporins are purple. This Figure is reproduced in colour in Molecular Membrane Biology online.
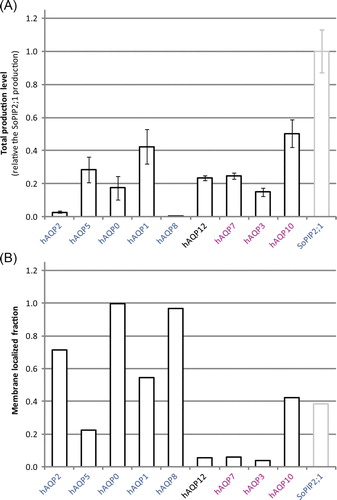
Table I. Protein production levels for all human AQPs when overproduced in Pichia pastoris. A QPs are listed based on their production level, starting with the hAQP giving the highest observed yield.
To exclude the possibility that differences in production arose from the transformation, we made a thorough investigation of the clone variation. For this purpose, the production of 50 hAQP1-His6 transformants, in three separate transformations, were compared. From this experiment, we only observed minor variation between hAQP1 transformants and concluded that transformation events could not explain the variation between different hAQPs (data not shown). Compared to SoPIP2;1, the total yield for the different hAQPs varied from 50% (hAQP10) to a minor fraction (hAQP8). This means, a hypothetical yield could be around 55 mg pure protein per litre for hAQP10 that gave the highest total production. Functionality of purified protein was verified for hAQP1 Citation[23], hAQP2, hAQP5 and SoPIP2;1 by proteoliposome shrinkage assays and all showed water transport rates consistent with literature values (data not shown). Hence, a total production level corresponding to as low as a few percentage of SoPIP2;1 (hAQP2) still resulted in functional protein. In summary, at least 8/13 hAQPs were successfully produced in P. pastoris in yields enough for further characterization.
However, a useful indication of a correctly folded membrane protein is its localization to the membrane. Consequently, the level of membrane insertion for all AQPs with moderate to high overproduction yield (A) was verified and accurately quantitated. Again, a considerable variation in the fraction of each aquaporin successfully inserted into membranes was observed between the homologues (B). Further, a high total production did not necessarily lead to efficient membrane localization (comparing hAQP5 and hAQP12, see ). Neither, it appeared that a moderate production level resulted in lower risks for overloading the membrane insertion machinery and a higher fraction of the membrane localization (comparing hAQP0 and hAQP3). Thus, the extent to which the membrane protein is successfully targeted to the membrane appears to be highly specific for each individual membrane protein and varies substantially between highly related targets.
A connection between membrane insertion and the phylogenetic distribution is observed
All 13 human aquaporins are closely related homologues (A), sharing as much as 63% amino acid sequence identity (hAQP2 and hAQP5) and as little as 14% (hAQP2 and hAQP11). Furthermore, phylogenetic analysis of the human AQPs naturally distinguishes between the pure water transporters (hAQP0, hAQP1, hAQP2, hAQP4, hAQP5, hAQP6 and hAQP8) and AQPs which transport additional small solutes such as glycerol (hAQP3, hAQP7, hAQP9 and hAQP10) (B). Human AQP11 and AQP12 form a branch of their own located at the interface between these two major groups and their transport functions have not yet been unambiguously characterized Citation[40].
In addition to representing the phylogenetic relationship between the human AQPs, B also presents their relative overproduction yield. As concluded from this analysis, there is no correlation between the total yield and the position of the hAQP in the phylogenetic tree; all major clusters contain high yielding AQPs (A) as well as AQPs failing to give detectable overproduction signals.
However, this situation is notably changed when the extent of membrane insertion of the hAQPs are considered. Among the hAQPs with moderate to high total production (A), all pure water transporters (blue in A) showed high levels of membrane incorporation (blue in B), comparable to that recovered for the reference SoPIP2;1. Hence, five out of seven water transporters that were produced at moderate to high total protein levels also showed an efficient targeting to the membrane. In contrast, of the three members of the aquaglyceroporin sub-family that were produced to high levels only hAQP10 was incorporated with high efficiency into the membrane (purple in ). Additionally, for hAQP12, which lies at the boundary between the two main hAQP clusters (A), only modest membrane insertion was observed. Taken together, a difference between membrane localization could be observed between the two aquaporin subfamilies where the membrane targeting was generally more efficient for the pure water channels as compared to the aquaglyceroporins.
The nucleotide sequence of the second codon is crucial for the aquaporin yield
In order to further elucidate the complexity behind successful membrane protein overproduction experiments, we investigated the influence of the nucleotide sequence around the start codon (ATG) on the resulting yield. To optimize the production, the hAQPs were cloned to mimic AAAATGTCT (the yeast consensus sequence) as far as possible without altering the amino acid sequence. Hence, only silent mutations were allowed. Of the 13 hAQPs used in this study, the wild-type sequence was kept for hAQP0, hAQP2, hAQP3, hAQ5, hAQP6, hAQP7, hAQP8 and hAQP9 to avoid any mutation of the second amino acid residue. hAQP1, hAQP4, hAQP10, hAQP11 and hAQP12 were mutated to resemble TCT by mutating to a thymine in the +6 position. Only hAQP8 had TCT following the initial ATG codon in its wild-type sequence, while this specific codon could be achieved by silent mutations for hAQP11 (Table S2, online version only). However, the overproduction of hAQP8 was on the threshold for detection and hAQP11 could not be detected at all (). Hence, we conclude that the presence of TCT at this position does not have any positive influence on hAQP overproduction levels.
Further, we have evaluated the effect of a thymine at the +6 position by comparing the yield of variants of the hAQP1 construct. We observed that changing GCC to GCT (hAQP1-His6) resulted in a substantial decrease in total yield; the quantitated yield was only ~30% of the hAQP1-Myc-His6 yield Citation[23] (A). However, the fraction of overproduced hAQP1 inserted into the membrane was almost identical for the two constructs (data not shown). To shed additional light on the influence of the second triplet on the total production a third construct was designed (hAQP1GCT-Myc-His6), where the cytosine in position +6 in the successful hAQP1-Myc-His6 construct was mutated to thymine to resemble the GCT in hAQP1-His6, the construct used in the present study. Notably, the total production was significantly lowered for hAQP1GCT-Myc-His6 (A) reinforcing our suggestion that a thymine at the +6 position is not beneficial for the overproduction yield.
Figure 4. The nucleotide sequence following ATG affects the production of hAQPs. (A) Bar chart showing the total production level of three hAQP1 constructs being varied in the nucleotide sequence for the second codon (in paranthesis) and the C-terminal affinity tag, respectively. The first bar represents the hAQP1-Myc-His6 construct described previously Citation[23], the second and the third bar represent the hAQP1-His6 and the hAQP1GCT-Myc-His6 constructs, respectively, in this study. (B) Bar chart showing the total production level for two hAQP8 constructs being varied in the nucleotide sequence for the second codon (in paranthesis), hAQP8-His6 and hAQP8GCT-His6, respectively. The bars represent the average and standard deviation for each construct (n=3).The scale on the y-axis is the same as in A.
![Figure 4. The nucleotide sequence following ATG affects the production of hAQPs. (A) Bar chart showing the total production level of three hAQP1 constructs being varied in the nucleotide sequence for the second codon (in paranthesis) and the C-terminal affinity tag, respectively. The first bar represents the hAQP1-Myc-His6 construct described previously Citation[23], the second and the third bar represent the hAQP1-His6 and the hAQP1GCT-Myc-His6 constructs, respectively, in this study. (B) Bar chart showing the total production level for two hAQP8 constructs being varied in the nucleotide sequence for the second codon (in paranthesis), hAQP8-His6 and hAQP8GCT-His6, respectively. The bars represent the average and standard deviation for each construct (n=3).The scale on the y-axis is the same as in Figure 3A.](/cms/asset/a41bb345-eec4-4ff3-a78d-db81726e8cb8/imbc_a_386380_f0004_b.gif)
Despite the failure of the TCT codon to positively influence protein production levels, there is a marked correlation between the first nucleic acid of the second codon (position +4) and the overproduction yield. In particular, of the seven human AQP constructs with guanine as the first base of this codon (hAQP1, hAQP3, hAQP4, hAQP6, hAQP7, hAQP10 and hAQP12, ), five were overproduced with high yields, with hAQP4 and hAQP6 being the only exceptions. In comparison, of the four hAQPs with thymine at this position (hAQP0, hAQP2, hAQP8 and hAQP11) only hAQP0 gave a high yield and hAQP2 and hAQP8 were near the detection threshold. Since only one example was available with adenine (hAQP5) or cytosine (hAQP9) as this position, little can be concluded regarding their influence. In order to confirm the importance of the nucleotide sequence at the +4 position we re-cloned a target with moderate production level, hAQP8, where the nucleotide sequence for the first nucleotide was changed from TCT to GCT resulting in alanine instead of serine at the second position. For this specific target, introduction of a G at the +4 position, gave rise to a substantial increase in total production (B) strengthening the value of a guanine at this specific position.
Taken together, the inclusion of TCT as the second codon, or a silent mutation so as to approach this codon, has not introduced any positive effect on the final overproduction yield for human AQPs in this study while guanine at position +4 was overrepresented among high producing targets.
Folding pathway and tetramer stability affect overproduction
Despite the close homology between AQPs they do not share the same folding characteristics. For most eukaryotic membrane proteins the final topology is acquired via co-translational translocation events in the endoplasmic reticulum (ER) Citation[41]. This is true for ratAQP4 (rAQP4), being almost identical to hAQP4, whereas hAQP1 initially folds via a transient four-transmembrane helix spanning topology Citation[42], Citation[43]. This is of particular interest for our study since hAQP1 has a high stable production while hAQP4 falls below the detection limit. Two highly polar amino acids in hAQP1 (Asn49, Lys51) with hydrophobic counterparts in hAQP4 (Met48, Leu50) have been shown to explain these different folding pathways Citation[44] (A). For hAQP1 to reach its mature topology a third polar residue (Asp185) is necessary to make a functional interaction with Lys51 and to stabilize the tetramer Citation[45]. To investigate the correlation between folding pathway and total protein overproduction and further analyse the impact on tetramer stability, we mutated hAQP4 to resemble hAQP1. In the first step both the amino acids near TMD2 (Met48, Leu50 for hAQP4) were changed to the corresponding amino acids for hAQP1 (Asn49, Lys51) resulting in hAQP4-M48N, L50K. In an additional step, the amino acid close to TMD5 (Asn184 for hAQP4, Asp185 for hAQP1) was changed resulting in hAQP4-M48N, L50K, N184D (A). By these mutations, the total protein production was indeed improved for hAQP4-M48N, L50K (A), most likely since the mutations caused hAQP4 to follow the hAQP1 folding pathway. Furthermore, the production was significantly improved after introduction of the polar residue near TMD5 (hAQP4-M48N, L50K, N184D) leading to tetramer stabilizing interactions (A). Importantly, membrane integration was verified for hAQP4 having these three mutations when produced in P. pastoris fermentor cultures (B). This strengthens our conclusion that tetramer stability is a factor of significant importance to achieve high membrane protein production as well as opening new doors for methods to increase protein production of less trivial targets.
Figure 5. Overproduction of hAQP4 is affected by its folding pathway and tetramer stability. (A) Bar chart showing the total production level of the three different hAQP4 constructs analysed in this study. The production of hAQP4 was drastically increased when the amino acids close to TMD2 were mutated to mimic hAQP1 (hAQP4-M48N, L50K). An even higher significant increase was observed when an additional amino acid important for tetramer stability was mutated as well (hAQP4-M48N, L50K, N184D). The scale on the y-axis is the same as in A (B) Immunoblot showing the total protein production and membrane fraction, respectively, for hAQP4-M48N, L50K, N184D produced by fermentor growth.
Discussion
Successful quantitation of membrane protein production levels
Analysis of membrane proteins using immunoblots is a well-known non-trivial task. In this study we have therefore invested a considerable effort in our screening method allowing a reliable and reproducible production of eukaryotic membrane proteins in P. pastoris which can also be accurately quantitated. As seen in A, the total protein production level for each hAQP produced in P. pastoris could be correctly determined from triplicate cultures; the standard variation for each clone was relatively small and a neglectable variation between signals from different immunoblots could be confirmed by comparing the signal for the production control (SoPIP2;1) and the internal scaling standard (purified hAQP1), respectively, on all blots. On the contrary, hydrophobic molecules have a tendency to aggregate in the loading buffer and be transferred to the membrane in an unpredictable manner. Hence, accurate quantitation of the membrane localized production is a more complex exercise. Nevertheless, the immunoblot analysis of hAQPs presented in this study involved a nice separation of the hydrophobic proteins in the majority of cases where the aquaporins commonly migrate at their expected molecular weight (A–D). Despite this observation, more variation is commonly observed for immunoblot signals derived from the membrane fraction. To circumvent this problem, we have consistently compared signals derived from the same immunoblot, where a minor variation is observed within the triplicate cultures (), and accurately estimated the extent of membrane localization. For each individual target we have consequently loaded the total extract and the membrane fraction on the same immunoblot. The same procedure has also been performed for our production control, SoPIP2;1 (B). Since it is very difficult to correctly quantify the amount of protein in the membrane we argue that the degree of membrane localization could beneficially be compared to a protein that obviously target very well to the membrane giving rise to a high yield of pure protein in its functional form (SoPIP2;1). However, our conclusion is that a method superior to immunoblot would be desirable for a more precise quantitation of proteins in the membrane fraction.
Membrane insertion varies between the two aquaporin sub-families
No obvious difference in total production could be observed between the two aquaporin sub-families, aquaporins and aquaglyceroporins. However, comparing the extent of membrane localization between the hAQP homologues revealed that pure water transporters were successfully integrated into the membrane with higher frequency. These observations suggest that the additional functionality of the aquaglyceroporins, which necessarily have larger transport channels than the orthodox AQPs so as to accommodate larger substrates Citation[46–48], may increase the risk for failure of membrane insertion. Furthermore, the water selective AQPs are typically solubilized as tetramers whereas the aquaglyceroporins frequently solubilize as monomers Citation[49], Citation[50]. Thus, the folding and stability properties of the aquaglyceroporin family members may explain their lower extent of membrane insertion. In addition, it may be significant that P. pastoris has only one AQP homologue which is a pure water transporter (Fischer et al. unpublished). Since the additional functionality of aquaglyceroporins is not present in P. pastoris this could potentially contribute to their failure to insert correctly in this host.
The Kozak versus the yeast consensus sequence
Nucleic acid sequence and codon usage is frequently discussed as being influential on membrane protein overproduction. In particular, the nucleic acid sequence of the codons surrounding the first triplet (ATG), being a translation initiation enhancer, has been shown to influence the final protein production yield Citation[51]. Based on early studies the mammalian consensus sequence has been determined to gccRccatgG where R is a purine (adenine or guanine, most often adenine) three bases upstream (-3) of the start codon ATG (underlined, AUG for mRNA) Citation[52]. The purine (-3) and the guanine at position +4, i.e., directly after the start codon, are particularly important (marked with capital letters) for production in mammals. Recently, it has been demonstrated that the +4G is not related to efficient translation initiation. Rather, the prevalence of +4G in highly expressed genes gives rise to an overrepresentation of alanine (GCN) and glycine (GGN), to a smaller extent, at the second position. These small amino acids are suitable for an efficient cleavage of the initiator methionine from the nascent polypeptide chain Citation[53]. In comparison to the Kozak sequence, the consensus sequence for yeast has been suggested to be AAAAATGTCT Citation[54]. This sequence is also recommended for the P. pastoris expression system where TCT (encoding a serine) after the start codon is typically suggested Citation[38].
Interestingly, for the well producing hAQPs, guanine was overrepresented at the +4 position, which is part of the original Kozak sequence. Notably, guanine was also introduced at this position in the improved hAQP8 construct (B). On the contrary, we found that thymine at this position was common among the moderate to low producing hAQPs. The consequence of the type of base at the +4 position is obvious comparing the encoded amino acid residue at the second position for the 13 hAQPs. Notably, non-polar residues (glycine, alanine, valine and tryptophan) dominate at the second position for all the high producing hAQPs, hAQP5 being the only exception for which lysine is encoded in this position. In comparison, polar residues are most common for those hAQPs that were not detected, of which no one had glycine or alanine at the second position (see ). Hence, a polar residue (serine) encoded by TCT does not appear to be the ideal choice for efficient expression of recombinant protein production in P. pastoris.
As illustrated by the alternative hAQP1 constructs, also position +6 is of significance for the production yield. The intention to mimic the TCT (GCT in hAQP1-His6 and hAQP1GCT-Myc-His6 instead of GCC in hAQP1-Myc-His6) sequence in the second triplet had a negative influence on the production level (A). Although the other difference between the two AQP1 constructs was the presence of an extended C-terminal affinity tag, we find it unlikely that this C-terminal extension was the basis for the exceptional yield of human AQP1 previously reported. In particular, its removal did not significantly alter the overproduction yield Citation[23]. In comparison, very little variation was observed for the total protein yield of AqpZ when overproduced with N- and C-terminal affinity tags of varying length in Escherichia coliCitation[55]. However, a minor influence from the C-terminal extensions cannot be excluded based on the yields from hAQP1-His6 and hAQP1GCT-Myc-His6, respectively. Therefore, an interesting construct to make would be hAQP1-His6 where GCT is mutated back to the wild type GCC, a construct which in theory would give as high-production as hAQP1-Myc-His6. Nevertheless, for the family of human aquaporins overproduced in P. Pastoris it is clear that there is no advantage of changing from the mammalian Kozak sequence to the yeast consensus sequence, as recommended by Invitrogen Citation[38]. Following this notion, a potential increase in yield could be achieved by keeping the wild type sequence for the second codon for hAQP4, hAQP10, hAQP11 and hAQP12.
The correlation between overproduction yield, tetramer stability and proposed folding pathway
As observed for hAQP1 and rAQP4, two polar residues close to the second TMD direct the folding pathway. Furthermore, a third polar residue close to the fifth TMD stabilizes the hAQP1 tetramer (A). Comparing the hAQPs, hAQP0, hAQP2, hAQP5 and hAQP11 contain polar residues which could potentially stabilize the AQP tetramer in a manner similar to hAQP1, whereas hAQP3, hAQP6, hAQP7, hAQP8, hAQP10 and hAQP12, like hAQP4, are not predicted to have these polar side-chain interactions Citation[45]. From our results, no correlation between the tetramer stabilizing interactions and the total production yield (A) is apparent. On the other hand, a noticeable correlation between success during membrane insertion and tetramer stabilizing interactions emerges. In particular, of the hAQPs for which production and membrane insertion yields were quantitated, hAQP0, hAQP2 and hAQP5, which have possible tetramer stabilizing interactions similar to hAQP1, gave high membrane insertion. In contrast hAQP3, hAPQ7 and hAQP12, which do not have the polar residues necessary for tetramer stabilization, gave unsatisfactory membrane insertion (B). This finding suggests that a stable mature topology might be advantageous for correct membrane insertion. Interestingly, for hAQP4 we also demonstrate the importance of these tetramer stabilizing residues in combination with the hAQP1 folding pathway; when it was mutated to mimic hAQP1 (hAQP4-M48N, L50K, N184D) the total yield was substantially improved compared to wild-type (A).
In summary, we have quantitated the total and the membrane localized production for homologues proteins. Although our findings emphasize how small differences in the nucleic acid or protein sequence may alter the overproduction level, it is likely beneficial to further optimize the yield by controlled growth Citation[18], Citation[56]. Overproduction of eukaryotic membrane proteins is a complex task and numerous experimental factors can influence the final outcome. However, by comparing the production of the 13 hAQPs in the yeast P. pastoris further insight into factors directing high production of eukaryotic membrane proteins has been achieved.
Acknowledgements
We would like to acknowledge Jennifer Carbrey (Duke University Medical Center) who kindly provided the cDNA for all hAQPs. We also acknowledge William Skach (Oregon Health Sciences University) for providing rAQP4 cDNA and for giving useful perspectives. This work was supported by the European Commission (E-MeP), the Swedish Research Council (VR), SWEGENE, and the Research School of Genomics and Bioinformatics. Declaration of interest: The authors report no conflicts of interest. The authors alone are responsible for the content and writing of the paper.
References
- von Heijne G. The membrane protein universe: What's out there and why bother?. J Intern Med 2007; 261: 543–557
- Russell RB, Eggleston DS. New roles for structure in biology and drug discovery. Nat Struct Biol 2000; 7(Suppl.)928–930
- White SH. The progress of membrane protein structure determination. Protein Sci 2004; 13: 1948–1949
- Barth P, Schonbrun J, Baker D. Toward high-resolution prediction and design of transmembrane helical protein structures. Proc Natl Acad Sci USA 2007; 104: 15682–15687
- White, LS. 2008. Database of Membrane Proteins of Known Structure. Accessed from the website: http://blanco.biomol.uci.edu/.
- Ago H, Kanaoka Y, Irikura D, Lam BK, Shimamura T, Austen KF, Miyano M. Crystal structure of a human membrane protein involved in cysteinyl leukotriene biosynthesis. Nature 2007; 448: 609–612
- Ferguson AD, McKeever BM, Xu S, Wisniewski D, Miller DK, Yamin TT, Spencer RH, Chu L, Ujjainwalla F, Cunningham BR, Evans JF, Becker JW. Crystal structure of inhibitor-bound human 5-lipoxygenase-activating protein. Science 2007; 317: 510–512
- Hiller S, Garces RG, Malia TJ, Orekhov VY, Colombini M, Wagner G. Solution structure of the integral human membrane protein VDAC-1 in detergent micelles. Science 2008; 321: 1206–1210
- Horsefield, R, Norden, K, Fellert, M, Backmark, A, Tornroth-Horsefield, S, Terwisscha van Scheltinga AC, Kvassman, J, Kjellbom, P, Johanson, U, Neutze, R. 2008. High-resolution x-ray structure of human aquaporin 5. Proc Natl Acad Sci USA, 105:13327–13332.
- Martinez Molina D, Wetterholm A, Kohl A, McCarthy AA, Niegowski D, Ohlson E, Hammarberg T, Eshaghi S, Haeggstrom JZ, Nordlund P. Structural basis for synthesis of inflammatory mediators by human leukotriene C4 synthase. Nature 2007; 448: 613–616
- Teriete P, Franzin CM, Choi J, Marassi FM. Structure of the Na,K-ATPase regulatory protein FXYD1 in micelles. Biochemistry 2007; 46: 6774–6783
- Hebert H, Jegerschold C. The structure of membrane associated proteins in eicosanoid and glutathione metabolism as determined by electron crystallography. Curr Opin Struct Biol 2007; 17: 396–404
- Tate CG. Overexpression of mammalian integral membrane proteins for structural studies. FEBS Lett 2001; 504: 94–98
- Rosenfeld SA. Use of Pichia pastoris for expression of recombinant proteins. Methods Enzymol 1999; 306: 154–169
- Cereghino JL, Cregg JM. Heterologous protein expression in the methylotrophic yeast Pichia pastoris. FEMS Microbiol Rev 2000; 24: 45–66
- Bill RM. Yeast – a panacea for the structure-function analysis of membrane proteins?. Curr Genet 2001; 40: 157–171
- Joseph-Liauzun E, Farges R, Le Fur G, Ferrara P, Loison G. High-level production of a human membrane protein in yeast: The peripheral-type benzodiazepine receptor. Gene 1995; 155: 195–199
- Bonander N, Hedfalk K, Larsson C, Mostad P, Chang C, Gustafsson L, Bill RM. Design of improved membrane protein production experiments: Quantitation of the host response. Protein Sci 2005; 14: 1729–1740
- Tate CG, Haase J, Baker C, Boorsma M, Magnani F, Vallis Y, Williams DC. Comparison of seven different heterologous protein expression systems for the production of the serotonin transporter. Biochim Biophys Acta 2003; 1610: 141–153
- Tornroth-Horsefield S, Wang Y, Hedfalk K, Johanson U, Karlsson M, Tajkhorshid E, Neutze R, Kjellbom P. Structural mechanism of plant aquaporin gating. Nature 2006; 439: 688–694
- Long SB, Tao X, Campbell EB, MacKinnon R. Atomic structure of a voltage-dependent K+ channel in a lipid membrane-like environment. Nature 2007; 450: 376–382
- Jidenko M, Nielsen R C, Sorensen TL, Moller JV, le Maire M, Nissen P, Jaxel C. Crystallization of a mammalian membrane protein overexpressed in Saccharomyces cerevisiae. Proc Natl Acad Sci USA 2005; 102: 11687–11691
- Nyblom M, Oberg F, Lindkvist-Petersson K, Hallgren K, Findlay H, Wikstrom J, Karlsson A, Hansson O, Booth PJ, Bill RM, Neutze R, Hedfalk K. Exceptional overproduction of a functional human membrane protein. Protein Expr Purif 2007; 56: 110–120
- Grisshammer R. Understanding recombinant expression of membrane proteins. Curr Opin Biotechnol 2006; 17: 337–340
- Agre P, Saboori AM, Asimos A, Smith BL. Purification and partial characterization of the Mr 30,000 integral membrane protein associated with the erythrocyte Rh(D) antigen. J Biol Chem 1987; 262: 17497–17503
- Preston GM, Carroll TP, Guggino WB, Agre P. Appearance of water channels in Xenopus oocytes expressing red cell CHIP28 protein. Science 1992; 256: 385–387
- Nejsum LN. The renal plumbing system: Aquaporin water channels. Cell Mol Life Sci 2005; 62: 1692–1706
- King LS, Kozono D, Agre P. From structure to disease: The evolving tale of aquaporin biology. Nat Rev Mol Cell Biol 2004; 5: 687–698
- Takata K, Matsuzaki T, Tajika Y. Aquaporins: Water channel proteins of the cell membrane. Prog Histochem Cytochem 2004; 39: 1–83
- Verkman AS. More than just water channels: Unexpected cellular roles of aquaporins. J Cell Sci 2005; 118: 3225–3232
- Chen YC, Cadnapaphornchai MA, Schrier RW. Clinical update on renal aquaporins. Biol Cell 2005; 97: 357–371
- Amiry-Moghaddam M, Ottersen OP. The molecular basis of water transport in the brain. Nat Rev Neurosci 2003; 4: 991–1001
- Saadoun S, Papadopoulos MC, Hara-Chikuma M, Verkman AS. Impairment of angiogenesis and cell migration by targeted aquaporin-1 gene disruption. Nature 2005; 434: 786–792
- Jung JS, Preston GM, Smith BL, Guggino WB, Agre P. Molecular structure of the water channel through aquaporin CHIP. J Biological Chem 1994; 269: 14648–14654
- Murata K, Mitsuoka K, Hirai T, Walz T, Agre P, Heymann JB, Engel A, Fujiyoshi Y. Structural determinants of water permeation through aquaporin-1. Nature 2000; 407: 599–605
- Walz T, Hirai T, Murata K, Heymann JB, Mitsuoka K, Fujiyoshi Y, Smith BL, Agre P, Engel A. The three-dimensional structure of aquaporin-1. Nature 1997; 387: 624–627
- Sui H, Han BG, Lee JK, Walian P, Jap BK. Structural basis of water-specific transport through the AQP1 water channel. Nature 2001; 414: 872–878
- Invitrogen, C. 2005. EasySelect Pichia Expression Kit, version G. Accessed from the website: http://www.invitrogen.com/content/sfs/manuals/easyselect_man.pdf.
- Fantoni A, Bill RM, Gustafsson L, Hedfalk K. Improved yields of full-length functional human FGF1 can be achieved using the methylotrophic yeast Pichia pastoris. Protein Expr Purif 2007; 52: 31–39
- Castle NA. Aquaporins as targets for drug discovery. Drug Discov Today 2005; 10: 485–493
- Hessa T, Kim H, Bihlmaier K, Lundin C, Boekel J, Andersson H, Nilsson I, White S H, von Heijne G. Recognition of transmembrane helices by the endoplasmic reticulum translocon. Nature 2005; 433: 377–381
- Lu Y, Turnbull IR, Bragin A, Carveth K, Verkman AS, Skach WR. Reorientation of aquaporin-1 topology during maturation in the endoplasmic reticulum. Mol Biol Cell 2000; 11: 2973–2985
- Sadlish H, Pitonzo D, Johnson AE, Skach WR. Sequential triage of transmembrane segments by Sec61alpha during biogenesis of a native multispanning membrane protein. Nat Struct Mol Biol 2005; 12: 870–878
- Foster W, Helm A, Turnbull I, Gulati H, Yang B, Verkman AS, Skach WR. Identification of sequence determinants that direct different intracellular folding pathways for aquaporin-1 and aquaporin-4. J Biol Chem 2000; 275: 34157–34165
- Buck TM, Wagner J, Grund S, Skach WR. A novel tripartite motif involved in aquaporin topogenesis, monomer folding and tetramerization. Nat Struct Mol Biol 2007; 14: 762–769
- Fu D, Libson A, Miercke LJ, Weitzman C, Nollert P, Krucinski J, Stroud RM. Structure of a glycerol-conducting channel and the basis for its selectivity. Science 2000; 290: 481–486
- Newby, ZE, O'Connell, J, 3rd, Robles-Colmenares, Y, Khademi, S, Miercke, LJ, Stroud, RM. 2008. Crystal structure of the aquaglyceroporin PfAQP from the malarial parasite Plasmodium falciparum. Nat Struct Mol Biol, 15:619–625.
- Wang Y, Schulten K, Tajkhorshid E. What makes an aquaporin a glycerol channel? A comparative study of AqpZ and GlpF. Structure 2005; 13: 1107–1118
- Duchesne L, Pellerin I, Delamarche C, Deschamps S, Lagree V, Froger A, Bonnec G, Thomas D, Hubert J F. Role of C-terminal domain and transmembrane helices 5 and 6 in function and quaternary structure of major intrinsic proteins: Analysis of aquaporin/glycerol facilitator chimeric proteins. J Biol Chem 2002; 277: 20598–20604
- Lagree V, Pellerin I, Hubert JF, Tacnet F, Le Caherec F, Roudier N, Thomas D, Gouranton J, Deschamps S. A yeast recombinant aquaporin mutant that is not expressed or mistargeted in Xenopus oocyte can be functionally analyzed in reconstituted proteoliposomes. J Biol Chem 1998; 273: 12422–12426
- Kozak M. Point mutations close to the AUG initiator codon affect the efficiency of translation of rat preproinsulin in vivo. Nature 1984; 308: 241–246
- Kozak M. An analysis of 5′-noncoding sequences from 699 vertebrate messenger RNAs. Nucleic Acids Res 1987; 15: 8125–8148
- Xia, X. 2007. The +4G site in Kozak consensus is not related to the efficiency of translation initiation. PLoS ONE, 2:e188.
- Cigan AM, Donahue TF. Sequence and structural features associated with translational initiator regions in yeast – a review. Gene 1987; 59: 1–18
- Mohanty AK, Wiener MC. Membrane protein expression and production: Effects of polyhistidine tag length and position. Protein Expr Purif 2004; 33: 311–325
- Hedfalk K, Pettersson N, Oberg F, Hohmann S, Gordon E. Production, characterization and crystallization of the Plasmodium falciparum aquaporin. Protein Expr Purif 2008; 59: 69–78
- Beitz E. T(E)Xtopo: Shaded membrane protein topology plots in LAT(E)X2epsilon. Bioinformatics 2000; 16: 1050–1051
- Beitz E. TEXshade: Shading and labeling of multiple sequence alignments using LATEX2 epsilon. Bioinformatics 2000; 16: 135–139