Abstract
Microorganisms that survive in natural environments form organized multicellular communities, biofilms and colonies with specific properties. During stress and nutrient limitation, slow growing and senescent cells in such communities retain vital processes by maintaining plasma membrane integrity and retaining the ability to generate transmembrane electrochemical gradients. We report the use of a Saccharomyces cerevisiae colonial model to show that population growth in a multicellular community depends on nutrient diffusion and that resting cells start to accumulate from the beginning of the second acidic phase of colony development. Despite differentiation of colony members, synchronous transmembrane potential oscillation was detected in the organized colony. The electrochemical membrane potential periodically oscillated at frequencies between those for circadian to infradian rhythms during colony aging and transiently decreased at time points previously linked with rebuilding of yeast metabolism. Despite extensive decreases in the intracellular ATP concentration and in the amount and activity of the plasma membrane proton pump during nutrient limited growth and colony aging, the transmembrane electrochemical potential appeared to be maintained above a level critical for population survival.
Introduction
Periodic behaviour is a feature of living organisms that enables them to respond to and survive in variable external conditions. External factors (e.g., light and temperature) can affect biological clocks that control the succession, speed and duration of biological processes. Oscillatory clocks are classified as ultradian (period shorter than one day), circadian (period equivalent to one day) or infradian (period longer than one day) Citation[1]. Metazoa often exhibit circadian or infradian periodicity in response to external conditions while liquid cultures of unicellullar microorganisms often use ultradian clocks to regulate metabolic processes Citation[2], Citation[3].
Laboratory studies of microbial cells usually involve exponentially growing or continuous cultures. Under natural conditions, microbes often organize as multicellular communities with unique properties that allow populations to cope with a deleterious environment. These communities include colonies and biofilms colonizing various surfaces. Several lines of evidence indicate that microorganisms communicate using long-distance signals, which can modify and synchronize their behaviour Citation[4]. One example is ‘quorum sensing’ which is involved in the regulation of biofilm formation Citation[5]. It allows microbial cells to monitor local population densities and co-ordinately respond to available nutrients Citation[6]. Long-distance signals functioning among multicellular structures include ultrasound signalling between bacterial colonies Citation[7] and chemical signalling via volatile ammonia between yeast colonies of different genera Citation[8]. Ammonia-mediated inter-colony communication is connected with periodical changes in pH during long term colony development. A short (about 12–24 h) alkali phase, which starts immediately after yeast inoculation, is followed by an acidification phase lasting for several days. The colonies then switch to a second alkali phase lasting about 7 days, which is characterized by a steep increase in ammonia production. It is accompanied by extensive changes in gene expression leading to more economical cell metabolism and minimized cellular stress Citation[9]. During the second alkali phase, ammonia production gradually declines and colonies enter a second acidic phase. Since volatile ammonia can induce ammonia production in all colonies in the same locality, independently of their current developmental phase, colonies can synchronize their ammonia pulses and subsequent growth Citation[10].
We report that in addition to changes in pH with periodicities of several days, the yeast colonial population exhibits another type of oscillatory behaviour. Starting in the first acidic phase, the colony population shows oscillations in its average plasma membrane potential with periodicities between circadian and infradian rhythms. Periods of regular membrane potential oscillation are separated by sharp decreases in membrane potential during metabolic reprogramming of the population. This is the first report of rhythmic synchronized behaviour of a yeast population observed under conditions resembling those often found in nature. Furthermore, the protection of cell integrity appears to be a key task for an ageing population, despite decreasing energy supply and the accumulation of resting cells.
Materials and methods
Strains
Saccharomyces cerevisiae strain BY4742 (MATα,his3?1, leu2?0, lys2?0, ura3?0) is from the EUROSCARF collection, W303-1B (α, ade2-1, can1-100, his3-11,15, leu2-3,112, trp1-1, ura3-1) was kindly provided by A. Goffeau (Université Catholique de Louvain, Belgium) and GRF18 (his3-11,15, leu2-3,112) is from the collection of yeast cultures of the Department of Genetics and Microbiology, Charles University, Prague.
Media and growth conditions
Yeast giant colonies Citation[8] were grown 6 per plate (A) at 28°C on GM-BKP agar (1% yeast extract, 3% glycerol, 2% agar supplemented with bromcresol purple to a final concentration of 0.01%, 1% stock solution in ethanol).
Determination of colony biomass and of total, living and resting cells
Colony biomass was estimated as its wet weight. The number of different cell-types within a colony was determined as follows: a complete colony was harvested and the number of cells able to form progeny (colony forming cells) was determined by plating on non-selective YPD agar plates (2% dextrose, 1% yeast extract, 1% peptone, 2% agar). Total cell number was determined using a haemocytometer. The number of non-permeabilized living cells was determined using exclusion of bromcresol purple (BKP). The proportion of live BKP negative cells was calculated using a Leica DMR fluorescence microscope with a N2.1 filter. The number of resting cells was estimated as the difference between the colony forming cells and BKP negative cells.
Fluorescence measurement of cell membrane potential (diS-C3(3)assay)
Relative plasma membrane potential was estimated by detecting the redistribution of the fluorescent dye 3,3-dipropylthiacarbocyanine iodide (diS-C3(3), Fluca) in cells as described previously Citation[11]. The entry of diS-C3(3) into cells is dependent on the electrochemical potential of the plasma membrane. The binding of diS-C3(3) to cell components leads to increased fluorescence intensity (fluorescence lifetime and quantum yield of diS-C3(3) increases) and to a shift of the fluorescence emission spectrum towards longer wavelengths by ~10 nm for the bound probe as compared to the free probe. The position of the emission maximum at equilibrium () varies from 568 nm (fully depolarized cells) to about 578 nm (fully polarized cells). The rapidly established equilibrium between the free probe and the probe bound inside cells (monitored as staining curve, example in Supplementary Figure S1 – online version only) and the resultant λmax position is directly proportional to the actual concentration of the probe in the cells. Hence, the initial rate of penetration of the dye into cells and the position of
can be used to measure the relative plasma membrane electrochemical gradient. Control experiments have validated the dependence of the relative transmembrane potential value on the red shift in the λmaxCitation[12] and thus the measurements give reproducible values for relative membrane potential. The method has been used previously to compare the membrane potential of various yeast strains including strains growing under a variety of conditions Citation[13], Citation[14].
The relative membrane potential was measured by resuspending a whole yeast colony in 10 mM CP buffer (10 mM Na2HPO4, citric acid, pH 6.0) to OD578=0.1 and adding diS-C3(3) to 10 nM final concentration. Fluorescence emission spectra obtained using a FluoroMax3 spectrofluorimeter (Jobin-Yvon) equipped with a xenon lamp were used to determine the position of the emission maximum at equilibrium () and estimate the relative initial rate of probe uptake (IRU).
Where appropriate, the protonophore carbonylcyanide-3-chlorophenylhydrazone (CCCP) (10 mM stock solution in DMSO) or the lysosomotropic H+-ATPase inhibitor DM-11 (50 mM stock solution in H2O) Citation[15] were added to 10 or 50 µM final concentration, respectively, after was reached. Fifty µM DM-11 should be sufficient for full inhibition of the H+-ATPase as 10 µM DM-11 gives the same effect in control experiments (data not shown). The values of λCCCPeq (nm) and λDM-11eq (nm) were measured after 6 min. Figure S1A shows representative diS-C3(3) staining curves for cells from 4-day-old colonies with the protonophore CCCP added either at the beginning of the measurement or after
was reached.
Determination of ATP concentration in cells from colonies
ATP was extracted from yeast cells as described Citation[16]. A total of 3–18 colonies (about 75–250 mg wet weight of biomass) was collected and immediately quenched to stop the yeast metabolism. ATP was extracted at 80°C with 1 ml of buffered ethanol (pH 7.5) per 12.5 mg of original cell wet weight. Insoluble material was removed and the resulting extracts were 10-fold concentrated by evaporation at 45°C. The ATP content was determined using the luciferin-luciferase method (CLS II kit, Roche).
Preparation of cell lysates and total membrane fraction
A total membrane fraction was prepared as described Citation[17] with modification. A total of 9–30 colonies (approximately 300 mg of cell wet weight) was harvested and the cells broken with glass beads (Sigma-Aldrich) in 100 mM Tris-HCl (pH 8), 0.33 M sucrose, 5 mM EDTA, 2 mM DTT, Complete Protease Inhibitor Cocktail Tablets (Roche) and 1 mM AEBSF in a FastPrep instrument (Qbiogene). After removing cell debris (1000 g, 3 min and then 3000 g, 5 min), the resulting cell-free supernatant was either used for Pma1p detection or further centrifuged at 20000 g for 45 min. The pellet of the total membrane fraction was resuspended in 10 mM Tris-HCl buffer, pH 7.5, 0.1 mM EDTA, 0.1 mM DTT, 20% glycerol, with protease inhibitors and stored at -75°C.
Determination of plasma membrane ATPase activity of Pma1p in total membrane fraction
The method of Rosa and Sa-Correia Citation[18] was used with some modifications. The ATPase activity was measured using total membranes (100 µg protein/ml) in 50 mM MES, pH 5.7, 10 mM MgCl2, 50 mM KCl, 5 mM ATP in water bath at 30°C with shaking, in the presence of a mixture of 3 inhibitors (15 mM sodium azide, inhibitor of mitochondrial ATPase; 0.6 mM ammonium molybdenate, inhibitor of acid phosphatases and 300 mM KNO3, inhibitor of vacuolar ATPase) and either in the presence or in the absence of sodium vanadate (300 µM), inhibitor of plasma membrane ATPase activity. The reactions were stopped by 1% SDS. The initial rate of Pi released in the vanadate sensitive reaction was used to estimate plasma membrane H+-ATPase activity. The Pi was determined as described in Citation[19].
Determination of amount of Pma1p in cell lysates and total membrane fraction
Protein samples (2–5 µg) denatured in Laemmli sample buffer were separated by SDS-PAGE using 7.5% acrylamide gels. After transfer to a PVDF membrane (Immobilon-P, Millipore), Pma1p was detected using a specific goat anti-Pma1 antibodies (Santa Cruz Biotechnology) and rabbit anti-goat IgG-peroxidase antibody (Sigma-Aldrich). The antigen-antibody complex was visualized with Super Signal West Pico (Pierce) on Super RX medical X-ray film (Fuji).
Results
Growth and development of the yeast colony population
We measured growth of S. cerevisiae colonies on solid surfaces to identify features governing the behaviour of microbial communities. The biomass of a yeast colony population (determined as wet weight biomass) increased linearly for at least 18 days (A). This suggests that nutrient supply obtained by diffusion from the surroundings was constant during this period. The rate of colony biomass accrual then decreased slightly (indicating diminished nutrient supply) and it ceased entirely after 32 days.
Figure 1. Growth properties and survival of the Saccharomyces cerevisiae colony population. (A) Growth curves of colony populations measured as total biomass wet weight (right axis), total cell number and number of living cells determined either as BKP negative cells or cells able to form progeny (colony forming cells) (left axis). Number of resting cells is given in parallel (left axis). All values are calculated as the average per colony. (B) Survival of cells during long-term development of a colony shown as a percentage of BKP negative cells and colony forming cells. The total cell number at each time-point is set as 100%. The data (in A and B) give average values from four independent experiments ±SD. At each time point 2–3 giant colonies were evaluated.
The increase in total cell number within a single giant colony had the same profile as colony biomass accrual throughout the whole period of colony development (A). In contrast, the numbers of colony forming cells increased until about the 18th day only, i.e., until the end of the alkali developmental phase. Although both the total cell number and the number of living BKP negative cells continued to increase (A), the number of colony forming cells remained constant until day 32. The number of colony forming cells then decreased more rapidly than the number of both total and living BKP negative cells. The number of resting cells, i.e., living cells unable to proliferate, increased after day 18 and reached about 26% of total cells by day 135 (B).
Relative cell membrane potential oscillates during yeast colony development
Cell survival during starvation requires preservation of plasma membrane integrity and the ability to generate an electrochemical gradient at the plasma membrane. The relative plasma membrane electrochemical potential in cells from colonies at different developmental phases was measured using the redistribution of the fluorescent potentiometric probe diS-C3(3). In these measurements, the relative membrane potential is proportional to the values of (nm) (see Material and Methods). Measurements of
in whole colonies at particular developmental stages gave values that reflected the average relative membrane potential of the population. We have therefore used the term “average membrane potential” (AvMP) throughout the text. We assume that the rapidity of the measurements (about 30 min) minimizes artefacts caused by destruction of the colony and subsequent manipulations. The diS-C3(3) uptake curve of cells freshly harvested from the colony is identical to that of the same cell suspension after 30 min incubation in the CP buffer (Figure S1C). Hence, the membrane potential appears constant during the time required to measure the rate of dye uptake.
AvMP was determined during the development of giant colonies of S. cerevisiae. Measurements of both (B) and the initial rate of probe uptake (IRU) (C) showed that the AvMP of the colonies varies within three longer periods corresponding to the three main phases of colony development (1st acidic, 2nd alkali, 2nd acidic, depicted by colour bars, ). Within each of these periods shorter oscillations were visible. After day one, once the inoculated cells have developed an organized giant colony and the 1st acidic phase (B, first yellow bar) has begun, a period of AvMP oscillations starts at a relatively low potential value (
=574 nm). Oscillations of one day duration or longer (
between 575 and 577 nm) occurred throughout the 1st acidic phase. The onset of strong colony alkalization and ammonia production (day 10) is characterized by rapid plasma membrane depolarization, with independent experiments showing a decrease in
to 573–574 nm. A second period of oscillations follows (B, violet bar) with a steep increase in AvMP to
=578 nm, followed by frequent oscillations of relatively high amplitude (575.5–578 nm). This 2nd alkali phase ended on days 18–19, with a distinct AvMP decrease of
values to 573–574 nm. Parallel measurements of the rates of initial probe uptake confirm the occurrence of electrochemical gradient oscillations recorded using
(C). A second acidic phase was characterized by slower and smaller amplitude oscillations of AvMP (
between 573.5 and 575 nm, B, second yellow bar).
Figure 2. Changes in AvMP during development of Saccharomyces cerevisiae colonies measured by diS-C3(3) assay. The passage of colonies through individual developmental phases was monitored using the pH indicator BKP (A) as described Citation[10]. Relative AvMP was determined by position of the emission maximum at equilibrium (B) or as the initial rate of probe uptake (IRU) (C). Each point represents the average of four independent measurements from a single time-course experiment ±SD. The statistical significance of the measured oscillations is shown in Supplementary Figure S2 (online version only). The results shown are from a representative of triplicate experiments.
![Figure 2. Changes in AvMP during development of Saccharomyces cerevisiae colonies measured by diS-C3(3) assay. The passage of colonies through individual developmental phases was monitored using the pH indicator BKP (A) as described Citation[10]. Relative AvMP was determined by position of the emission maximum at equilibrium (B) or as the initial rate of probe uptake (IRU) (C). Each point represents the average of four independent measurements from a single time-course experiment ±SD. The statistical significance of the measured oscillations is shown in Supplementary Figure S2 (online version only). The results shown are from a representative of triplicate experiments.](/cms/asset/2312caf4-fc00-4e43-bc05-7975ffd73ce3/imbc_a_389485_f0002_b.jpg)
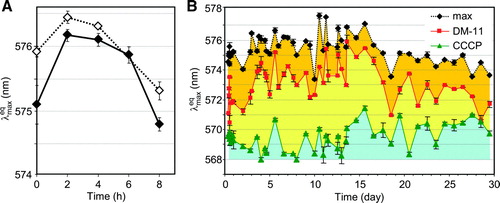
The presence of shorter (ultradian) oscillations was tested for by conducting diS-C3(3) assays every 2 h over an 8 h period on colonies from the same plate in the first acidic and in the late 2nd alkali developmental phases. In both cases the measurements of AvMP over 8 h detected a single oscillation that did not appear to involve oscillations with shorter periodicity (A).
Figure 3. Short-term changes in AvMP and contribution of protons to AvMP during colony development. (A) AvMP in cells of colonies from the 1st acidic phase (7 days old – full symbols) and cells of colonies in the late 2nd alkali phase (15 days old – open symbols) measured by diS-C3(3) assay during a developmental period of 8 h. Each point represents the average of four independent measurements ±SD. (B) Measurements of (green) and
eq (red) during long-term development were performed after addition of CCCP and DM-11, respectively. The
(black) profile from B is given for comparison. The sum of the orange and yellow areas represents the contribution of protons and the blue area the contribution of other cations to the total AvMP (
). The orange area represents the membrane potential that cannot be kept when plasma membrane H+-ATPase is inhibited by DM-11. Each point is the average of four independent measurements from a single time-course experiment ±SD. The results of a representative from duplicate experiments are shown in (A) and (B).
Control experiments using diS-C3(3) uptake curves for populations from two colonies of the same age and from the same plate were almost identical (Figure S1B). This indicates that the colonies had the same AvMP and were well synchronized. Accordingly, the most regular oscillatory patterns were detected for colonies from the same plate. Some irregularities in oscillation patterns were occasionally seen when the colonies tested came from different plates (data not shown). This was probably caused by slight differences in growth conditions on different plates. The length of the three main growth phases (1st acidic, 2nd alkali, 2nd acidic) sometimes varied slightly between experiments (data not shown). This modified the overall number and shape of oscillations within particular phases, but the general characteristics shown in the representative experiments were retained ( and ).
Proton gradient participation in AvMP
The contribution of the H+ gradient to total AvMP was evaluated by adding the H+ uncoupler CCCP which immediately dissipates the H+ gradient. This gave a rapid decrease in to
. The value of
is close to 568 nm when the AvMP is formed by H+ only.
The differences between and
in B (the sum of the yellow and orange areas, corresponding to the contribution of H+ to the total AvMP) appeared to decrease as colonies aged. The blue area in B corresponds to the component of AvMP contributed by other ion gradients. In addition, the lysosomotropic compound DM-11, which inhibits Pma1p activity in intact cells Citation[15] was used to evaluate the extent of H+ consumption from the external H+ pool. The electrochemical gradient was significantly depleted after a short exposure to the inhibitor (
decreased to
, B, orange area).
The AvMP level does not correlate with the amount of plasma membrane H+-ATPase and the level of intracellular ATP
As the H+ gradient, the major component of AvMP, is generated mainly by Pma1p H+-ATPase activity Citation[20], we analyzed colonies for the presence and activity of Pma1p. Both the amount of Pma1p measured in cell lysates or isolated membranes and its in vitro ATPase activity gradually decreased (A–C) during the development of colonies growing on complete glycerol GM medium.
Figure 4. Changes in the amount and activity of H+-ATPase Pma1p and the intracellular ATP content during the development of Saccharomyces cerevisiae colonies. Amount of Pma1p in the whole cell lysate (A) and in the total membrane fraction (B). Pma1p H+-ATPase activity in the total membrane fraction (C); the activity measured on day 5 is set as 100% (corresponding to 271.2 nmol Pi min−1mg−1). Average values of five independent measurements ±SD are given. (D) Intracellular ATP content; the highest concentration on day 4 is set as 100% (corresponding to 1.17 µmol/g wet weight biomass). The curve of from B (right axis) is given for comparison. The average of three measurements from one representative experiment ±SD is shown. The timing of the alkali developmental phase is marked in black on the bar.
Essential cellular processes including the establishment and maintenance of the plasma membrane potential are dependent on cell energetics, i.e., on the amount of available ATP. In developing colonies, a relatively high initial concentration of intracellular ATP gradually decreased in the late 1st acidic phase (D) and had declined about 10-fold by day 22.
Discussion
Microorganisms in the natural environments need to cope with harmful conditions and should be able to survive for extended periods without reproduction. In addition, microbial cells rarely exist naturally as individuals, because one of their survival mechanisms is the ability to organize themselves into multicellular communities (e.g., biofilms or colonies). We have used yeast giant colonies as a model to investigate this capability. In contrast to liquid culture, yeast growth within a colony is essentially linear and without detectable transient arrest during biomass accrual. The previously observed transient growth arrest of adjacent margins of neighbouring colonies caused by ammonia signalling leads to asymmetric colony growth Citation[8], but this is not reflected in total colony biomass. Even initial colony growth appears slow (), probably due to diffusion limited nutrient acquisition. Cells in the giant colonies may experience calorie restriction, a property that can extend the viability of both microbial cells and higher eukaryotes Citation[21]. And indeed, the giant colony population retained viability much longer than cells in liquid media. The ability of cells to reproduce declined to about 5% after 10 days of growth in liquid complete synthetic dextrose medium Citation[22], while the colonial population retained 90% of this capability after 10 days of cultivation and it decreased to 5% only after 135 days (). In addition, the percentage of total living cells within a colony remained even higher (95% and 31% at days 10 and 135, respectively) as indicated by BKP staining. The increasing difference between the number of colony forming cells and BKP negative cells during colony ageing began at the onset of the 2nd acidic phase and reached more than 25% of cells in 135-day-old colonies (B). This result suggested presence of a population of resting cells resembling VBNC (‘viable-but-non-culturable’) cells discovered within aged bacterial populations Citation[23]. Such cells can remain viable during extended periods of nutrient shortage.
Cell viability requires functional separation of the cell compartment from the external environment, with the plasma membrane providing a physical barrier and maintaining the electrochemical gradient important for proper ion homeostasis, the active transport of nutrients and removal of waste products. Our study has revealed that the colony population, despite being relatively old, living under nutrient limitations and having energy reserves decreased, carefully controls its average plasma membrane potential. In contrast to the short ultradian metabolic oscillations frequently observed in continuous yeast cultures Citation[2], Citation[3], the population of organized giant colonies shows oscillations of its transmembrane potential between specific limits with a periodicity of at least 24 h. In addition, the AvMP decreases precipitously during the stages of colony development () linked with the start of metabolism rebuilding Citation[9], i.e., at the beginning of 1st acidic, 2nd alkali and 2nd acidic phases (days 2, 10 and 18, respectively). This AvMP drop followed by a rapid AvMP increase may be caused by prominent changes in proton management due to the rapid and extensive changes in cell metabolism. Frequent high amplitude oscillations gradually attenuate as metabolic equilibrium is reached and the next deep metabolic change occurs. These principal characteristics of plasma membrane potential oscillatory behaviour were reproducibly detected and the oscillations of AvMP seem to be a general property of yeast populations growing within developing colony. They were also detected in colony populations of the two separate and non-isogenic strains W303 and GRF18 (data not shown).
In BY4742 colonies during the 2nd alkali phase, despite decreased amounts of Pma1p and low ATP concentrations (), an H+ gradient is developed that supports AvMP at levels comparable to exponentially growing yeast cells. Thus, additional mechanisms may help cells in alkali colonies to build up their transmembrane potential. For example, additional protons may originate from NH4+ (exported during the alkali phase) due to NH3 volatilization.
In the 2nd acidic phase, the AvMP oscillates around a level lower than in the 1st acidic phase but cell population still maintains an AvMP value (corresponding to of about 573.5 nm) which is significantly greater than the AvMP value recorded on day 10. The smaller contribution of H+ to this may indicate that other cations including NH4+ contribute to the membrane potential. Although intracellular ATP is only about 10% of that in young colonies, intracellular energetic sources still sustain the basal metabolism required for plasma membrane integrity and maintenance of membrane potential.
Late in the 2nd acidic phase, the 29- and 48-day-old populations maintain AvMP (573.8 nm), although the older population contains of about 23% less colony forming cells than the younger one. This means that either the small population of 48 day-old colony-forming cells has a much higher AvMP than 29-day-old cells, or that BKP negative cells contribute to the AvMP. The second and more likely interpretation suggests the presence of an increasing population of viable resting cells associated with colony aging.
The periodic oscillations of AvMP detected in all colony developmental phases appear similar despite cells located in different colony regions start to differentiate during the alkali phase Citation[24], Citation[25]. Thus, the cells in colonies must synchronize their transmembrane potential, probably by a coincident change in metabolism that occurs at a particular point in time and independently of their localization. What could be the synchronizing agent(s)? A good candidate would be the volatile ammonia which is known to mediate the synchronous development of a group of colonies Citation[10]. This hypothesis is supported by the steep increase in ammonia production at the beginning of alkali phase (day 10) which correlates exactly with the deep drop in AvMP. The participation of volatile ammonia in building membrane potential could be important in natural environments because gaseous signals can act over long distances to affect populations living under nutrient limitation. The oscillations at acidic phase have to be synchronized by another, as yet unidentified mechanism. Interestingly, oscillations of the H+-independent part of AvMP (indicated by curve at ) were detected in all phases, suggesting a role of other ion(s).
Acknowledgements
This work was supported by grants from the Grant Agency of the Czech Republic (204/05/0294 and 204/08/0718 to ZP and LV) and from the Ministry of Education (LC531 to ZP and LV, Research Concepts MSM0021620858, AV0Z50200510 and MSM0021620835) and by the Howard Hughes Medical Institute International Research Award (#55005623 to ZP).
We thank H. ždárská and M. Úlehlová for excellent technical assistance. Declaration of interest: The authors report no conflicts of interest. The authors alone are responsible for the content and writing of the paper.
Supplementary Material
Download JPEG Image (139.8 KB)
Supplementary Material
Download JPEG Image (214.9 KB)
References
- Schibler U, Naef F. Cellular oscillators: rhythmic gene expression and metabolism. Curr Opin Cell Biol 2005; 17: 223–229
- Murray DB, Roller S, Kuriyama H, Lloyd D. Clock control of ultradian respiratory oscillation found during yeast continuous culture. J Bacteriol 2001; 183: 7253–7259
- Tu BP, McKnight SL. Metabolic cycles as an underlying basis of biological oscillations. Nat Rev Mol Cell Biol 2006; 7: 696–701
- Palkova Z, Vachova L. Life within a community: benefit to yeast long-term survival. FEMS Microbiol Rev 2006; 30: 806–824
- de Kievit TR. Quorum sensing in Pseudomonas aeruginosa biofilms. Environ Microbiol 2009; 11: 279–288
- Miller MB, Bassler BL. Quorum sensing in bacteria. Annu Rev Microbiol 2001; 55: 165–199
- Matsuhashi M, Pankrushina AN, Endoh K, Watanabe H, Mano Y, Hyodo M, Fujita T, Kunugita K, Kaneko T, Otani S. Studies on carbon material requirements for bacterial proliferation and spore germination under stress conditions: a new mechanism involving transmission of physical signals. J Bacteriol 1995; 177: 688–693
- Palkova Z, Janderova B, Gabriel J, Zikanova B, Pospisek M, Forstova J. Ammonia mediates communication between yeast colonies. Nature 1997; 390: 532–536
- Palkova Z, Devaux F, Ricicova M, Minarikova L, Le Crom S, Jacq C. Ammonia pulses and metabolic oscillations guide yeast colony development. Mol Biol Cell 2002; 13: 3901–3914
- Palkova Z, Forstova J. Yeast colonies synchronise their growth and development. J Cell Sci 2000; 113: 1923–1928
- Gaskova D, Brodska B, Holoubek A, Sigler K. Factors and processes involved in membrane potential build-up in yeast: diS-C3(3) assay. Int J Biochem Cell Biol 1999; 31: 575–584
- Plasek J, Dale RE, Sigler K, Laskay G. Transmembrane potentials in cells: a diS-C3(3) assay for relative potentials as an indicator of real changes. Biochim Biophys Acta 1994; 1196: 181–190
- Malac J, Urbankova E, Sigler K, Gaskova D. Activity of yeast multidrug resistance pumps during growth is controlled by carbon source and the composition of growth-depleted medium: DiS-C3(3) fluorescence assay. Int J Biochem Cell Biol 2005; 37: 2536–2543
- Cadek R, Chladkova K, Sigler K, Gaskova D. Impact of the growth phase on the activity of multidrug resistance pumps and membrane potential of S. cerevisiae: effect of pump overproduction and carbon source. Biochim Biophys Acta 2004; 1665: 111–117
- Krasowska A, Chmielewska L, Adamski R, Luczynski J, Witek S, Sigler K. The sensitivity of yeast and yeast-like cells to new lysosomotropic agents. Cell Mol Biol Lett 2004; 9: 675–683
- Gonzalez B, Francois J, Renaud M. A rapid and reliable method for metabolite extraction in yeast using boiling buffered ethanol. Yeast 1997; 13: 1347–1355
- Viegas CA, Sebastiao PB, Nunes AG, Sa-Correia I. Activation of plasma membrane H(+)-ATPase and expression of PMA1 and PMA2 genes in Saccharomyces cerevisiae cells grown at supraoptimal temperatures. Appl Environ Microbiol 1995; 61: 1904–1909
- Rosa MF, Sa-Correia I. In vivo activation by ethanol of plasma membrane ATPase of Saccharomyces cerevisiae. Appl Environ Microbiol 1991; 57: 830–835
- Serrano R. H+-ATPase from plasma membranes of Saccharomyces cerevisiae and Avena sativa roots: purification and reconstitution. Methods Enzymol 1988; 157: 533–544
- Serrano R, Kielland-Brandt MC, Fink GR. Yeast plasma membrane ATPase is essential for growth and has homology with (Na++K+), K+- and Ca2 + -ATPases. Nature 1986; 319: 689–693
- Everitt AV, Le Couteur DG. Life extension by calorie restriction in humans. Ann N Y Acad Sci 2007; 1114: 428–433
- Fabrizio P, Battistella L, Vardavas R, Gattazzo C, Liou LL, Diaspro A, Dossen JW, Gralla EB, Longo VD. Superoxide is a mediator of an altruistic aging program in Saccharomyces cerevisiae. J Cell Biol 2004; 166: 1055–1067
- Oliver JD. The viable but nonculturable state in bacteria. J Microbiol 2005; 43(spec No): 93–100
- Vachova L, Palkova Z. Physiological regulation of yeast cell death in multicellular colonies is triggered by ammonia. J Cell Biol 2005; 169: 711–717
- Vachova L, Kucerova H, Devaux F, Ulehlova M, Palkova Z. Metabolic diversification of cells during the development of yeast colonies. Environ Microbiol 2009; 11: 494–504