Abstract
2B is a 99 amino acid membrane protein encoded by enteroviruses such as polio and coxsackie viruses with two transmembrane domains. The protein is found to make membranes of infected cells permeable. Using a computational approach which positions the models and assesses stability by molecular dynamics (MD) simulations a putative tetrameric bundle model of 2B is generated. The bundles show a pore lining motif of three lysines followed by a serine. The bundle is discussed in terms of different possible orientations of the helices in the membrane and the consequences this has on the in vivo activity of 2B.
Introduction
Viral channel and pore forming proteins, also called viroporins Citation[1], induce a change of the permeability of host cell membranes thereby improving the mode of action of the virus within the host cell Citation[2], Citation[3]. In many cases the amino acid sequence of the putative channel forming proteins are known, but their role, mechanism of function and structure still remains to be elucidated.
Computational methods are a valuable tool modelling structural and eventually also mechanistic features of a protein. With the lack of structural information these methods rely on assumptions which need to be made to generate a potential ‘in vivo’ protein structure. One of the assumptions is that the proteins, produced in the ER, follow the so called two-stage model of membrane protein folding and oligomerization which has been recently expanded into the three stage model Citation[4–6]. More steps need to be elucidated when constructing finally an ion or substrate conducting pore. The two-stage model holds for the oligomerization of helical transmembrane domains (TMDs) when dealing with polytopic proteins such as 2B from Polio virus Citation[7–9] and p7 from HCV Citation[10], Citation[11], each having two TMDs, and 3a from SARS-CoV with three TMDs Citation[12].
Experimental data of the number of monomers forming the assembly are difficult to obtain. Computational methods may serve to deliver this information until further experimental data are available. Several approaches have already been described and used in the literature Citation[13–20].
In this study, a protocol is employed which enable the generation of assemblies of two or more helices which are seen as the ‘monomeic subunit’ of larger bundles or pores (see also Citation[21], Citation[22]). The protocol builds on a fast generation of helices, generation of monomers (monomeric subunits) out of the individual helices and finally copies of the monomers around a central axis froming the model pore. After each of the steps the models are equilibrated with multi nano second molecular dynamics (MD) simulation.
2B from Polio virus has been chosen to study fast assembly protocols. 2B is a 99 amino acid non-structural protein encoded also by other enteroviruses such as coxsackie and ECHO viruses Citation[23], Citation[24]. The protein is mostly located in the Golgi and endoplasmic reticulum where it is involved in change of Ca2+ concentration in the stores Citation[25]. 2B is assumed to consist of two TMDs which oligomerize and form SDS-PAGE resistant tetramers Citation[7], Citation[9], Citation[26–29]. One of the TMDs is amphipathic (helix 1) and mutations of the positive charges (lysines) in this region abrogate viral growth Citation[30], the other (helix 2) is more hydrophobic. Permeability studies have shown a defined cut-off size for the permeating substrates to be in the order of 660 kDa indicating a possible topological flexibility. Structural information is lacking to date.
Materials and methods
The following sequences were taken to model the two transmembrane (TM) helices of 2B from polio virus (PV used to indicate the structural models) and coxsackie virus (COX):The amino acids used to model the TMDs are underlined and shown in bold. The residues in italics indicate the linker region between the two TMDs.
Generation of single helices
Single helices were generated using X-PLOR Citation[31] and a simulated annealing (SA) protocol combined with MD simulations. The SA/MD protocol has been used in previous work Citation[11], Citation[17] where it is explained in detail. The protocol consists of two stages. In a first stage an ideal α-helix based on the Cα atoms was generated with 5° initial tilt. The side chain atoms were superimposed onto the Cα atoms. Gradually the side chain atoms were produced during an annealing phase starting at 1000 K, with weight factors increasing for bond length, bond angle planarity and chirality. After an initial delay a repulsive van der Waals (vdW) term was introduced and the helix cooled to 300 K in steps of 10 K/0.5 ps with the van der Waals radii reduced to 80% of their original values. This allowed the atoms to pass each other and to avoid any inaccurate conformation. Repeating this procedure five times delivered five structures. Each of these structures was then used five times in a short MD simulation (stage 2) with initial velocities corresponding to 500 K. The Cα atoms were able to move freely within their particular topology when the temperature was decreased from 500–300 K. At this stage the partial charges (PARAM19) were introduced, gradually scaled up from 0.005–0.4 of their full value and kept at this value for the rest of the protocol. At 300 K a 5 ps MD simulations (CHARMM force field, Verlet integration method) was performed followed by a 1000 step conjugate gradient minimization. A distance-dependent dielectric function was used with a switching function smoothly truncating the long-range electrostatic interactions. Out of the 25 structures generated in stage 2 one structure was chosen, which was not seen with any kink. The structure was embedded in a fully solvated 128 POPC (1-palmitoyl-2-oleoyl-sn-glycerol-3-phosphatidylcholine) lipid bilayer and subjected to 800 ps equilibration run followed by 3 ns of MD simulation.
Generation of 2B monomers
All calculations were performed using the Crystallography and NMR System (CNS) Citation[32] with the OPLS parameter set and united atom topology, explicitly describing only polar and aromatic hydrogens. The 2B monomers were generated from pairs of ideal helices generated as mentioned above.
The conformations of theTM helix pairs were searched starting from both left and right crossing angles (−25° or +25°), with the helices rotating from 0–360° in 45° increments. Each of these pairs was subjected to four simulation runs of 200 steps, with a step size of 0.004 ps at 300 K. The resulting 512 structures were grouped into clusters. A cluster was defined as having at least 10 structures with a relative root-mean-square-deviation of the backbone atoms of not more than 1.0 Å from one member of the cluster to another member of the same cluster. The average structure of each cluster was used for further analysis (see values in s and II). In the text, the term cluster refers to the average structure of a cluster of helical pairs.
Table I. Buried surface area (BSA) of the averaged structures of Polio and Coxsackie 2B monomers taken from the cluster calculations shown in . The listed values were extracted from solvent accessible area calculations using the program Naccess Citation[36].
Before running the MD simulations of the monomers in a fully hydrated lipid bilayer each of the helical pairs (monomers) was connected with the amino acids of the linker region. The ‘Loopy’ program within Jackal 1.5 package for modelling and analysis of protein structures was applied to place the amino acids Citation[33]. The Loopy program uses the colony energy approach to account for entropic effects and fast torsion space minimizer to speed up the conformation sampling. The monomers were then inserted into a 128 molecule POPC bilayer. An 800ps equilibration was carried out (see Supplementary Figure, online version only) before the full 10 ns simulation.
Generation of tetramers
Tetramers were generated using an XPLOR script which duplicates, rotates and translates a monomer so as to create a tetramer with rotational symmetry about the centre. An orientation of the helix was chosen which positions the polar residues towards the center of the tetramer and the hydrophobic residues forming contacts with neighbouring monomers or the lipid tails of the bilayer. Such an orientation of the monomers has been assumed to stabilize bundle structure and has been supported by experimental evidence Citation[29]. The orientation has also been chosen to form other bundles of viral cannel forming proteins Citation[11], Citation[34], Citation[35].
Tetramers were inserted into a larger, 288 molecule POPC bilayer. As with the single helices and monomers, an 800 ps equilibration simulation was carried out with protein movement restrained to allow the lipids to pack around the protein (see Supplementary Figure, online version only). In the case of the tetramers, the equilibration allowed water molecules to fill the pore. All tetramers were subject to an unrestrained simulation of 11 ns.
Molecular Dynamics simulations
All simulations were carried out with GROMACS 3.2.1 package. The simulations were conducted in the NPT ensemble employing Berendsen algorithm of coupling to an external bath of constant temperature of 300 K, and pressure of 1 bar in all directions. Protein, lipid, water atoms and ions were separately coupled to the external temperature bath and as a system to the pressure baths with coupling constants τT=0.1 ps and τp=1.0 ps, respectively. The ‘leap-frog’ reference algorithm was used for the numerical integration of the equations of motion with a time step of 2 femto seconds for an overall simulation time of ca. 1.2 ns. Energy minimizations were performed employing the steepest descent algorithm. The GROMOS96 force field was used as implemented in GROMACS. All bond distances in the system were constrained through the LINCS algorithm. The electrostatic interactions were computed using the Particle Mesh Ewald (PME) summation algorithm and vdW interactions were modelled using a 6-12 Lennard-Jones potential with a 1 nm cut-off. The total number of atoms for the single helix simulations was between 22953 and 24384, the 2B monomers between 22674 and 23169 and the tetramers between 36492 and 53237.
Naccess (www.bioinf.manchester.ac.uk/naccess/) was used to calculate the solvent accessible area (SAS) of the monomers. In this program a probe of given radius (typically 1.4 Å) is rolled around the Van der Waals (vdW) surface of the molecule, and the path traced out by its centre is the solvent accessible surface Citation[36]. The buried surface area (BSA) of a helical dimer was then determined by adding the SAS of the individual helices and subtracting this value from the SAS of the helical dimer.
Results
The single helices and monomers
The individual helices are placed in a fully hydrated lipid bilayer to derive an equilibrated structure. The root mean square deviation (RMSD) of the Cα atoms for each of the individual helices level off after 0.5 ns and fluctuate around 0.1 nm (A) indicating minor conformational changes compared to their initial starting structure. The values for helix 2 of PV protein rise to 0.3 nm after 1.5 (A, grey dashed line). This rise is due to an increase in kink angle around Ala-32. The kink angle changes from ∼20° to ∼45° during this time period (data not shown). The kink disappears later in the simulation and is not observed during the simulations of the monomers and tetramers.
Figure 1. Root mean square deviation (RMSD) of the Cα atoms for the single helices (A) with helices 1 from PV (thick black line) and COX (thin black line) and helices 2 for PV (grey dashed line) and COX (grey line), the 2B monomers (B) with PV4 (thick black line), PV3 (thin black line), COX8 (thick grey line) and COX6 (dashed grey line), and the respective tetrameric bundles (C).
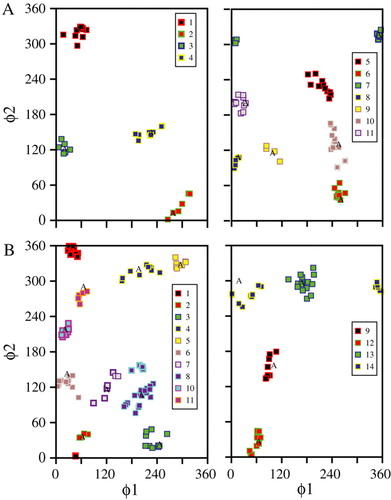
The 2B monomers are selected using a minimum RMSD cut-off between structures of 1.0, and a cluster size of at least 10. These parameters lead to the generation of 11 PV clusters (A) and 14 COX clusters (B). contains all clusters and groups with the left handed structures in the left panel and the right handed structures in the right panel. Plotting the rotational angles of each of the two helices (φ1 of helix1 and φ2 of helix 2) for each of the clusters shows that PV clusters 3 and 4 (A, left panel) and COX clusters 6 and 8 (B, left panel) have helices with the same rotation. Based on the φ angles clusters PV3 and COX6 adopt rotational angles of φ1 ∼30°/φ2 ∼120°. Structures of clusters PV4 and Cox 8 have values of φ1 ∼210°/φ2 ∼100°. All clusters adopt a left handed structure.
Figure 2. Monomer structures generated by CHI represented by their φ1 and φ2 values indicative for the handedness of the helical pairs. φ1 represents the rotation of helix 1 relative to its starting position and φ2 represents the rotation of helix 2. The data from PV are shown in the top row (A), those for the COX in the bottom row (B). For (A) and (B) the left handed structures are shown in the left panel and the right handed structures in the right panel. ‘A’ indicates the values for the averaged structure of each of the clusters.
Even though PV cluster 3 (PV3; A) has been identified to be similar to COX cluster 6 (COX6; C) the buried surface areas of the two clusters are quite different (with PV3 having a value of 1172 Å2 and COX6 a value of 1297 Å2 []). Also the values for electrostatic interactions and total energy differ (Table 2). This suggests that different interactions occur between the helices. Both clusters have VdW energies of about 50–60 kJ/mol. All values are taken from the averaged structures, indicated as A of each of the cluster in .
Figure 3. Averaged structures (indicated as A in ) of the 2B monomers of the PV3 (A), PV4 (B), COX6 (C) and COX8 (D) cluster. The individual residues are marked by an arrow, in addition a grey scale colour code according to RASMOL is used. For the sake of clarity, in (C) and (D) the second helix (right) has no labels. The labels are according to the second helix in (A) and (B). This figure is reproduced in colour in the online version.
PV cluster 4 (PV4; B) has been identified to be similar to COX cluster 8 (COX8; D), even though PV4 shows a different value for the buried surface (1160 Å2, PV4, and 1127 Å2, COX8; ). Whereas PV4 has the most favorable VdW interaction of all PV clusters (36.9 kJ/mol; ), the COX8 VdW energy is about 67 kJ/mol. The lowest, most favorable energy values (both total energy, −1576 kJ/mol, and electrostatic energy −1736 kJ/mol) out of the COX clusters is calculated for COX8.
Table II. Total, electrostatic and vdW energies of the averaged structures of the 2B monomers using CHI as part of the CNS software Citation[31]. Structures were taken from cluster calculations shown in . All values are given in kJ/mol.
Other clusters which show favorable interactions are COX3 and PV8. COX3 has the highest BSA (1318 Å2, ) and best VdW energy (51 kJ/mol, ) out of the COX clusters, although its total energy is high (−1483 kJ/mol, ). PV8 also shows a high buried surface area of 1256 Å2, as well as having the lowest total energy value (−1745 kJ/mol), but has non-favorable VdW interactions (62.2 kJ/mol).
PV3 and COX6 are chosen for simulations as they show similar orientations of their helices, suggesting the possibility that they could form tetramers with similar structures. PV3 also has the lowest energy (−1725 kJ/mol) besides PV8. COX6 has the second highest buried surface area (1297 Å2) and third best electrostatic energy (−1700 kJ/mol) out of the COX clusters. PV4 and COX8 are also chosen for simulation based on the same helix orientation. PV4 shows the lowest VdW energy (36.9 kJ/mol) out of the PV clusters and COX8 has the best total (−1576 kJ/mol) and electrostatic energy (−1736 kJ/mol) out of the COX clusters.
Considering both buried surface area and total energy does not give a consistent picture in terms of the ranking of the clusters. Ranking according to individual criteria (overlap, buried surface, VdW, electrostatics and total energy) shows that PV3 and COX8 appear to be amongst the top 3 for each individual criterion.
For the successive modelling the averaged structure over all the members of the cluster is calculated and used.
All lysine residues, Lys-5, -8, and -12 of helix 1 in all simulations of the single helix (A, PV4 as an example) and the 2B monomers interact with water and polar headgroups at either side of the bilayer surface.
Figure 4. PV4 helix 1 (A) and helix 2 (B) shown with the relevant residues indicated by arrows. The residues are shown in vdW representation and highlighted using a grey scale colour code (RASMOL). The lipid membrane is show in stick modus, water molecules are omitted for clarity. The monomers seen from different perspectives (C and D). The residues are indicated by arrows and are also highlighted in a grey scale colour representation. This figure is reproduced in colour in the online version.
Using the program ‘Loopy’, the two helices of the clusters are connected to form 2B monomers. RMSDs of each of these monomers simulated for 10 ns (6 ns in case of COX6) are shown in B. Whilst COX8, PV3 and 4 are leveling off at around 0.25 nm, COX6 shows rather high RMSD values of around 0.4 nm. A visible inspection shows that the two helices are tilted in opposite directions to one another. Helix 1 adopts a tilt of 25° and helix 2 a tilt of −35°, causing a less interactions between them.
The inter-helical loop contains a string of residues (Arg-Asn-Tyr-Glu in PV, Arg-Asn-His in COX) with non-zero amphiphilicity index Citation[36] (except for Asn), suggesting a preference for being situated at the membrane-water interface. B and 4D show PV4 with asparagine, arginine, tyrosine and glutamate residues (all in space filled mode) interacting at the lipid-water interface. Also the two tryptophans in helix 2 reside at the lipid-water interface (B).
The conformation of the COX6 monomer after 6 ns was such that it would produce a tetrameric bundle structure with minimal interactions between helix 2 and other monomers (data not shown). This structure would therefore not be in accord with the mutational data, which show that specific hydrophobic residues in helix 2 are essential for oligomerization Citation[38]. It would therefore appear that a COX6 tetramer would not be stable due to poor interactions between the monomers.
Tetramer simulations
The RMSD values for all the four bundles rise to an approximate level between 0.3 and 0.6 nm within the first 3 ns and remain on their individual levels for the rest of the simulation (C).
The bundles are modelled so that the hydrophilic residues of the amphipathic helix 1 point into the lumen of the pore (A). After 11 ns simulation the PV4 tetramer the overall orientation of all the residues remains so that the polar residues face the centre of the putative pore (B). After 4 ns the narrowest point of the pore varies between 5 and 7Å allowing for a continuous water column in the lumen of the pore (C). Residues Lys-5, -8, -12 and Glu-25 are part of the hydrophilic lumen of the bundle (A), so are Ser-16 and -15 (B). Ala-32, -35 are located towards the helix1/-2 interface suggesting that it supports the packing (C). Trp-44 also adopts a position which enables the residue to point into the pore (C). The residues linking the two helices, Arg-22 and Glu-25, are in a position that may affect the electrostatics at the entrance of the channel lumen ().
Figure 5. Tetrameric bundle of PV4 at 0 ns (A) and after 11 ns of simulations (B and C). The dark colour stands for hydrophilic residues, the grey colour for hydrophobic residues (RASMOL). The water molecules are shown in light grey and in van der Waals representation (C). Only the waters within the pore are shown. The lipid molecules and their hydrating water molecules are omitted for clarity. This figure is reproduced in colour in the online version.
Figure 6. Models of PV4 from with individual amino acids are shown in their vdW representation, indicated by arrows and highlighted (RASMOL). Alanines, glycines and tryptophans are shown in panel A. The bundle is shown in a side (left column) and top view from the N and C termini (right column). Lysines, glutamic and aspartic acids are shown in panel B. Serines and threonines are shown in panel C.
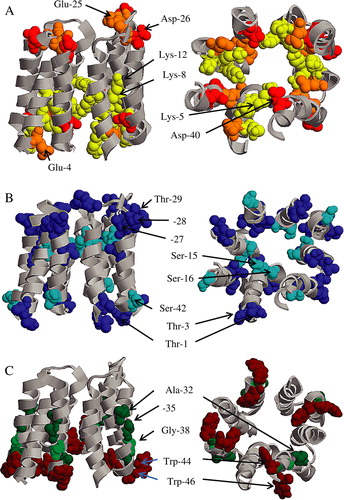
Figure 7. Tip view of the loop region with Arg-22, Asn-23, Tyr-24, Glu-25 and Asp-26 shown in vdW representation and indicated by arrows. A grey scale colour code is used (RASMOL). This figure is reproduced in colour in the online version.
The averaged BSA over all the monomers of PV4 calculated at three different time points during the MD simulation has decreases from (669.6±37.9) Å2 (0 ns) to (350.6±184.8) Å2 (5 ns) and (302.4±190.6) Å2 (11 ns). During the same time lipid thickness remains unaffected with averaged values of (34.4±0.2) nm calculated from the first half of the simulation (taken from snapshots at 0, 2 and 4 ns) and (33.7±0.1) nm calculated from the last half of the simulation (taken from snapshots at 6, 8, 10 and 11 ns). The values BSA and lipid thickness calculated for the other bundles follow the same trend (data not shown). The initial decrease of BSA from 1160 Å2 to 669 Å2 is due to a loss of contact caused by the minimization features applied in the MD simulation protocol.
The data of the BSA indicate that during the simulation the monomer loses some of its closed packing. The time evolution of the data in combination with the RMSD results (PV4, thick black line, C) supports the assumption that the system reaches an equilibrated state under the applied experimental conditions.
The PV4, the PV3 tetramer appears to equilibrate after 4 ns with a pore diameter varying between 5 and 7Å (data not shown). However, there is a greater change from the starting structure of the protein. This is seen especially for one of the monomers, for which the amphipathic helix shows a tilt of 50° in respect to the bilayer. The major change in protein structure for the COX8 tetramer is an increase of the tilt angles of the amphipathic helices from 15° to about 40° (data not shown). A constriction is visible towards the end with the loops, which reduces the diameter to 3Å. With the widening towards the N- and C termini (6–8 Å) the tetrameric bundle adopts a tepee like structure in which the water column at the narrowest point is disrupted.
Discussion
The overall approach used here draws heavily on the ‘two-’ and ‘three-stage’ models proposed by Popot and Engelman Citation[4], Citation[5]. The model describes the principal stages of how membrane proteins are built: First the secondary structure – here the stretch of a helix – is built within the lipid membrane, then the tertiary – here the monomeric dimmers – or the quaternary structure Citation[5] (here the tetrameric bundle) is assembled. This approach has been adopted in the literature to generate the structure of viral Citation[11], Citation[39–41] and other channel forming proteins Citation[42], Citation[43].
Ideal helices have been generated and used to form 2B monomers with the aim to enable an optimized packing. The tetrameric bundles are then modelled by rotating and translating the monomers in such a way that in a putative bundle their hydrophilic residues are pointing towards the lumen of the pore Citation[24]. Each of the monomers and tetrameric bundles are subject to multi nano second MD simulations to assess their conformational stability. The orientation of the monomers within the bundle is based on the idea of hydrophilic residues forming the lumen of the pore. This is generally accepted and used so far in the literature to generate bundles from monomeric units Citation[22], Citation[25], Citation[44–46].
The particular helical pairs have been chosen for monomers because 2B proteins from polio and coxsackie viruses have an identity of 50% and 66% for their TMDs. This makes it likely that the structures of the proteins will be similar for both species in vivo.
Roles of the linker region and other amino acids
An essential feature in membrane proteins is the linker or loop region which connects the TM helices within a membrane protein and is therefore involved in shaping the overall protein Citation[46]. In the simulations all hydrophilic residues of the linker region face the aqueous medium. In the current model Arg-22 and Glu-25 interact with each other and screen the mouth of the pore whilst Asp-26 faces the intra-subunit and protein-lipid interfaces. The positions of Glu-25 and Asp-26 in this study are similar to those found for D-61 and D-62 (see Citation[38]). The role of these amino acids in the mechanism of function of 2B of coxsackie virus has been analyzed Citation[38]. It also has been shown that replacement of these two residues (D-61/62) leads to abrogation of multimerization and a decrease in membrane permeability. The position shown in suggests that Glu-25 and Asp-26 are involved in the formation of monomers, which are essential prerequisites for channel formation.
Trp-44 and Trp-46 can either face the lumen of the pore (C) or point towards the outside of the bundle (Trp-46). They follow Pro-43 in the sequence which may lock their orientation even further. Being at the C terminus of the bundle, Trp-44 and Trp-46 are responsible for the orientation of the extra-membrane part of the C terminus. As found experimentally Citation[38], double mutation of the conserved tryptophans located at the C-terminus of helix 2 decreases membrane permeability but does not affect the multimerization. The tryptophans, possibly together with the prolines, direct parts of the TMDs and the extra-membrane domains relevant for permeability to proper positions at the membrane surface. This further supports the idea that tryptophans are relevant for membrane protein anchoring and directing in lipid membranes. Mutations of hydrophilic residues within the short linker region between the two TMDs domains readily impair the multimerization and also decrease membrane permeability. Mutations of tryptophans towards the C terminus of the second TMD domain show also abrogation of membrane permeability without affecting multimerization of the protein. The results are supported by similar studies on hygromycin B Citation[38].
Lysines
The lysine residues of the amphipathic helix 1 in all monomer simulations point towards the bilayer surface (A), with all three lysine residues having at least one water molecule within hydrogen bonding distance of < 2.2Å Citation[47]. This orientation is known as ‘snorkeling’ and it has been shown that the energetic cost of placing a charged lysine residue into a membrane is lower if snorkeling occurs Citation[49]. The exact position of the lysine side chain within the lipid membrane may also dependent on its protonation state Citation[50].
Tetramer
For bundle formation the helix with most of the hydrophilic residues along one side of the helix has been chosen to point towards the lumen of the tetrameric pores. This means that in the bundle, a line of three lysines followed by a serine should point towards the lumen. Such a motif has not yet been outlined on a structural level in the literature. Other hydrophilic residues such as serines and threonines in all the bundles are not forming a continuous line along one side. As for Ser-15 and Thr-1 in helix 1, they are separated by four helical turns with hydrophobic residues separating them. Part of the separation may be covered by the flexible side chains of the lysines (Lys-5, -8 and -12).
In the current most stable model, PV4, Trp-46 is at the outer side of the bundle and at a place where it will be able to fulfill its role anchoring the bundle in the lipid bilayer. Trp-44 on the other hand is facing the pore.
In the MD simulations all bundles adopt tepee-like structures, which is not unusual considering the large density of the positive charge towards the N terminus of the bundle. One may speculate whether helix 1 floats on the membrane surface rather than being inserted. This conformation may be supported by a hydrophobic line opposing the hydrophilic stretch of helix 1.
Topology
It is also suggested that interaction of helix 1 with the membrane is an essential step for assembly Citation[29]. Therefore L-shape assembly can be envisaged, with helix 1 floating on top of the membrane and residues Thr-29, Thr-33, Asp-40 of helix 2 lining a pore. It should be mentioned that the L-shape model may also represent an ‘extreme’ orientation. Energetic investigations of whether a transition is possible under physiological conditions have not yet been undertaken. Any intermediate models, possibly involving a tepee-like structure, could also be adopted as seen in other channels Citation[51–53].
Considering flexibility of the L shaped structure, the bundle formed could be cation selective due to Asp-40, whilst in a parallel alignment it could be anion selective due to the lysines. The bundle could even enable small molecules to traverse the pore since in parallel arrangement it adopts a teepee like structure.
PV4 is chosen as a representative bundle in the figures since it maintains finally a continuous water column throughout the simulation as a tetramer. Although a water-filled bundle may not be the ‘ultimate’ criterion for a proper structural model, the bundle represents a plausible model at the current stage of investigation.
Conclusions
A computational protocol was used to model the putative structure and assembly of the pore forming proteins from polio and coxsackie viruses. At this stage model building is based on the hypothesis that the TM motif is helical and the assembly follows the ‘two-’ and ‘three-stage’ models. On the basis of these ideas it is suggested that lysines partially contribute to the lumen of the pore. It is also concluded that this motif in combination with topological and structural flexibility may account for the experimental findings of these proteins to conduct also small molecules. This is in support of the idea of a channel/pore dualism of these proteins [54].
Acknowledgements
WBF and AW thank the Bionanotechnology IRC for financial support (GR/R45650/01). The MRC is acknowledged for grant support (MRC Programme grant G000852). Declaration of interest: The authors report no conflicts of interest. The authors alone are responsible for the content and writing of the paper.
References
- Gonzales ME, Carrasco L. Viroporins. FEBS Lett 2003; 552: 28–34
- Fischer, WB. 2005. Viral membrane proteins: Structure, function and drug design. In:. MZ Atassi. Protein reviews. 1. New York: Kluwer Academic/Plenum Publisher.
- Fischer WB, Krüger J. Viral channel forming proteins. Int Rev Cell Mol Biol 2009; 275: 35–63
- Popot J-L, Engelman DM. Membrane protein folding and oligomerization: The two-stage model. Biochemistry 1990; 29: 4031–4037
- Engelman DM, Chen Y, Chin C-N, Curran AR, Dixon AM, Dupuy AD, Lee AS, Lehnert U, Matthews EE, Reshetnyak YK, Senes A, Popot J-L. Membrane protein folding: Beyond the two-stage model. FEBS Lett 2003; 555: 122–125
- Bowie JU. Solving the membrane protein folding problem. Nature 2005; 438: 581–589
- van Kuppeveld FJ, Galama JM, Zoll J, Melchers WJ. Genetic analysis of a hydrophobic domain of coxsackie B3 virus protein 2B: A moderate degree of hydrophobicity is required for a cis-acting function in viral RNA synthesis. J Virol 1995; 69: 7782–7790
- Aldabe R, Barco A, Carrasco L. Membrane permeabilization by poliovirus proteins 2B and 2BC. J Biol Chem 1996; 271: 23134–23137
- van Kuppeveld FJM, Melchers WJG, Kirkegaard K, Doedens JR. Structure-function analysis of coxsackie B3 virus protein 2B. Virology 1997; 227: 111–118
- Carrère-Kremer S, Montpellier-Pala C, Cocquerel L, Wychowski C, Penin F, Dubuisson J. Subcellular localization and topology of the p7 polypeptide of Hepatitis C virus. J Virol 2002; 76: 3720–3730
- Patargias G, Zitzmann N, Dwek R, Fischer WB. Protein-protein interactions: Modeling the hepatitis C virus ion channel p7. J Med Chem 2006; 49: 648–655
- Lu W, Zheng B-J, Xu K, Schwarz W, Du L, Wong CKL, Chen J, Duan S, Deubel V, Sun B. Severe acute respiratory syndrome-associated coronavirus 3a protein forms an ion channel and modulates virus release. Proc Natl Acad Sci USA 2006; 103: 12540–12545
- von Heijne. 1992. Membrane protein structure prediction. Hydrophobicity analysis and the positive inside rule. J Mol Biol, 225:487–494.
- Adams PD, Arkin IT, Engelman DM, Brünger AT. Computational searching and mutagenesis suggest a structure for the pentameric transmembrane domain of phospholamban. Nature Struc Biol 1995; 2: 154–162
- Adams PD, Engelman DM, Brünger AT. Improved prediction for the structure of the dimeric transmembrane domain of glycophorin A obtained through global searching. Proteins 1996; 26: 257–261
- Forrest LR, Kukol A, Arkin IT, Tieleman DP, Sansom MS. Exploring models of the influenza A M2 channel: MD simulations in a phospholipid bilayer. Biophys J 2000; 78: 55–69
- Cordes F, Kukol A, Forrest LR, Arkin IT, Sansom MSP, Fischer WB. The structure of the HIV-1 Vpu ion channel: Modelling and simulation studies. Biochim Biophys Acta 2001; 1512: 291–298
- Kim S, Chamberlain AK, Bowie JU. A simple method for modeling transmembrane helix oligomers. J Mol Biol 2003; 329: 831–840
- Vereshaga YA, Volynsky PE, Pustovalova JE, Nolde DE, Arseniev AS, Efremov RG. Specificity of helix packing in transmembrane dimer of the cell death factor BNIP3: A molecular modeling study. Proteins: Struc Func Gen 2007; 69: 309–325
- Psachoulia E, Fowler PW, Bond PJ, Sansom MSP. Helix-helix interactions in membrane proteins: Coarse-grained simulations of glycophorin A helix dimerization. Biochemistry 2008; 47: 10503–10512
- Krüger J, Fischer WB. Exploring the conformational space of Vpu from HIV-1: A versatile and adaptable protein. J Comp Chem 2008; 29: 2416–2424
- de Jong AS, Wessels E, Dijkman HBPM, Galama JMD, Melchers WJG, Willems PHGM, van Kuppeveld FJM. Determinants for membrane association and permeabilization of the coxsackie virus 2B protein and the identification of the Golgi complex as the target organelle. J Biol Chem 2003; 278: 1012–1021
- Nieva JL, Agirre A, Nir S, Carrasco L. Mechanism of membrane permeabilization by picornavirus 2B viroporin. FEBS Lett 2003; 552: 68–73
- de Jong AS, Visch H-J, de Mattia F, van Dommelen MM, Swart HG, Luyten T, Callewaert G, Melchers WJ, Willems PH, Van Kuppeveld FJ. The coxsackie virus 2B protein increases efflux of ions from the endoplasmic reticulum and Golgi, thereby inhibiting protein trafficking through the Golgi. J Biol Chem 2006; 281: 14144–14150
- Cuconati A, Xiang W, Lahser F, Pfister T, Wimmer E. A protein linkage map of the P2 nonstructural proteins of poliovirus. J Virol 1998; 72: 1297–1307
- de Jong AS, Schrama IW, Willems PH, Galama JM, Melchers WJ, van Kuppeveld FJ. Multimerization reactions of coxsackie virus proteins 2B, 2C and 2BC: A mammalian two-hybrid analysis. J Gen Virol 2002; 83: 783–793
- van Kuppeveld FJM, Melchers WJG, Willems PHGM, Gadella TWJ, Jr. Homomultimerization of the coxsackie virus 2B protein in living cells visualized by fluorescence resonance energy transfer microscopy. J Virol 2002; 76: 9446–9456
- Agirre A, Barco A, Carrasco L, Nieva JL. Viroporin-mediated membrane permeabilization. Pore formation by nanostructural poliovirus 2B protein. J Biol Chem 2002; 277: 40434–40441
- van Kuppeveld FJM, Galama JMD, Zoll J, van den Hurk PJJC, Melchers WJG. Coxsackie B3 virus protein 2B contains a cationic amphipathic helix that is required for viral RNA replication. J Virol 1996; 70: 3876–3886
- Brünger AT. X-PLOR Version 3.1. A system for X-ray crystallography and NMR. Yale University Press, New Haven, CT 1992
- Brünger A, Adams P, Clore G, Gros W, Grosse-Kunstleve R, Jiang J, Kuszewski J, Nilges M, Pannu N, Read R, Rice L, Simonson T, Warren G. Crystallography and NMR system: A new software suite for macromolecular structure determination. Acta Crystallogr D Biol Crystallogr 1998; 54: 905–921
- Xiang Z, Soto CS, Honig B. Evaluating conformational free energies: The colony energy and its application to the problem of loop prediction. Proc Natl Acad Sci USA 2002; 99: 7432–7437
- Candler A, Featherstone M, Ali R, Maloney L, Watts A, Fischer WB. Computational analysis of mutants in the transmembrane region of Vpu from HIV-1. Biochim Biophys Acta 2005; 1716: 1–10
- Lemaitre V, Ali R, Kim CG, Watts A, Fischer WB. Interaction of amiloride and one of its derivative with Vpu from HIV-1: A molecular dynamics simulation. FEBS Lett 2004; 563: 75–81
- Lee B, Richards FM. The interpretation of protein structures: Estimation of static accessibility. J Mol Biol 1971; 55: 379–400
- Mitaku S, Hirokawa T, Tsuji T. Amphiphilicity index of polar amino acids as an aid in the characterization of amino acid preference at membrane-water interfaces. Bioinformatics 2002; 18: 608–616
- de Jong AS, Melchers WJ, Glaudemans DH, Willems PH, van Kuppeveld FJ. Mutational analysis of different regions in the coxsackie virus 2B protein: Requirements for homo-multimerization, membrane permeabilization, subcellular localization, and virus replication. J Biol Chem 2004; 279: 19924–19935
- Kukol A, Arkin IT. Vpu transmembrane peptide structure obtained by site-specific fourier transform infrared dichroism and global molecular dynamics searching. Biophys J 1999; 77: 1594–1601
- Zhong Q, Newns DM, Pattnaik P, Lear JD, Klein ML. Two possible conducting states of the influenza A virus M2 ion channel. FEBS Lett 2000; 473: 195–198
- Cordes FS, Tustian A, Sansom MSP, Watts A, Fischer WB. Bundles consisting of extended transmembrane segments of Vpu from HIV-1: Computer simulations and conductance measurements. Biochemistry 2002; 41: 7359–7365
- Dieckmann GR, Lear JD, Zhong Q, Klein ML, DeGrado WF, Sharp KA. Exploration of the structural features defining the conduction properties of a synthetic ion channel. Biophys J 1999; 76: 618–630
- Davies LA, Klein ML, Scharf D. Molecular dynamics simulation of a synthetic four-α-helix bundle that binds the anesthetic halothane. FEBS Lett 1999; 455: 332–338
- Grice AL, Kerr ID, Sansom MSP. Ion channels formed by HIV-1 Vpu: A modelling and simulation study. FEBS Lett 1997; 405: 299–304
- Fischer WB, Pitkeathly M, Wallace BA, Forrest LR, Smith GR, Sansom MSP. Transmembrane peptide NB of influenza B: A simulation, structure, and conductance study. Biochemistry 2000; 39: 12708–12716
- Lopez CF, Montal M, Blasie JK, Klein ML, Moore PB. Molecular dynamics investigation of membrane-bound bundles of the channel-forming transmembrane domain of viral protein U from the Human Immunodeficiency Virus HIV-1. Biophys J 2002; 83: 1259–1267
- Tastan O, Klein-Seetharaman J, Meirovitch H. The effect of loops on the structural organization of α-helical membrane proteins. Biophys J 2009; 96: 2299–2312
- Steiner T. The hydrogen bond in the solid state. Angew Chem Int Ed 2002; 41: 49–76
- Strandberg, E, Killian, JA. 2003. Snorkeling of lysine side chains in transmembrane helices: How easy can it get?. FEBS Lett, 544.
- Tayefeh S, Kloss T, Thiel G, Hertel B, Moroni A, Kast SM. Molecular dynamics simulation study of the cytosolic mouth in Kcv-type potassium channels. Biochemistry 2007; 46: 4826–4839
- Doyle DA, Cabral JM, Pfuetzner RA, Kuo A, Gulbis JM, Cohen SL, Chait BT, MacKinnon R. The structure of the potassium channel: molecular basis of K+ conduction and selectivity. Science 1998; 280: 69–77
- Sukharev S, Betanzos M, Chiang C-S, Guy HR. The gating mechanism of the large mechanosensitive channel MscL. Nature 2001; 409: 720–724
- Wang W, Black SS, Edwards MD, Miller S, Morrison EL, Bartlett W, Dong C, Naismith JH, Booth IR. The structure of an open form of an E. coli mechanosensitive channel at 3.45 Å resolution. Science 2008; 321: 1179–1183
- Mehnert T, Routh A, Judge PJ, Lam YH, Fischer D, Watts A, Fischer WB. Biophysical characterisation of Vpu from HIV-1 suggests a channel-pore dualism. Proteins 2008; 70: 1488–1497
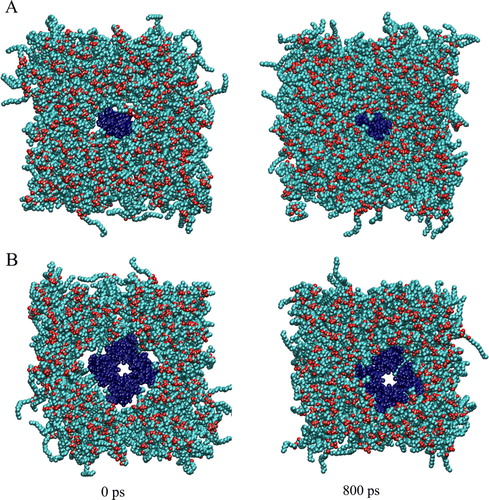
Supplementary Figure. The Simulation box of PV4 monomer (helix 1 and 2) (A) and tetramer (B) is shown at the beginning (left) and end (right) of an 800 ps equilibration run. The protein is shown in black, lipids in light grey with their oxygen atoms shown in darker grey. After 800 ps equilibration the protein is packed within the lipid membrane.