Abstract
Epithelial cells of the alimentary tract play a central role in the mucosal host defence against pathogens and in the recognition of agonists that interact with mucosal surfaces. In particular, the formyl peptide receptor (FPR) family and their three human subtypes: FPR, formyl-peptide-receptor-like-1 (FPRL1) and FPRL2, are involved in the host defence against pathogens that mediate epithelial responses thus upregulating inflammation. To elucidate the mechanisms by which FPR function, we examined the influence of phospholipase D (PLD) 1 and 2 on the activity and signal transduction of human enterocytes cell line HT29. PLD is a key enzyme involved in secretion, endocytosis and receptor signalling. We inhibited PLD1 and 2 by small interference RNA (siRNA) and determined the activity of formyl peptide receptors using Western blotting and cAMP level measurements. We then analyzed the distribution of formyl peptide receptors FPR, FPRL1 and FPRL2 compared to a control. In this study, we demonstrated that the depletion of PLD1 and 2 resulted in a marked reduction of formyl peptide receptor activity due to inhibited extracellular-signal regulated kinases 1/2 (ERK1/2), phosphorylation and cAMP level reduction. In addition, we observed an intracellular accumulation of FPR, FPRL1 and FPRL2 as a result of receptor recycling inhibition using fluorescence microscopy. The constitutive internalization rate was unaffected. Our results support the importance of PLD1 and 2 in formyl peptide receptor function and the role of endocytosis, receptor recycling and reactivation for receptor activity.
| Abbreviations | ||
| fMLF | = | formyl-methionyl-leucyl-proline |
| NECA | = | 5′-(N-Ethylcarboxamido)adenosine |
| PMA | = | Phorbol 12-myristate 13-acetate |
| 2,3-DPG | = | 2,3-diphospho-D-glyceric acid |
| FPRL1 | = | Formyl-Peptid-Receptor-Like 1 |
| PLD | = | Phospholipase D |
| PA | = | phosphatidic acid |
| PC | = | phosphatidylcholine |
| PtdEtOH | = | phosphatidylethanol |
| ERK | = | extracellular signal-regulated kinases |
| DMEM | = | Dulbecco's modified Eagle's medium |
| FCS | = | fetal calf serum |
| SFM | = | serum free medium |
| ABTS | = | 2,2′-Azino-bis(3-ethylbenzothiazoline-6-sulfonic acid) |
Introduction
Mucosal cells in the alimentary tract serve as a barrier which separates the lumen from underlying tissue and play a critical immunophysiological role in the body, in part, consisting of a paracrine network between enterocytes and underlying immune and inflammatory cells Citation[1]. Chemoattractant receptors are involved in this basal regulation and interaction as well in pathological processes such as inflammation and constitute part of the host defence's mechanism against microorganisms Citation[2]. Classical chemoattractants, such as the major peptide chemotactic factor formyl-methionyl-leucyl-phenylalanine (fMLF), is produced by Escherichia coli and is involved in the initiation and progression of inflammatory bowel disease by releasing cytokines and chemokines Citation[3]. fMLF binds to specific receptors that belong to the G-protein-coupled receptors (GPCR) superfamily, the formyl-peptide-receptors. Formyl peptide receptors play an important role in the regulation of immune functions Citation[4]. FPRL1 is defined as a low-affinity receptor, as it is activated by high concentrations of fMLF (µM range) and stands in contrast to the related high-affinity fMLF receptor FPR, which is activated by fMLF levels in the nM range. To date, little is known about the agonist spectrum of FPRL2. FPRL2 does not bind or respond to fMLF but instead shares some non-formylated chemotactic peptides identified for FPRL1 Citation[4], Citation[5]. Formyl peptide receptor transcripts were detected in a wide variety of cell populations and tissues. The FPR, FPRL1 and FPRL2 were first described in human enterocytes of the small intestine Citation[4–6].
The signalling pathways mediated by formyl-peptide-receptors are initiated through activation of a pertussis toxin-sensitive Gi protein. These pathways are comprised of various second messenger-generating effector including phospholipase A2, phospholipase C and phospholipase D (PLD), lipid kinases, and various protein kinases such as protein kinase C (PKC), tyrosine kinases, and mitogen-activated protein kinases (MAPK; Citation[7], Citation[8]). PLD is presumed to have an important function in signal transduction, membrane trafficking, and cytosceletal reorganization Citation[9], Citation[10]. PLD hydrolyzes phosphatidylcholine (PC) to generate choline and phosphatidic acid (PA). Two mammalian PLDs (PLD1 and PLD2) have been identified Citation[11], Citation[12]. Subcellular fractionation studies have demonstrated the presence of PLD1 in intracellular membranes, e.g., ER, Golgi apparatus, and vesicular compartments Citation[13], Citation[14] whereas PLD2 was shown to be largely associated with the plasma membrane Citation[13], Citation[15]. Recent studies, however, have implicated a role for PLD in the regulation of constitutive protein transit in the enterocyte cell line HT29-cl19A Citation[16]. It has been shown that PLD2 participated in regulating clathrin-coated vesicle-mediated GPCR endocytosis Citation[17–20], whereas PLD1 is implicated in initiating exocytosis Citation[21], Citation[22].
In the present study, we investigated whether PLD1 and 2 influence the activity and signal transduction of formyl peptide receptors in the human enterocyte cell line HT29. We demonstrated that the inhibition of PLD1 and 2 using small interference RNA (siRNA) resulted in a substantial reduction of formyl peptide receptor activity in HT29 cells. Receptor activity was determined by measuring phosphorylation by extracellular signal-regulated kinases (ERK1/2) and cAMP level. Moreover, the distribution of formyl peptide receptors FPR, FPRL1 and FPRL2 clearly differed in comparison to the control. Our results indicate the importance of PLD1 and 2 in FPR function and, additionally, their endocytotic role including receptor recycling and reactivation for receptor activity.
Material and methods
Reagents
2,3-DPG, fMLF, NECA, PMA, forskolin were purchased from Sigma-Aldrich (Germany).
Cell culture
Human HT29 cells were cultured in Dulbecco's modified Eagle's medium (DMEM) containing 10% FCS.
siRNA transfection
Shortly before transfection, HT29 cells were seeded in DMEM containing 10% FCS in plates or glass coverslips and were transfected with Hiperfect® (Qiagen, USA) transfecting agent containing control siRNA (5 nM) or siRNA for target proteins (5 nM) in serum-free DMEM according to the manufacturer's recommendation. Small interfering RNA (siRNA) duplexes corresponding to the human PLD1 and 2 cDNA sequences (GenBank accession number NM_002662 and NM_002663) or control siRNA (target sequence: AATTCTCCGAAGGTGTCACGT) were purchased from Qiagen. The human PLD1 and 2 sequences that were chosen for performing RNA interference targeting were CACAATTTAATCCATGGTTTA and CCGGCCTTTCGAAGATTTCAT. Cells were cultured for an additional 96 h and mRNA levels were measured using real time PCR or protein expression using Western blotting.
PLD assays
PLD activity was determined using a transphosphatidylation assay Citation[23]. Transfected and untransfected HT29 cells were seeded in 6-cm dishes with DMEM containing 10% FCS and incubated approximately four days before the assay. A day before the assay the HT29 cells were placed in serum-free DMEM containing 1,2,3-[3H]glycerol (1 µCi/ml; specific activity 40 Ci/mmol; American Radiolabeled Chemicals, St Louis, MO, USA) to label the phospholipids. Cells were then exposed to a serum-free medium containing 1 µM PMA or fMLF (both dissolved in ethanol) and 2% ethanol. After 30 min of drug treatment, cells were extracted in 2.5 ml of ice-cold methanol/water (3:2, v/v). Subsequently, 1.5 ml chloroform and 0.35 ml H2O were added and the lipid phase was separated by thin layer chromatography using the lower phase of methanol/chloroform/water (10:10:9, v/v/v). Individual phospholipids were stained with iodine, identified by standards, and spots corresponding to phosphatidylethanol (PtdEtOH), PA, and PC were isolated and subjected to liquid scintillation counting. PLD activity was expressed as percent [3H]-PtdEtOH of the total cellular PC concentration.
RNA isolation, RT-PCR and real time RT-PCR
Total RNA was isolated using the Trizol reagent (Gibco BRL, Life Technologies, USA) according to the manufacturer's recommended protocol. RNA samples were reverse-transcribed with moloney murine leukemia virus (MMLV) reverse transcriptase (Superscript RT; Gibco BRL) and oligo-(dT)15 primers (Promega, USA). The cDNA products were used immediately for RT-PCR and TaqMan real time RT-PCR for PLD1 and 2. The PCR cycles included 35 cycles of general denaturation at 94°C (30 sec), annealing (30 sec), and elongation at 72°C (45 sec). The first cycle included a 5-min denaturation period and a 7-min elongation in the final cycle. Primer sequences, PCR conditions, and expected molecular masses of PCR products are summarized in . The PCR products were electrophorized on a 2% agarose gel and visualized with ethidium bromide incorporation under UV light. Gene expression was monitored using an ABI Prism 7000 (Applied Biosystems, USA) according to the standard procedure. The primer for TaqMan real time RT-PCR of PLD1 and 2 was manufactured by Applied Biosystems. Relative quantification of the signals was performed by normalizing the signals of different genes with 18s for TaqMan real time PCR.
Table I. Oligonucleotide primer sequences used for RT-PCR.
Western blotting
For Western blot analysis of PLD1 and 2, GAPDH and phosphorylation of MAP kinase, HT29 cells was seeded in DMEM containing 10% FCS. Cells were harvested in a lysis buffer (50 mM Tris pH 7.5, 100 mM NaCl, 5 mM EDTA, 1% Triton, 2 mM sodium orthovanadate, 2.5 mM sodium pyrophosphate, 1 mM glycerol 2-phosphate, 1 mM phenylmethylsulfonylfluoride). Protein aliquots (40 µg for PLD1 and 2; 3 µg for GAPDH and 5 µg for pERK and ERK2) were resolved with a SDS sample buffer and Western blotting procedure incubated with polyclonal primary antibodies against PLD1 and 2 (from Biosource, USA), GAPDH, pERK1/2 and ERK2 (all from Santa Cruz, USA). The samples were incubated overnight at 4°C and subsequent detection with peroxidase-labeled secondary antibodies was performed. Antibody binding was identified via enhanced chemiluminescence (Amersham Pharmacia Biotech, Essex, UK).
Determination of receptor activity by measurement of cyclic AMP accumulation
Transfected and untransfected HT29 cells were seeded in 22-mm 12-well dishes with DMEM containing 10% FCS and incubated for four days before the assay. The medium was then replaced by 0.5 ml of serum-free DMEM medium containing 10 µM forskolin and fMLF. The cells were incubated at 37°C for 15 min. The reaction was terminated by removing the culture medium and subsequently adding 1 ml of ice-cold HCl/ethanol (1 volume of 1 N HCl, 100 volumes of ethanol). After centrifugation, the supernatant was evaporated, the residue was dissolved in TE buffer (50 mM Tris-EDTA, pH 7.5), and the cAMP content was determined using a commercially available radioimmunoassay kit (Amersham Pharmacia Biotech).
Fluorescence microscopy
Transfected and untransfected HT29 cells were grown on glass coverslips and incubated for four days before the assay. Subsequent to the fixation with 4% paraformaldehyde and 0.2% picric acid in phosphate buffer, pH 6.9 (Zamboni; Citation[24]) for 30 min, cells were permeabilized with ice-cold methanol for 10 min, incubated with polyclonal rabbit anti-PLD1, PLD2 and FPR, FPRL1 (Biozol, Germany; all 1:500) and FPRL2 (Santa Cruz, USA; 1:200) antibodies for 1 h at room temperature. Subsequently, the cells were incubated with goat anti-rabbit or donkey anti-goat AlexaFluor 488 (Molecular Probes, USA). There was no cross reactivity between FPRL1 and FPR by the anti-FPRL1 antibody in the immunofluorescence stainings or by Western blot analysis (data not shown). Nuclear staining was performed with bisbenzimide (Sigma, Germany). Cells were photographed using a Zeiss Axiovert microscope (Zeiss, Göttingen, Germany).
Quantitative internalization assay
Transfected and untransfected HT29 cells were seeded in 24-well dishes with DMEM containing 10% FCS and incubated for four days before the assay. For the quantitative analyses of FPRL1 internalization, after treatment the cells were fixed by Zamboni, but not permeablized and the surface localized FPR, FPRL1 or FPRL2 detected by rabbit anti-FPR, FPRL1 (both 1:500) or goat ant-FPRL1 (1:200) antibody for 2 h at room temperature, subsequently incubated with peroxidase-conjugated anti-rabbit or anti-goat antibody (1:200; Sigma, Germany). Plates were developed with 200 µl of ABTS solution (Sigma, Germany). After 45 min, 100 µl of the substrate solution from each well was transferred into a 96-well plate and analyzed at 405 nm using a SLT microplate reader. The results represent the loss of labelled surface receptors (in percentage) in relation to the optical density (OD) of the DMSO control.
Statistical analysis
All experiments were performed at least three times and the results listed are from representative experiments. The significance of the difference between test and control groups was analyzed using ANOVA followed by the Bonferroni test. Data from real time RT-PCR, densitometric quantification of Western blots, PLD assays, quantitative internalization and cAMP assays were analyzed by GraphPad Prism 3.0 software.
Results
Expression of PLD isoforms and formyl peptide receptors in human colonic cell line HT29
Using the RT-PCR method, we investigated – as a prerequisite for subsequent experiments – the mRNA expression of PLD isoforms and formyl peptide receptors in human colonic cell line HT29. Results of these experiments showed an expression of PLD1, PLD2, FPR, FPRL1 and FPRL2 in HT29 cells (). Amplification using specific primers yielded bands of expected size (β-actin, 150 bp; PLD1, 108 bp; PLD2, 531 bp; FPR, 299 bp; FPRL1, 133 bp; FPRL2, 96 bp; ).
Figure 1. Expression of PLD isoforms and formyl peptide receptors in human colonic cell line HT29. (A) RT-PCR products were visualized with agarose gel electrophoresis in the presence of ethidiumbromide. β-actin (housekeeping gene) was used as an internal control. The results are representative assays from three separate experiments with similar results. See for additional information. (B) Cells were fixed and labelled with anti-PLD1 or PLD2 antibodies. Nuclear counterstaining (blue) was additionally used. The figures show representative results from one of three independent experiments performed in duplicate. Scale bar: 20 µm. Published in colour in the online version.
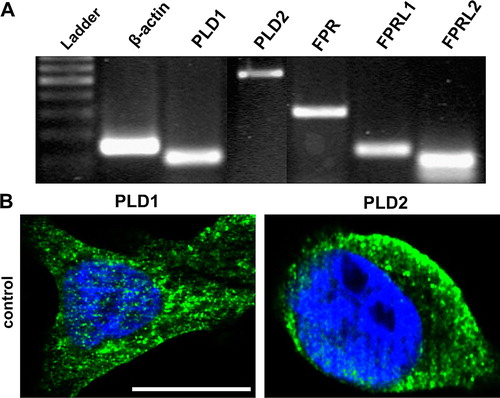
We then examined the subcellular distribution of PLD1 and 2 in HT29 cells using fluorescence microscopy. As seen in B the results primarily confirmed the presence of PLD1 in the intracellular compartment, whereas PLD2 was largely associated with the plasma membrane.
Inhibition of PLD1 and 2 expressions in HT29 cells by siRNA
To determine whether endogenous PLD1 and 2 is essential for formyl peptide receptor activity, we prepared siRNA targeting human PLD1 and 2. Transfection of HT29 cells with PLD1 and 2 siRNA, but not including the control siRNA, results in a significant reduction in PLD1 and 2 mRNA levels 96 h after transfection as determined by TaqMan real time RT-PCR (A and B). 18 s is used as a control. A decrease of PLD1 and 2 in HT29 cells (C) was also noted on the protein level of PLD expression after 96 h of siRNA post-transfection. Protein expression of PLD1 and 2 was detected by Western blot and evaluated by densitometric quantification. PLD1 was reduced 89±3.5% using siRNA oligonucleotides, whereas PLD2 was knocked down at 82±3% (D and E). We conclude that siRNA targeting to down-regulate PLD1 and 2 is an appropriate model to investigate underlying mechanisms of PLD function for formyl peptide receptor activity.
Figure 2. Inhibition of PLD1 and 2 expressions in HT29 cells by siRNA. SiRNA for PLD1 and 2 as well as control siRNA was transfected in HT29 cells. 96 h later the down-regulation of PLD1 (A) and PLD2 (B) mRNA expression was analyzed using TaqMan real time RT-PCR compared to the untreated sample. 18 s (housekeeping gene) was used as an internal control. The data were assessed from three independent experiments performed in triplicate. (C) PLD1 and 2 protein expression was evaluated with immunblotting. Two additional experiments produced similar results. The mean±SD of the three independent experiments was evaluated by densitometric quantification, (D) PLD1 and (E) PLD2. An asterisks indicates a significant difference (*, p<0.05; **, p<0.001) compared to a control siRNA using ANOVA followed by the Bonferroni test.
Decreased PLD activity in HT29 cells after siRNA transfection
PLD catalyzes the hydrolysis of phospholipids, resulting in the generation of phosphatidic acid (PA) and the release of the polar head group Citation[10]. The enzyme can also catalyze a transphosphatidylation reaction in which the aliphatic chain of primary alcohol is transferred to the phosphatidyl moiety of phosphatidic acid product. As shown in , treatment with PMA and fMLF led to a significant increase in the PLD activity in the control cell and the cell transfected with control siRNA after 30 min of stimulation (3-fold activity increase for PMA, 2- to 3-fold activity increase for fMLF). We then determined whether the observed PMA or fMLF-induced PLD activation in HT29 cells could be inhibited by PLD1 or PLD2 siRNA. The down-regulation of PLD1 as well as PLD2 resulted in a marked decrease in PLD activity for PMA and fMLF treatment. A complete blockage of PMA and fMLF-induced PLD activity was achieved by simultaneous treatment with PLD1 and 2 siRNA. These results suggest that in HT29 cells, PLD1 and 2 are contributors of PLD activity after stimulation with PMA and fMLF.
Figure 3. Decreased PLD activity in HT29 cells after siRNA transfection. After 96 h of post-transfection, HT29 cells were incubated in a serum-free medium containing 2% ethanol and exposed to either 1 µM PMA or fMLF for 30 min at 37°C. PLD activity was determined as described in Material and methods. Note that PMA and fMLF increased PLD activity. The PMA- and fMLF mediated stimulation of PLD activity was blocked by PLD1 and 2 siRNA. Values represent mean±SD from four independent experiments. An asterisk indicates a significant difference (*, p<0.05) compared to a control using ANOVA followed by the Bonferroni test.
Inhibition of formyl peptide receptor activity by PLD1 or PLD2 siRNA transfection in HT29 cells
To investigate the effect of PLD1 and 2 down-regulation on FPRL1 activity we incubated HT29 cells with siRNA. We then defined receptor activity as the inhibition of forskolin-induced cAMP accumulation and ERK1/2 phosphorylation after 96 h of post-transfection by Western blotting and radioimmunoassay, respectively. The inhibitory capacity of formyl peptide receptors on cAMP formation via Gi receptor activity was investigated. Forskolin served as an adenylyl cyclase activator in this assay. The treatment resulted in a marked increase of intracellular cAMP for HT29 cells (up to 151±16.5 pmol) as compared to untreated cells (A). The FPR and FPRL1 agonist fMLF led to a significant reduction of forskolin-stimulated cAMP levels in HT29 cells (down to 79.5±13 pmol) transient transfected with control siRNA and untransfected control cells. A shows that the fMLF-mediated increase of formyl peptide receptor activity was strongly inhibited by the tranfection with PLD1 and 2 siRNA. The reduction of forskolin-stimulated adenylate cyclase activity between transfected and untransfected HT29 cells was not significant. As positive control, the increased level of cAMP by PMA was not changed by PLD1 and 2 siRNA. Furthermore, we tested 5′-(N-Ethylcarboxamido)adenosine (NECA) as an agonist for other GPCR adenosine A2a receptors and seen that PLD1/2 knock down has no effect on cAMP level. We subsequently analyzed the increase of cAMP level after treatment with NECA and PMA for 15 min without forskolin stimulation. The results shown that the increase of cAMP level by NECA and PMA (up to 3-fold) was not changed by control, PLD1 and 2 siRNA (B). In comparison to inhibition of PLD1 or 2 by siRNA, we used the direct inhibitor of PLD activity 2,3-DPG Citation[25]. The fMLF- or NECA-induced change of forskolin-stimulated cAMP levels in HT29 cells was not changed by the PLD inhibitor 2,3-DPG (A). As shown in C and D, treatment with fMLF resulted in an intense phosphorylation of ERK1/2 in HT29 cells transient transfected with control siRNA and untransfected control cells. The transfection with PLD1 and 2 siRNA inhibited the phosphorylation. As positive control, the ERK1/2 phoshorylation by PMA or NECA was not changed by PLD1 and 2 siRNA. The results of the Western blots were then evaluated and confirmed by densitometric quantification. The phosphorylation of ERK1/2 by fMLF increased approximately 4-fold in HT29 cells and was significantly inhibited by PLD 1 and 2 siRNA (C). Interestingly, the inhibition of PLD activity by 2,3-DPG show also a strong decrease of ERK1/2 phosphorylation by fMLF, whereas NECA-induced phosphorylation was not significantly changed (B).
Figure 4. Inhibition of formyl peptide receptor activity by PLD1 or PLD2 siRNA transfection in HT29 cells. For analysis of inhibition of forskolin-stimulated adenylate cyclase activity, after 96 h of post-transfection (A), HT29 cells were subjected to 10 µM forskolin and 1 µM fMLF, NECA and PMA or NECA and PMA without forskolin stimulation (B) for 15 min at 37°C. cAMP levels were determined as described above (see Material and methods). Values represent mean±SD from four independent experiments. An asterisks indicates a significant difference (*, p<0.05; **, p<0.001) between forskolin and forskolin with agonists or control and agonists (B) as determined using ANOVA followed by the Bonferroni test. For analysis of ERK1/2 phosphorylation, HT29 cells were transfected with siRNA for PLD1, 2 or control siRNA or untransfected (C). Each was treated with 1 µM fMLF, NECA or PMA or alone for 5 min at 37°C. The cells were lysed, equal amounts of protein (5 µg) were resolved by the SDS sample buffer, and the levels of total ERK2 and phosphorylated ERK1/2 were determined using immunoblotting. The positions of phospho-ERK1/2 (pERK1/2) and total ERK2 (ERK2) are indicated on the right. The positions of molecular mass markers are indicated on the left (in kDa). The mean±SD of the three independent experiments from (B) was evaluated using densitometric quantification (D). An asterisk indicates a significant difference (*, p<0.05) compared to controls using ANOVA followed by the Bonferroni test.
Figure 5. Inhibition of formyl peptide receptor activity by 2,3-DPG in HT29 cells. For analysis of inhibition of forskolin-stimulated adenylate cyclase activity (A), HT29 cells were subjected to 10 µM forskolin and 1 µM fMLF or NECA with or without 5 mM 2,3-DPG or alone for 15 min at 37°C. cAMP levels were determined as described above (see Materials and methods). Values represent mean±SD from four independent experiments. An asterisks indicates a significant difference (*, p<0.05) between forskolin or forskolin with plus 2,3-agonists as determined using ANOVA followed by the Bonferroni test. For analysis of ERK1/2 phosphorylation (B), HT29 cells were treated with 1 µM fMLF or NECA with or without 5 mM 2,3-DPG or alone for 5 min at 37°C. The cells were lysed, equal amounts of protein (5 µg) were resolved by the SDS sample buffer, and the levels of total ERK2 and phosphorylated ERK1/2 were determined using immunoblotting. The positions of phospho-ERK1/2 (pERK1/2) and total ERK2 (ERK2) are indicated on the middle. The positions of molecular mass markers are indicated on the left and right (in kDa). The mean±SD of the three independent experiments from (B) was evaluated using densitometric quantification (C). An asterisk indicates a significant difference (*, p<0.05) compared to controls using ANOVA followed by the Bonferroni test.
No change of receptor expression level after siRNA transfection in HT29 cells
Using the RT-PCR method, we compared the mRNA expression of formyl peptide receptors in HT29 cells with untransfected and siRNA transfected cells. We were intended to except differences between expression levels as cause for activity reduction in PLD1 and 2 transfected cells. Results of these experiments showed no changes of FPR, FPRL1 and FPRL2 expression levels in HT29 cells after PLD1 and 2 siRNA transfection compared to the untransfected control and the control siRNA transfection (; for specific primers see ).
Figure 6. No change of receptor expression level after siRNA transfection in HT29 cells. After 96 h of post-transfection, RT-PCR products for formyl peptide receptors were visualized with agarose gel electrophoresis in the presence of ethidiumbromide. β-actin (housekeeping gene) was used as an internal control. The results are representative assays from three separate experiments with similar results. See for additional information.
Altered distribution of formyl peptide receptors after PLD1 and 2 siRNA transfection
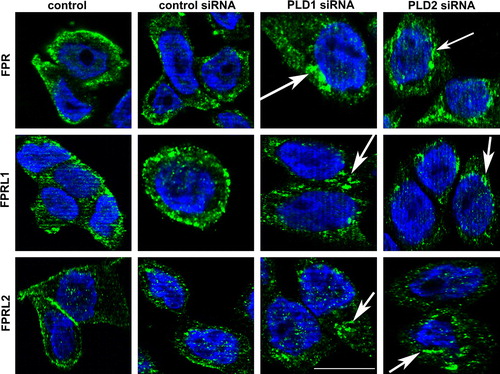
In the next set of experiments, we were intended to analyze the cellular localization of formyl peptide receptors in order to differences between untransfected and siRNA transfected HT29 cells. As shown in , we examined the internalization of FPR, FPRL1 and FPRL2 in HT29 cells using double fluorescence microscopy after transfection with PLD1 and 2 siRNA. HT29 cells were incubated for 96 h post-transfection and the receptor distribution was then analyzed using the appropriate antibodies. In untransfected or with control siRNA transfected HT29 cells, FPR and FPRL1 were found to be localized predominantly on the plasma membrane. For FPRL2, the receptor appeared on the plasma membrane as well as in the intracellular compartment. Treatment with siRNA for the PLD1 and 2 in HT29 cells resulted in an increase of immunofluorescent particles in the intracellular compartment for FPR, FPRL1 and FPRL2 (white arrows). After 96 h of post-transfection incubation at 37°C, FPRL1 exhibited a strong internal localization after transient PLD1 siRNA transfection. The accumulation of internal receptors was additionally increased for FPR and FPRL2. Cells showed a moderate to strong increase in intracellular receptor density on fluorescence microscopy for PLD2 siRNA compared to the controls.
Figure 7. Altered distribution of formyl peptide receptors after PLD1 and 2 siRNA transfection. After 96 h of post-transfection, HT29 cells were fixed and labelled with anti-FPR, FPRL1 and FPRL2 antibodies. Internalization of formyl peptide receptors was examined by fluorescence microscopy. Nuclear counterstaining (blue) was additionally used. The Figures show representative results from one of three independent experiments performed in duplicate. Scale bar: 20 µm. Published in colour in the online version.
Inhibition of PLD1 and 2 by siRNA transfection increased the internal locations of formyl peptide receptors
To verify that PLD 1 and 2 siRNA altered receptor distribution, HT29 cells were transfected with a control, PLD1 and 2 siRNA. The density of FPR, FPRL1 and FPRL2 in the plasma membrane was quantified using ELISA 96 h post-transfection as described in Material and methods. The measured optical density (OD) for the ABTS solution of the untransfected control cells without methanol permeabilization was defined at 100% receptor density of the plasma membrane. A–C showed a decrease of the receptor density. For PLD1 siRNA, the receptor density of FPR, FPRL1 and FPRL2 were significantly decreased based on the receptor density in HT29 cells compared to the control (FPR, 25.5±1.7%; FPRL1, 32.5±8.1%; FPRL2, 17.3±1.7%). The maximum decrease of receptor density for the PLD2 siRNA was detected for FPRL1 (FPR, 22.7±5%; FPRL1, 25.3±2.3%; FPRL2, 19.3±3.4%). The control siRNA had no significant effect on the receptor density of the plasma membrane in HT29 cells (A–C). The stimulation of the HT29 cells with the FPR and FPRL1 agonist fMLF for 60 min resulted in a significant increase of FPR and FPRL1 internalization in untransfected cells and cells transfected with control siRNA. The internalization of FPRL2 was not affected (C). The treatment of cells transfected with PLD1 and 2 siRNA did not result in a further increase of FPR, FPRL1 and FPRL2 internalization.
Figure 8. Inhibition of PLD1 and 2 by siRNA transfection induced increased internal locations of formyl-peptide-receptors. After 96 h of post-transfection, HT29 cells were each subjected to 1 µM fMLF for 60 min at 37°C as indicated. Cells were fixed using Zamboni and the surface receptors were labeled with rabbit anti-FPR, FPRL1 and FPRL2 antibodies followed by peroxidase-conjugated antibodies (without methanol permeabilization). Formyl peptide receptor endocytosis, quantified as the percentage loss of labelling surface receptors in relation to the optical density (OD) of the control (defined as 100%), was measured using ELISA as described in Material and methods. Values represent mean±SD from four independent experiments. An asterisks indicates a significant difference (*, p<0.05; **, p<0.001) compared to control siRNA without fMLF using ANOVA followed by the Bonferroni test. Published in colour in the online version.
Discussion
PLD is a widely distributed enzyme found in bacteria, fungi, plants and animals. Its principle substrate is phosphatidylcholine and its product, phosphatidic acid, is believed to have many multiple functions in signal transduction, vesicle formation and cytoskeletal dynamics Citation[9], Citation[10]. Two mammalian PLD genes (PLD1 and PLD2) occur as splice variants Citation[26], Citation[27]. PLD1 appears to be localized near the Golgi apparatus or perinuclear vesicular structures, whereas PLD2 seems more closely associated with the plasma membrane Citation[28]. Our results with the human enterocyte cell line HT29 confirmed the presence of PLD1 in the intracellular compartment, whereas PLD2 was largely associated with the plasma membrane (B). The present study demonstrates the functional importance of PLD1 and 2 for three subtypes of the human formyl peptide receptor family: FPR, FPRL1 and FPRL2, and its additional role in endocytosis including receptor recycling and reactivation for receptor activity. The G protein coupled receptors (GPCR) of the chemoattractant formyl peptide receptor family are involved in host defence against pathogens and in regulating leukocyte migration in inflammation Citation[4]. Our results show that the FPR and FPRL1 were primarily localized on the plasma membrane, whereas FPRL2 was found on the plasma membrane and in the intracellular compartment (). The inhibition of PLD1 and 2 by siRNA resulted in a distinct reduction of FPR-activity in HT29 cells (A and B). This appears to be attributed to the inhibition of recycling and accumulation in the intracellular compartment ( and ). In the same way, the inhibition of PLD activity by 2,3-DPG do not inhibited the formyl peptide receptor induced decreased cAMP level, but the fMLF-mediated ERK1/2 phosphorylation was strong reduced (). Our conclusion is that the reduced inhibition of adenylate cyclase by fMLF after inhibition of PLD1 or 2 resulted from the decreased localization of formyl peptide receptors in the plasma membrane. The inhibition of PLD by the antagonist 2,3-DPG confirmed this conclusion, then the 2,3-DPG do not inhibited the fMLF induced inhibition of forskolin-stimulated adenylate cyclase activity. To test whether the observed of PLD inhibition is specific for formyl peptide receptors, we examined the activity of the GPCR adenosine A2a receptors after PLD depletion. The PLD1/2 knock down has no effect on cAMP level and ERK1/2 phosphorylation after stimulation with A2a receptor agonist NECA (). Furthermore, in comparison to fMLF, 2,3-DPG do not changed NECA-induced ERK2 phosphorylation (B). Interestingly, Thibault et al. Citation[29] could show that adenosine receptor occupancy suppresses chemoattractant-(fMLF)-induced phospholipase D activity by diminishing membrane recruitment of small GTPases. In this context, an effect of PLD1/2 knock down for NECA-induced adenosine receptor activity was not expected.
The results confirmed our previous investigations which provided evidence for an fMLF-induced PLD dependent ERK1/2 phosphorylation and involvement of PI-3-kinases Citation[30]. PA activates different protein kinases (including indirectly PI-3-kinases; Citation[31], and acts as an intermediary messenger with various selective proinflammatory targets and thus facilitates the initiation of host inflammatory response Citation[32], Citation[33]. Previous studies on the role of PLD enzymes exhibited their involvement in signalling pathways that recruit specialized endocytotic machinery and affect on constitutive endocytosis Citation[20], Citation[34]. Several studies examined the consequences of PLD inhibition for different receptors. Expression of inactive mutants of both PLD1 and PLD2 inhibited EGF receptor (EGFR) down-regulation in fibroblasts Citation[17]. Our results do not show an influence of PLD 1 or 2 inhibition of FPR, FPRL1 or FPRL2 expression in HT29 cells (). Overexpression of truncated PLD2 or its depletion by siRNA inhibited the agonist-induced endocytosis of µ-opioid and angiotensin receptors as well as phagocytosis in macrophages Citation[19], Citation[35], Citation[36]. This was not the case with PLD1. SiRNA of PLD2 additionally inhibited the constitutive internalization of glutamate receptors, which were transiently expressed in human embryonic kidney 293 cells Citation[20]. Padrón et al. Citation[37] found that depletion of PLD2, but not PLD1, inhibits the endocytotic recycling of the transferrin receptors. In contrast to the results from Bhattacharya et al. Citation[20], PLD2 depletion inhibited the recycling step of transferrin receptors, but not the internalization Citation[37].
Our results for the formyl peptide receptors, however, show that a depletion of PLD1 and 2 inhibits constitutive receptor recycling. The receptors accumulate in the internal compartment and the receptor density of the plasma membrane decreased ( and ). Our results clearly demonstrate that recycling (exocytosis) of the receptor is PLD1 and 2-dependent for the endocytotic machinery of the FPR, FPRL1 and FPRL2. But it should be noted that the result can be due also from the failure to target the receptors to the membrane Citation[38]. Ernst et al. Citation[39] demonstrated that FPRL1 recycling is also sensitive to PI3-kinase inhibitors, whereas FPRL1 internalization was not affected by the inhibitors. In this context, PLD involvement is a key step in a variety of signalling processes, such as phosphoinositide (PI-3- and PIP-5-kinases) and protein kinase activation (Akt, ERK1/2; for recent review see Citation[40]). Our previous and current results provide evidence for an FPRL1-mediated PLD-dependent activation of PI-3-kinases Citation[30] and subsequent ERK1/2 phosphorylation (B).
Our data indicate that PLD1 and 2 are involved in formyl peptide receptor recycling. PLD1 appears to regulate the translocation of vesicles to the cell periphery and plasma membrane-associated PLD2 participates in the fusion of vesicles with the plasma membrane. Our results emphasize the importance of PLD1 and 2 in the function of formyl peptide receptors and the maintenance of the mucosal cell barrier and immune function by formyl peptide receptors.
Acknowledgements
We would like to thank Rosemarie Sprang, Patrycja Kozak, Susanne Echterhagen, Michaela Nicolau, and Regine Worm for their excellent technical assistance. This study was supported by the “Forschungsförderung” of the medical faculty (University of Kiel, Germany, to L.O.B.) and Hensel Foundation (University of Kiel, Germany, to L.O.B.) and Deutsche Forschungsgemeinschaft (DFG PU214/5-2; PU214/4-2; PU214/3-2). Declaration of interest: The authors report no conflicts of interest. The authors alone are responsible for the content and writing of the paper.
Related Research Data
References
- Gronert K, Gewirtz A, Madara JL, Serhan CN. Identification of a human enterocyte lipoxin A4 receptor that is regulated by interleukin (IL)-13 and interferon gamma and inhibits tumor necrosis factor alpha-induced IL-8 release. J Exp Med 1998; 187: 1285–1294
- Babior BM. Oxygen-dependent microbial killing by phagocytes (first of two parts). N Engl J Med 1978; 298: 659–668
- Anton P, O'Connell J, O'Connell D, Whitaker L, O'Sullivan GC, Collins JK, Shanahan F. Mucosal subepithelial binding sites for the bacterial chemotactic peptide, formyl-methionyl-leucyl-phenylalanine (FMLP). Gut 1998; 42: 374–379
- Migeotte I, Communi D, Parmentier M. Formyl peptide receptors: A promiscuous subfamily of G protein-coupled receptors controlling immune responses. Cytokine Growth Factor Rev 2006; 17: 501–519
- Harada M, Habata Y, Hosoya M, Nishi K, Fujii R, Kobayashi M, Hinuma S. N-Formylated humanin activates both formyl peptide receptor-like 1 and 2. Biochem Biophys Res Commun 2004; 324: 255–261
- Becker EL, Forouhar FA, Grunnet ML, Boulay F, Tardif M, Bormann BJ, Sodja D, Ye RD, Woska JR, Jr, Murphy PM. Broad immunocytochemical localization of the formyl peptide receptor in human organs, tissues, and cells. Cell Tissue Res 1998; 292: 129–135
- Cockcroft S. G-protein-regulated phospholipases C, D and A2-mediated signalling in neutrophils. Biochim Biophys Acta 1992; 1113: 135–160
- Bokoch GM. Chemoattractant signaling and leukocyte activation. Blood 1995; 86: 1649–1660
- Liscovitch M, Cantley LC. Signal transduction and membrane traffic: The PITP/phosphoinositide connection. Cell 1995; 81: 659–662
- Liscovitch M, Czarny M, Fiucci G, Lavie Y, Tang X. Localization and possible functions of phospholipase D isozymes. Biochem Biophys Acta 1999; 1439: 245–263
- Hammond SM, Altshuller YM, Sung TC, Rudge SA, Rose K, Engebrecht J, Morris AJ, Frohman MA. Human ADP-ribosylation factor-activated phosphatidylcholine-specific phospholipase D defines a new and highly conserved gene family. J Biol Chem 1995; 270: 29640–29643
- Frohman MA, Sung TC, Morris AJ. Mammalian phospholipase D structure and regulation. Biochim Biophys Acta 1999; 1439: 175–186
- Colley WC, Sung TC, Roll R, Jenco J, Hammond SM, Altshuller Y, Bar-Sagi D, Morris AJ, Frohman MA. Phospholipase D2, a distinct phospholipase D isoform with novel regulatory properties that provokes cytoskeletal reorganization. Curr Biol 1997; 7: 191–201
- Lucocq J, Manifava M, Bi K, Roth MG, Ktistakis NT. Immunolocalisation of phospholipase D1 on tubular vesicular membranes of endocytic and secretory origin. Eur J Cell Biol 2001; 80: 508–520
- O'Luanaigh N, Pardo R, Fensome A, Allen-Baume V, Jones D, Holt MR, Cockcroft S. Continual production of phosphatidic acid by phospholipase D is essential for antigen-stimulated membrane ruffling in cultured mast cells. Mol Biol Cell 2002; 13: 3730–3746
- Denmat-Ouisse LA, Phebidias C, Honkavaara P, Robin P, Geny B, Min DS, Bourgoin S, Frohman MA, Raymond MN. Regulation of constitutive protein transit by phospholipase D in HT29-cl19A cells. J Biol Chem 2001; 276: 48840–48846
- Shen Y, Xu L, Foster DA. Role for phospholipase D in receptor-mediated endocytosis. Mol Cell Biol 2001; 21: 595–602
- Koch T, Brandenburg LO, Schulz S, Liang Y, Klein J, Höllt V. ADP-ribosylation factor-dependent phospholipase D2 activation is required for agonist-induced mu-opioid receptor endocytosis. J Biol Chem 2003; 278: 9979–9985
- Du G, Huang P, Liang BT, Frohman MA. Phospholipase D2 localizes to the plasma membrane and regulates angiotensin II receptor endocytosis. Molec Biol Cell 2004; 15: 1024–1030
- Bhattacharya M, Babwah AV, Godin C, Anborgh PH, Dale LB, Poulter MO, Ferguson SS. Ral and phospholipase D2-dependent pathway for constitutive metabotropic glutamate receptor endocytosis. J Neurosci 2004; 24: 8752–8761
- Choi WS, Kim YM, Combs C, Frohman MA, Beaven MA. Phospholipases D1 and D2 regulate different phases of exocytosis in mast cells. J Immunol 2002; 168: 5682–5689
- Hughes WE, Elgundi Z, Huang P, Frohman MA, Biden TJ. Phospholipase D1 regulates secretagogue-stimulated insulin release in pancreatic beta-cells. J Biol Chem 2004; 279: 27534–27541
- Kotter K, Klein J. Ethanol inhibits astroglial cell proliferation by disruption of phospholipase D-mediated signaling. J Neurochem 1999; 73: 2517–2523
- Zamboni L, De Martino C. Buffered picric acid-formaldehyde: A new, rapid fixative for electron microscopy. J Cell Biol 1967; 35: 148a
- Kanaho Y, Nakai Y, Katoh M, Nozawa Y. The phosphatase inhibitor 2,3-diphosphoglycerate interferes with phospholipase D activation in rabbit peritoneal neutrophils. J Biol Chem 1993; 268: 12492–12497
- Liscovitch M, Czarny M, Fiucci G, Tang X. Phospholipase D: Molecular and cell biology of a novel gene family. Biochem J 2000; 345: 401–415
- Exton JH. Regulation of phospholipase D. FEBS Lett 2002; 531: 58–61
- McDermott M, Wakelam MJ, Morris AJ. Phospholipase D. Biochem Cell Biol 2004; 82: 225–253
- Thibault N, Harbour D, Borgeat P, Naccache PH, Bourgoin SG. Adenosine receptor occupancy suppresses chemoattractant-induced phospholipase D activity by diminishing membrane recruitment of small GTPases. Blood 2000; 95: 519–527
- Brandenburg LO, Konrad M, Wruck CJ, Koch T, Pufe T, Lucius R. Involvement of the formyl-peptide-receptor-like-1 (FPRL1) and phospholipase D (PLD) in the internalization and signal transduction of Amyloid beta 1-42 (A(42) in glial cells. Neuroscience 2008; 156: 266–276
- Lindmo K, Stenmark H. Regulation of membrane traffic by phosphoinositide 3-kinases. J Cell Sci 2006; 119: 605–614
- Kusner DJ, Hall CF, Jackson S. Fc gamma receptor-mediated activation of phospholipase D regulates macrophage phagocytosis of IgG-opsonized particles. J Immunol 1999; 162: 2266–2274
- Lim HK, Choi YA, Park W, Lee T, Ryu SH, Kim SY, Kim JR, Kim JH, Baek SH. Phosphatidic acid regulates systemic inflammatory responses by modulating the Akt-mammalian target of rapamycin-p70 S6 kinase 1 pathway. J Biol Chem 2003; 278: 45117–45127
- Koch T, Wu DF, Yang L, Brandenburg LO, Höllt V. Role of phospholipase D2 in the agonist-induced and constitutive endocytosis of G-protein coupled receptors. J Neurochem 2006; 97: 365–372
- Koch T, Brandenburg LO, Liang Y, Schulz S, Beyer A, Schröder H, Höllt V. Phospholipase D2 modulates agonist-induced mu-opioid receptor desensitization and resensitization. J Neurochem 2004; 88: 680–688
- Iyer SS, Barton JA, Bourgoin S, Kusner DJ. Phospholipases D1 and D2 coordinately regulate macrophage phagocytosis. J Immunol 2004; 173: 2615–2623
- Padrón D, Tall RD, Roth MG. Phospholipase D2 is required for efficient endocytic recycling of transferring receptors. Mol Biol Cell 2006; 17: 598–606
- Marchese A, Paing MM, Temple BR, Trejo J. G protein-coupled receptor sorting to endosomes and lysosomes. Annu Rev Pharmacol Toxicol 2008; 48: 601–629
- Ernst S, Zobiack N, Boecker K, Gerke V, Rescher U. Agonist-induced trafficking of the low-affinity formyl peptide receptor FPRL1. Cell Mol Life Sci 2004; 61: 1684–1692
- Oude Weernink PA, Han L, Jakobs KH, Schmidt M. Dynamic phospholipid signaling by G protein-coupled receptors. Biochem Biophys Acta 2007; 1768: 888–900