
Abstract
Nanomedicine is becoming very popular over conventional methods due to the ability to tune physico-chemical properties of nano vectors, which are used for encapsulation of therapeutic and diagnostic agents. However, the success of nanomedicine primarily relies on how specifically and efficiently nanocarriers can target pathological sites to minimize undesirable side effects and enhance therapeutic efficacy. Here, we introduce a novel class of targeted nano drug delivery system, which can be used as an effective nano-theranostic for cancer. We formulated pH-sensitive niosomes (80–90 nm in diameter) using nonionic surfactants Span20 (43–45 mol%), cholesterol (50 mol%) and 5 mol% of pH (Low) insertion peptide (pHLIP) conjugated with DSPE lipids (DSPE-pHLIP) or hydrophobic fluorescent dye, pyrene, (Pyr-pHLIP). In coating of niosomes, pHLIP was used as an acidity sensitive targeting moiety. We have demonstrated that pHLIP coated niosomes sense the extracellular acidity of cancerous cells. Intravenous injection of fluorescently labeled (R18) pHLIP-coated niosomes into mice bearing tumors showed significant accumulation in tumors with minimal targeting of kidney, liver and muscles. Tumor-targeting niosomes coated with pHLIP exhibited 2–3 times higher tumor uptake compared to the non-targeted niosomes coated with PEG polymer. Long circulation time and uniform bio-distribution throughout the entire tumor make pHLIP-coated niosomes to be an attractive novel delivery system.
Introduction
Most of the currently approved nano-medicinal products for cancer imaging and therapy are non-targeted nano vectors that accumulate in the tumor tissues purely through the enhanced permeability and retention (EPR) effect (Dawidczyk et al., Citation2014). It is nearly impossible to find a universal targeting moiety for cancers as they are heterogeneous (Stingl & Caldas, Citation2007; Weigelt et al., Citation2005). At the same time, extracellular acidity has been identified as a general property of cancerous cells and especially the most aggressive ones (Calorini et al., Citation2012; Stubbs et al., Citation2000). Family of pH (Low) insertion peptides (pHLIP® peptides) are under development as novel agents, which target tumor acidity (Andreev et al., Citation2009: Weerakkody et al., Citation2013). The peptides sense pH at the surface of cancer cells, where it is the lowest (Anderson et al., Citation2016), and enters into cellular membranes (Andreev et al., Citation2010; Reshetnyak et al., Citation2006, Citation2007, Citation2008). Nanocarriers decorated with pHLIPs are biocompatible, can target tumor and demonstrate enhanced cellular uptake by cancer cells (Arachchige et al., 2015; Du et al., Citation2014; Wijesinghe et al., Citation2013; Yao et al., Citation2013a,Citation2013b). In addition to pHLIP-coated nanoparticles, nanocarriers containing pH-sensitive polymers and lipids were known for decades (Chu et al., Citation1990; Karanth & Murthy, Citation2007; Lee et al., Citation1998; Subbarao et al., Citation1987).
In this study we introduced pHLIP-coated niosomes. Niosomes are self-assembled bilayer vesicles analogous to liposomes, comprised of surfactants of Span®, Tween® or Brij® series (Rajera et al., Citation2011). Similar to liposomes, niosomes are used to encapsulate both hydrophilic and lipophilic drugs. At the same time, nonionic surfactant vesicles, niosomes, are cheaper in production, have longer shelf lives compared to liposome and the bilayer fluidity and microviscosity could be easily modulated (Karim et al., Citation2010; Lohumi, Citation2012; Marianecci et al., Citation2014; Moghassemi & Hadjizadeh, Citation2014). Sorbitan esters (Spans®) are FDA approved for use in food processing and pharmaceuticals (Cottrell & van Peij, Citation2004). They are safe, amphiphilic compounds derived from sorbitol (i.e., a synthetic sweetener). Span20 mostly consists of a fully saturated short alkyl chain (lauryl – C12). The single carbon bonds in Span20 allow the alkyl chain to pack tightly, resulting in the smallest and stable niosomes, opposing the niosomes consisting of longer chain surfactants, Spans40-80 (Hao et al., Citation2002; Israelachvili et al., Citation1980; Lo et al., Citation2010). Vesicles prepared by Span-series surfactants have been reported to be viable drug carriers for different diseases and different routes of administration (Ammar et al., Citation2011; Balakrishnan et al., Citation2009; Ghanbarzadeh et al., Citation2015; Guinedi et al., Citation2005; Hunter et al., Citation1988; Jadon et al., Citation2009; Liu et al., Citation2017; Pardakhty et al., Citation2007; Sahoo et al., Citation2014). In this study we introduced novel formulations, pHLIP-coated niosomes, comprised of Span20 surfactant and cholesterol.
Materials and methods
Materials
Sorbitan monolaurate (Span20); cholesterol ≥99%; N-(2-Hydroxyethyl)piperazine-N′-(2-ethanesulfonic acid) (HEPES) ≥ 99.5% and N-(1-Pyrenyl)maleimide (Pyr-maleimide) were purchased from Sigma-Aldrich. 1,2-dioleoyl-sn-glycero-3-phosphoethanolamine-N-[4-(p-maleimidophenyl)butyramide] sodium salt (DSPE-maleimide) and 1,2-distearoyl-sn-glycero-3-phosphoethanolamine-N-[carboxy(polyethylene glycol)-2000] ammonium salt (DSPE-PEG(2000)) were obtained from Avanti Polar Lipids. Octadecyl Rhodamine B chloride (R18) was purchased from Thermo Fisher Scientific. The wild type (WT) pH (Low) Insertion Peptide: ACEQNPIYWARYADWLFTTPLLLLDLALLVDADEGT was prepared by solid-phase peptide synthesis and purified at the C.S. Bio. All other chemicals used in the study were of the highest purity and all the solvents were of spectroscopic grade. Water was purified through a Millipore Milli-Q system.
Synthesis of DSPE-pHLIP and Pyr-pHLIP
pHLIP was conjugated with Pyr-maleimide or DSPE-maleimide in methanol. 5 mg of peptide dissolved in 250 μL methanol (blown with argon) and Pyr-maleimide or DSPE-maleimide (from 9.9 mM stock solution) dissolved in chloroform was mixed at a molar ratio 1:1. The reaction mixture was kept at room temperature for about 2–6 hours until the conjugation was completed. The Pyr-pHLIP product formation was monitored by the reversed phase (Zorbax SB-C18 columns, 4.6 × 250 mm 5 μm, Agilent Technology) high-performance liquid chromatography (RP-HPLC) using a gradient from 25–75% acetonitrile in water containing 0.05% trifluoroacetic acid (TFA). The Pyr-pHLIP product was characterized by SELDI-TOF mass spectrometry (Pyr-pHLIP expected MW 4409.0 found 4401.7, Figure S1). The concentration of Pyr-pHLIP conjugate was determined by absorbance using the molar extinction coefficient for Pyr: ɛ 3 3 9 = 40,000 – M−1 cm−1. The reaction progress in conjugation of DSPE with pHLIP was monitored by the RP-HPLC using a gradient from 25–80% acetonitrile in water containing 0.05% TFA by monitoring a decrease of peak corresponding to the unlabeled pHLIP in the reaction mixture. The concentration of DSPE-pHLIP conjugate was determined by absorbance using the molar extinction coefficient for pHLIP:ɛ2 8 0 = 13,940 M−1 cm−1.
Niosomes preparation
10 mM stock solutions of Span20 and cholesterol were prepared by dissolving the products in chloroform and methanol mixture of 3:1 (v/v). pHLIP-coated niosomes were prepared by mixing solutions of the 43 mol% of Span20, 50 mol% of cholesterol, 5 mol% of DSPE-pHLIP or Pyr-pHLIP and 2 mol% of R18. PEG-coated niosomes were prepared by mixing solutions of the 43 mol% of Span20, 50 mol% of cholesterol, 5 mol% of DSPE-PEG and 2 mol% of R18. Some preparations of niosomes used for fluorescence spectroscopy measurements, hemolysis and plasma stability studies contained no R18 and comprised of 45 mol% of Span20, 50 mol% of cholesterol, 5 mol% of Pyr-pHLIP, or DSPE-pHLIP, or DSPE-PEG. Solutions containing all components were evaporated in the flask covered with aluminum foil for 1 h on rotary evaporator at 60 °C producing an even thin film, followed by additional 1 h evaporation under the high vacuum to remove traces of organic solvents. The layers were hydrated in 2 mL of p 10 mM PBS or HEPES buffer solutions, pH 7.4 containing 137 mM NaCl, 2.7 mM KCl and 1 mM CaCl2 in a preheated oven at 60 °C. To disrupt large particles and obtain monodisperse solution of nanoparticles we employed both sonication and extrusion. The sonication and extrusion protocols were optimized varying power and duration of sonication, as well as adjusting extrusion approach. According to the optimized protocol niosome solution was sonicated using the probe sonicator VirTis (VirSonic 100) for approximately 5 minutes at 60 °C at output power of 8–10 Watts, followed by consequential extrusion (31 times) using 200 , 100 and 50 nm filters. Niosome solution was sterilized by filtering through a 0.2 μm filter. The concentration was calculated by measuring absorbance of R18 at 546 nm (ɛ 5 4 6 = 104,126 – M−1 cm−1) or pHLIP at 280 nm (ɛ2 8 0 = 13,940 M−1 cm−1) of the niosomes dissolved in methanol and then the niosomes were stored at 4 °C.
Size and zeta potential measurements
The size distribution of niosomes was measured by dynamic light scattering (DLS) using a Zetasizer Nano ZS (Malvern) instrument and a nanoparticle tracking system, Nanosight (NS300, Malvern). The zeta (ζ) potential was measured on a Zetasizer Nano ZS instrument using folded capillary cells from Malvern.
Fluorescence measurements
Steady-state fluorescence measurements were carried out under a temperature control at 25 °C on a PC1 spectrofluorometer (ISS, Inc.). The concentration of the pyrene was 12.5 μM. Pyrene fluorescence was excited at 333 nm and recorded in the range of 350–500 nm. The polarizers in the excitation and emission paths were set at the “magic” angle (54.7° from the vertical orientation) and vertically (0°), respectively.
Cryo-electron microscopy
Niosome solution (5 μL droplet) was spread on a Lacey formar/carbon electron microscopy grid and preserved in a frozen-hydrated state by a rapid freezing in liquid ethane. The vitrification process was performed using FEI Vitrobot system with the setting of a single blot of 3 sec, an offset of 1 and drain and waiting time of 1 sec. Transmission electron microscopy (TEM) (JEOL 2100) with an accelerating voltage of 200 kV at magnifications in the range of 10,000 to 150,000× was used to image niasomes to establish the shape, size and homogeneity of the particles. Size histograms were fitted with a Gauss function.
Cell lines
Lung carcinoma A549 and mouse mammary 4T1 cell lines were obtained from American Type Culture Collection (ATCC). Cells were authenticated, stored according to the supplier’s instructions and used within 3–4 months after frozen aliquots resuscitations. Cells were cultured in Dulbecco’s Modified Eagle’s Medium (DMEM) and Roswell Park Memorial Institute Medium (RPMI) supplemented with 10% fetal bovine serum (FBS), 0.1% of 10 μg/mL of ciprofloxacin (Cipro) in a humidified atmosphere of 5% CO2 and 95% air at 37 °C.
Cell proliferation assay
A549 and 4T1 cells were seeded in 96 well-plates (∼3,000 cells per well) at pH 7.4. The following day, cells were treated for 2 hours with increasing concentrations of pHLIP-coated niosomes (0, 10, 50, 100, 250, 500 and 1000 μM of Span20) in serum free DMEM media at pH 7.4, followed by addition of an equal volume of medium with 20% (v/v) FBS. In another experiment, after 2 hours of cells treatment with pHLIP-coated niosomes, the solution was replaced by media containing 10% FBS. Cells were grown for 3 days until non-treated cells in control reached 80–90% confluence. Cell viability was assessed by the colorimetric reagent (CellTiter 96 AqueousOne Solution Assay, Promega) of the MTS (3-(4,5-dimethylthiazol-2-yl)-5-(3-carboxymethoxyphenyl)-2-(4-sulfophenyl)-2H-tetrazolium) assay, which was added for 1 hour to cells followed by measuring absorbance at 490 nm. All samples were prepared in triplicate. Each experiment was repeated several times.
Hemolysis assay
Single donor human whole blood was purchased from Innovative Research. Red blood cells (RBCs) were collected by centrifugation of whole blood at 2000 rpm for 10 minutes followed by washing three times with Dulbecco’s PBS (DPBS) and re-suspended in DPBS at a concentration of 7.5% (v:v). Varying concentrations of niosomes (from 50 up to 400 μM) in 10 mM HEPES buffer, pH 7.4 containing 137 mM NaCl, 2.7 mM KCl, 1 mM CaCl2 were added to RBCs to form 5% RBC suspension. The resultant mixtures were incubated at 37 °C for 2 hours and then centrifuged at 2000 rpm for 10 min. The hemolysis was assessed by the release of hemoglobin, which was monitored by measuring of absorbance at 450 nm. 10 mM HEPES buffer, pH 7.4 containing 137 mM NaCl, 2.7 mM KCl, 1 mM CaCl2 and DPBS were used as negative controls. As positive controls, which result in 100% lysis of RBCs: water and 10% of Triton X-100 was used. The percentage of hemolysis was calculated as follows:
where, ODTest, ODNC, and ODPC are the optical density reading (absorbance) values of the test sample, negative control and positive control, respectively. The assay was performed in triplicate on niosomes with and without R18.
Stability in plasma
Plasma was separated from the single donor human whole blood by centrifugation of whole blood at 2000 rpm for 10 minutes and collecting of supernatant. Varying concentrations of niosomes (from 50 to 400 μM) in 10 mM HEPES buffer, pH 7.4 containing 137 mM NaCl, 2.7 mM KCl, 1 mM CaCl2 were added to plasma and incubated at 37 °C. The stability of niosomes was assessed by monitoring size of niosomes measured using a nanoparticle tracking system, Nanosight (NS300, Malvern) before mixing with plasma and at 0, 2 and 24 hours after the treatment with plasma.
Cellular uptake of niosomes
A549 and 4T1 cells (∼500,000 cells) in suspension were treated with 500 μM R18 labeled pHLIP-coated niosomes at pH 7.8 and pH 5.5 for about 1 hour at 37 °C in serum free DMEM media. We used DMEM containing no sodium bicarbonate and adjusted the pH by using HCl or NaOH. After incubation period, cells were pelleted by centrifugation (2500 rpm, 2.5 min) at room temperature. The supernatant was removed and the cell pellet was re-suspended in 1 mL of fresh PBS of pH 7.4 and centrifuged for the second time. The second cell pellet was re-suspended in PBS of pH 7.4 with or without addition of Trypan Blue solution (Sigma-Aldrich). The 20 μL of the cell suspension solution was loaded into a counting chamber. The cellular uptake of fluorescent niosomes was assessed by counting of fluorescent cells using Nexcelom cellometer at 525 nm excitation and 595 nm emission channels.
Fluorescence microscopy
In a separate experiment, A549 and 4T1 cells (∼500,000 cells) in suspension were treated with 500 μM R18 labeled pHLIP-coated niosomes at pH 6.4 (or normal pH 7.4) for 1 hour at 37 °C serum free media and followed by the described above steps of cell washing. After washing, the cell pellet was re-suspended and cells were seeded in glass bottom collagen coated cell dishes (MatTek). The phase contrast and fluorescence images of the cells were recorded at 0, 4 and 24 hours under an inverted epi-fluorescence microscope (Olympus IX71) using 20× and 40× objective lenses.
Tumor mouse model
All animal studies were conducted according to the animal protocol AN07-01-015 approved by the Institutional Animal Care and Use Committee at the University of Rhode Island, in compliance with the principles and procedures outlined by NIH for the Care and Use of Animals. 4T1 mammary tumors were established by subcutaneous injection of 4T1 cells (1 × 10⁶ cells/mL, 0.1 mL/flank) in the right flank of adult female BALB/c mice (about 20–25 g weight) obtained from Envigo RMS, Inc. For this study, 34 mice were used including controls.
Ex vivo fluorescence imaging
When tumors reached 6–8 mm in diameter different constructs of niosomes containing 2 mol% of fluorescent R18 were given as a single tail vein injection (100 μL of 50 μM of R18). Animals were euthanized at 4, 24 and 48 hours post-injection. Necropsy was performed immediately after euthanization. The Supplementary Tables S1 and S2 contain information about the number of animals used for each fluorescently-labeled niosomes for each time point. Tumors, kidneys, liver and muscles were collected for imaging on a FX Kodak invivo image station connected to the Andor CCD. The imaging was performed using excitation and emission filters with a band of transmittance at 540 ± 20 and 605 ± 20 nm, respectively. The mean fluorescence intensities of tumor and organs were calculated using ImageJ software.
Imaging of tumor sections
Frozen tumor tissues were sectioned at a thickness of 5 μm using a Vibratome UltraPro 5000 Cryostat. Sections were mounted on microscope slides, dried in air and washed with deionized water. Tumor sections mounted on microscopic slides were directly incubated with 1 mM DAPI solution in PBS at 37 °C for about 10 minutes and washed with PBS solution to remove excess of the dye. Frozen tumor sections with R18 contained pHLIPcoated niosomes were analyzed without further processing using Zeiss LSM 700 confocal module under DAPI and Rhodamine channels using a 20× objective lens. Following fluorescence imaging, the adjacent sections were then stained with hematoxylin and eosin (H&E) and imaged under microscope.
Results
We introduced two formulations of pHLIP-coated niosomes. In both cases the major components of niosome content was Span20 (varied in the range of 43–45 mol%) and cholesterol (50 mol%) and in some niosome formulations we also used fluorescent R18 (0–2 mol%). pHLIP was conjugated either with DSPE lipids (DSPE-pHLIP) or hydrophobic fluorescent dye, pyrene, (Pyr-pHLIP) and introduced into niosomes at amount of 5 mol%. These formulations represent two different approaches for introducing pHLIP into niosome coating: (i) pHLIP conjugated with the lipid headgroup as it was done previously (Wijesinghe et al., Citation2013) and (ii) pHLIP conjugated to various hydrophobic molecules, such as pyrene, which have high affinity to membrane and can intercalate into bilayer. There is an advantage of using pyrene over DSPE lipids, since (i) progression of conjugation reaction of pHLIP with pyrene is easy to monitor by HPLC and mass-spectrometry; (ii) incorporation of Pyr-pHLIP into niosomes could be assessed by measuring changes of pyrene fluorescence (see below) and (iii) pyrene could be used for intercalation into bilayers of various thicknesses.
The cryo-TEM imaging confirmed unilamellar structure of pHLIP-coated niosomes (). The multiple cryo-TEM images were analyzed to plot size-distribution histograms, which were fitted by Gauss functions (Figure S2). The mean and standard deviations of Gaussian distributions for DSPE-pHLIP and Pyr-pHLIP coated niosomes were established to be 65.2 ± 15.3 and 52.2 ± 10.1 nm, respectively (). The hydrodynamic diameter of DSPE-pHLIP and Pyr-pHLIP coated niosomes in solution were 89.7 ± 7.1 and 72.6 ± 3.3 nm, respectively. The zeta potential of DSPE-pHLIP and Pyr-pHLIP coated niosomes was −35.4 m and −31.3 mV, respectively. When Pyr-pHLIP was incorporated into niosomes the fluorescence spectra of pyrene was altered compared to the pyrene emission in methanol (the niosome formulation used for fluorescence measurements did not contain fluorescent R18) (). The appearance of the characteristic excimer fluorescence at 440–500 nm was observed, which indicates the stacking of pyrene rings within the bilayer of niosomes.
Figure 1. Cryogenic TEM image of the (a) DSPE-pHLIP (5 mol%) , (b) Pyr-pHLIP (5 mol%) coated Span20 (45 mol%) and cholesterol (50 mol%) niosomes. The images are obtained at 25,000× magnification and (c) The fluorescence spectra of Pyr-pHLIP measured in methanol and Pyr-pHLIP incorporated in niosomes.
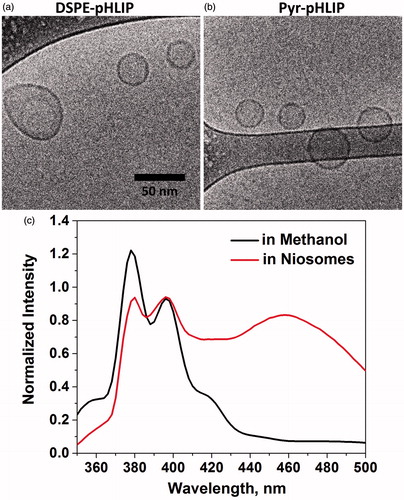
Table 1. The center of Gauss distribution (DTEM) and the standard deviation obtained after fitting of histograms of niosome’s diameter distributions (shown on Figure S2) calculated by analyzing cryo-TEM images. The mean hydrodynamic diameter (Dh), the zeta potential (ξ) and the polydispersity index (PDI) were obtained from the dynamic light scattering measurements performed on niosomes in HEPES buffer at pH 7.4. DSPE-pHLIP and Pyr-pHLIP (5 mol%) coated Span20 (45 mol%) and cholesterol (50 mol%) niosomes were used.
We investigated shelf lifetime of pHLIP coated niosomes. The formulations were kept in buffer solution of pH 7.4 refrigerated at 4 °C for a month. The size of particles remained unchanged in solution during 30 days, while the values of zeta potential decreased on about 40% (from negative 30–35 mV to negative 47–53 mV) (Figure S3). The changes of zeta potential, which were not associated with changes of particle size, might be attributed to the oxidation of the components of Span20 mixture forming negatively charged species and enhancing an overall negative charge of niosomes (de Sousa Lobato et al., Citation2013; Kerwin, Citation2008; Kishore et al., Citation2011; Smith, Citation1981).
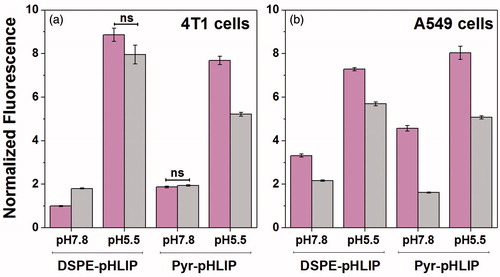
The cytotoxicity of the pHLIP-coated niosomes was tested on murine 4T1 mammary cancer cells and human lung A549 carcinoma cells. The data indicate that DSPE-pHLIP and Pyr-pHLIP niosomes do not show toxicity on cells. The pH-dependent cellular uptake of the fluorescent pHLIP-coated niosomes containing 2 mol% of R18 was assessed by quantifying rhodamine fluorescence taken by the cells. Cells were treated with R18 containing niosomes at pH 7.8 and pH 5.5 for 1 hour. We choose to treat cells with constructs at pH 7.8, which is slightly above than normal physiological pH 7.4, since it was shown that pH at the surface of cancer cells, especially highly metastatic cancer cells such as 4T1, is lower even when pH of media is normal (Anderson et al., Citation2016). We also chose to treat cells with constructs at pH 5.5, which is slightly lower than mean pH 6.0 established at the surface of cancer cells within tumors (Anderson et al., Citation2016) with the main goal to enhance difference in cellular uptake of niosomes in this model experiment. The fluorescent signal from the cells treated with niosomes was analyzed using cellometer (). We also used cell impermeable dye, Trypan Blue, to quench fluorescent signal outside of cells or at the outer leaflet of lipid bilayer of plasma membrane to prove that fluorescent signal is associated with cellular uptake of niosomes. It is known that Trypan Blue is used to quench fluorescence in the range of 580–620 nm (Nuutila & Lilius, Citation2005). The uptake of the fluorescent niosomes coated with both DSPE-pHLIP and Pyr-pHLIP by 4T1 and A549 cancer cells was from 2–9 times higher at low pH compared to the uptake at treatment pH of 7.8 (established with high statistical significance, p-levels determined by the two-tailed unpaired Student’s t-test were less than 0.0001). Addition of Trypan Blue to cells led to the quenching of rhodamine fluorescence. More detailed information about cellular fluorescence after the treatment with niosomes is presented in Figure S4.
Figure 2. Normalized uptake of DSPE-pHLIP (5 mol%) and Pyr-pHLIP (5 mol%) coated Span20 (43 mol%) and cholesterol (50 mol%) niosomes containing 2 mol% of fluorescent R18 by 4T1 mammary (a) and A549 lung (b) cancer cells at pH 7.8 and pH 5.5 before (magenta columns) and after (gray columns) treatment with Trypan blue. The fluorescent signals were normalized by the rhodamine fluorescence intensity of 4T1 cells at pH 7.8 treated with DSPE-pHLIP before addition of Trypan blue. Statistically significant differences were determined by two-tailed unpaired Student’s t-test, only statistically non-significant differences are indicated (ns means p level >0.05), all other differences in cellular uptake calculated at different pH’s, as well as before and after Trypan Blue addition are statistically significant (plevel is less than 0.0001 in each case). The distribution of fluorescent signal in cells is presented in Figure S4.
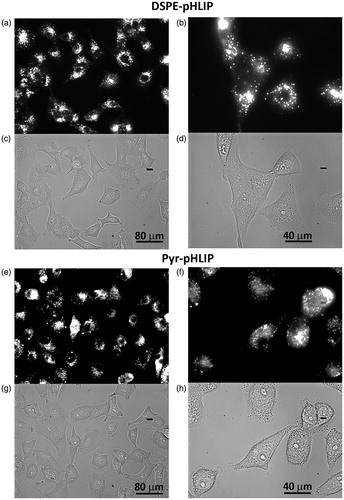
Next, we investigated distribution of the fluorescent niosomes within A549 and 4T1 cancer cells. Cells were treated with R18 fluorescent niosomes at low pH (pH 6.4) for 1 hour, followed by washing, seeding cells in glass bottom collagen coated cell dishes and imaging. The fluorescent signal of DSPE-pHLIP and Pyr-pHLIP coated niosomes in A549 cells () and 4T1 cells (Figure S5) were distributed through cells, most probably in endosomes and lysosomes. The data confirmed pH-dependent cellular uptake of pHLIP-coated niosomes.
Figure 3. Uptake and cellular distribution of (a–d) DSPE-pHLIP (5 mol%) and (e–h) Pyr-pHLIP (5 mol%) coated Span20 (43 mol%) and cholesterol (50 mol%) niosomes containing 2 mol% of fluorescent R18 by A549 lung cancer cells. Cells were treated with fluorescence niosomes at pH 6.4 for 1 hour, followed by washing, seeding cells in glass bottom collagen coated cell dishes and imaging at next day. Fluorescence (a, b, e, f) and phase contrast (c, d, g, h) images were obtained using 20× (a, c, e, g) and 40× (b, d, f, h) magnification objective lenses.
Finally, our goal was to investigate tumor targeting and distribution of pHLIP-coated niosomes, which we compared with the control niosomes coated with PEG polymer that accumulate in tumors due to the EPR effect. Before proceeding to animal studies we investigated the stability of pHLIP and PEG coated niosome formulations in plasma and calculated percentage of hemolysis. RBCs and plasma were separated from human blood samples. RBCs were treated with two sets of increasing concentrations of pHLIP and PEG coated niosomes with and without R18 for 2 hours at 37 °C. The lysis of RBCs was less than 1% in the case of use of DSPE-pHLIP and Pyr-pHLIP coated niosomes and less than 2% for DSPE-PEG coated niosomes. Also, stability of pHLIP and PEG coated niosomes with and without R18 were investigated for 24 hours in plasma separated from the blood. The size of all niosome formulations (DSPE-pHLIP, Pyr-pHLIP and DSPE-PEG) was not altered indicating on their stability in blood.
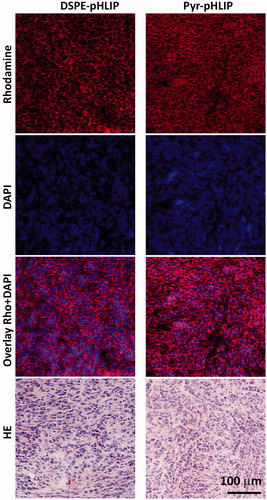
The tumor targeting of the fluorescent R18 containing DSPE-pHLIP and Pyr-pHLIP coated niosomes were investigated in mice. Fluorescent niosomes were given as a single tail vein injection, animals were euthanized at different time points post-injection (4, 24 and 48 hours). Main organs were collected, cut in half and imaged ( and Table S1). At 24 hours we observed peak in tumor uptake of the fluorescent niosomes. The mean tumor to muscle ratio within 48 hours was found to be 4.9 ± 1.3 and 6.8 ± 1.4 nm for DSPE-pHLIP and Pyr-pHLIP coated niosomes, respectively. The signal in kidney was minimal, with some accumulation of the constructs in liver. Uptake of pHLIP-coated niosomes by tumor, muscle, kidney and liver at 24 hours post-injection was compared with the uptake of PEG-coated niosomes. shows representative images of tumor and organs obtained from mice injected with different constructs and (and Table S2) reflects quantitative uptake of the constructs by the tumors and organs. Tumor-targeting niosomes coated with pHLIP exhibited 2.1–2.7 times higher tumor uptake compared to the non-targeted niosomes coated with PEG polymer. demonstrates cellular distribution of fluorescent signal within the tumor mass. The sections were obtained from the center of the tumors. The fluorescence is associated with cellular structures and no nuclear staining was observed as in the case of experiments on cultured cells.
Figure 4. Time-dependent distribution of DSPE-pHLIP and Pyr-pHLIP (5 mol%), Span20 (43 mol%), cholesterol (50 mol%) and R18 (2 mol%) niosomes in a) tumor, b) muscle, c) kidney and d) liver at 4, 24 and 48 hours after single I.V. administration of the constructs. Tumor/Muscle (T/M), Tumor/Kidney (T/K) and Tumor/Liver (T/L) ratio calculated for DSPE-pHLIP (e) and Pyr-pHLIP (f) niasomes are shown. The values of mean surface fluorescence intensity of R18 in tissue and organs are presented in Table S1.
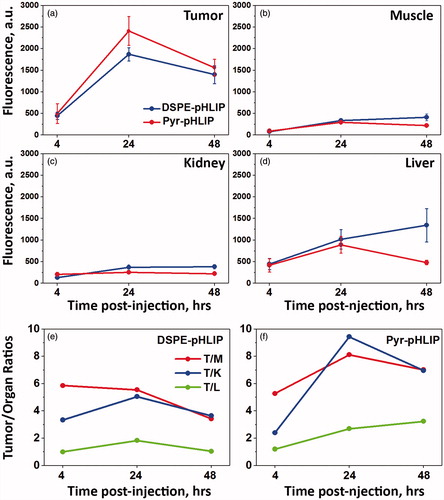
Figure 5. (a) The representative rhodamine fluorescence images and (b) mean surface fluorescence of tumor (cut in half ), muscle, kidney (cut in half) and liver obtained by ex vivo imaging after collection of organs and tissues 24 hours after I.V. administration of pHLIP and PEG coated niosomes are shown (the autofluorescence signal is subtracted). The color coded fluorescent images shown on panel (a) are obtained at the same settings of the imaging instrument, the same exposure time (15 sec) and all of them were processed exactly the same way. Control is the organs collected from the mouse with no injection of fluorescent niosomes and it represents level of auto fluorescence signals in tissue. The values of mean surface fluorescence intensity of R18 in tissue and organs are presented in Table S2.
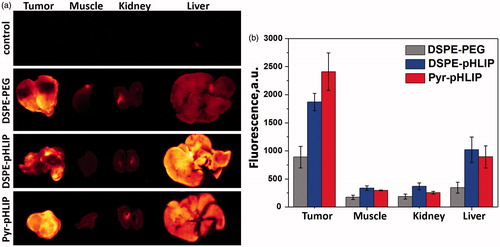
Figure 6. Distribution of R18 fluorescent signal in tumor sections obtained at 24 hours after I.V. injection of (a–d) DSPE-pHLIP (5 mol%) and e–h) Pyr-pHLIP (5 mol%) coated Span20 (43 mol%), cholesterol (50 mol%) and R18 (2 mol%) niosomes. The rhodamine fluorescence (a, e), cell nucleus stained with DAPI (b, f), the overlay of rhodamine and DAPI fluorescence (c, g), and adjacent HE stained sections from the same tumor (d, h) are shown.
Discussion
The targeted delivery of nanomaterials is one of the most important aspects of successful development of nanotechnology and translation of nanomaterials to the clinics. Various approaches are tested with moderate success. Our approach is based on targeting of tumor acidity by utilizing ability of pHLIPs to sense pH at the surface of cells. Acidosis is a general property of tumor micro environment associated with tumor development and progressions (Fang et al., Citation2008; Gillies et al., Citation2008; Vander Heiden et al., Citation2009). Moreover, acidity is linked to other pathological states, such as ischemia, atherosclerosis, stroke (Koo et al., Citation1993; Mizock & Falk, Citation1992; Rajamäki et al., 2013). It was shown that nanoparticles coated with pHLIP promote targeting and cellular uptake of these nanoparticles (Emmetiere et al., Citation2013; Han et al., Citation2013; Janic et al., Citation2016; Tian et al., Citation2017; Wei et al., Citation2017; Wijesinghe et al., Citation2013; Yao et al., Citation2013a, Citation2013b; Yu et al., Citation2015, Citation2016). Previously, we demonstrated that pHLIP-coated liposomes are capable to fuse with cellular membranes and promote delivery hydrophobic cargo molecules to cellular membranes and hydrophilic payloads to cytoplasm of cancer cells (Yao et al., Citation2013b). In this work we tested surfactant- and cholesterol-based niosomes. The pHLIP-coated niosomes were smaller in size and more stable compared to the pHLIP-coated liposomes. pHLIP-coated niosomes demonstrated pH-dependent cellular uptake and excellent tumor targeting. Control non-targeted PEG-coated niosomes exhibited 2–3 times less tumor accumulation. Targeting of acidic tumors occurs due to the ability of pHLIPs to insert into cellular membranes in environment of low extracellular pH. Thus, at low pH pHLIPs behave as fusogenic peptides, which bring the niosome membrane in close contact to the cellular membrane. These are the two main possibilities of pHLIP-coated niosome’s cellular entry. Either pHLIP-coated niosomes might fuse directly with the plasma membrane of cancer cells in environment of low pH and/or niosomes can be taken up into the cell via endocytotic pathways, more favorably, via micropinocytosis due simultaneous insertions of multiple pHLIPs into the cellular membrane. Niosomes, which are internalized into cell via endocytosis might fuse with the endosomal membrane at low pH. In either case, niosomes carrying lipophilic and/or hydrophilic drugs can effectively enter into the cells in a pH-dependent manner.
The pHLIP-coated liposomes and niosomes follow a closely similar mechanism utilized by viruses and pathogenic organisms to enter into a cell. In contrast to liposomes, niosomes are smaller in size, they demonstrate prolong shelf life, very good tumor targeting and distribution within tumor and their manufacturing cost is lower. On other hand, niosome’s encapsulation capacity is lower and different combinations of surfactants are needed for entrapment of various hydrophobic molecules within their bilayer to preserve overall stability of nano-vesicles. Different formulations might find utility for different therapeutic purposes.
IMBC_1342969_Supplementary_Material.pdf
Download PDF (204.8 KB)Acknowledgments
We would like to thank Dr. Al Bach and Kim Andrews, Rhode Island IDeA Network for Excellence in Biomedical Research (INBRE), for their assistance in using the cello meter; Dr. Richard Kingsley and Dr. Iftheker Khan, University of Rhode Island, for performing TEM imaging; Mr Paul W Johnson, RI Genomic and Sequencing Center for his assistance in confocal microscopy, Dr. Dammika Weerakkody, University of Rhode Island for his assistance on biophysical instrumentation and Mr. Troy Crawford, University of Rhode Island for his assistance in animal studies.
Disclosure statement
OA Andreev and YK Reshetnyak have founded and have a financial interest in a company, pHLIP, Inc., with the aim of bringing pHLIP technology to the clinic. The company has had no involvement in funding the studies reported here.
Additional information
Funding
Related Research Data
References
- Ammar H, Ghorab M, El-Nahhas S, Higazy I. 2011. Proniosomes as a carrier system for transdermal delivery of tenoxicam. Int J Pharm 405:142–152.
- Anderson M, Moshnikova A, Engelman DM, Reshetnyak YK, Andreev OA. 2016. Probe for the measurement of cell surface pH in vivo and ex vivo. Proc Natl Acad Sci USA 113:8177–8181.
- Andreev OA, Engelman DM, ReshetnyakYK. 2009. Targeting acidic diseased tissue: new technology based on use of the pH (Low) Insertion Peptide (pHLIP). Chim Oggi Chem Today 27:34.
- Andreev OA, Engelman DM, Reshetnyak YK . 2010. pH-sensitive membrane peptides (pHLIPs) as a novel class of delivery agents. Molec Membrane Biol 27:341–352.
- Arachige MC, Reshetnyak YK, Andreev OA. 2015. Advanced targeted nanomedicine. J Biotechnol 202:88–97.
- Balakrishnan P, Shanmugam S, Lee WS, Lee WM, Kim JO, Oh DH, et al. 2009. Formulation and in vitro assessment of minoxidil niosomes for enhanced skin delivery. Int J Pharm377:1–8.
- Calorini L, Peppicelli S, Bianchini F. 2012. Extracellular acidity as favouring factor of tumor progression and metastatic dissemination. Exp Oncol 34:79–84.
- Chu CJ, Dijkstra J,Lai MZ, Hong K, Szoka FC. 1990. Efficiency of cytoplasmic delivery by pH-sensitive liposomes to cells in culture. Pharm Res 7:824–834.
- Cottrell T, Van PEIJ J. 2004. 7 Sorbitan esters and polysorbates. Emulsifiers in Food Technology. Oxford, UK: Blackwell Publishing Ltd.
- Dawidczyk CM, Russell LM, Searson PC. 2014. Nanomedicines for cancer therapy: state-of-the-art and limitations to pre-clinical studies that hinder future developments. Front Chem 2:69.
- De Sousa Lobato KB, Paese K, Forgearini JC, GUuterres SS, Jablonski A, et al. 2013. Characterisation and stability evaluation of bixin nanocapsules. Food Chem 141:3906–3912.
- Du JZ, Mao CQ, Yuan YY, Yang XZ, Wang J. 2014. Tumor extracellular acidity-activated nanoparticles as drug delivery systems for enhanced cancer therapy. Biotechnol Adv 32:789–803.
- Emmetiere F, Irwin C, Viola-Villegas N, Longo V, Cheal S, Zanzonico P, et al. 2013. F-Labeled-Bioorthogonal Liposomes for. Vivo. Bioconjugate Chem 24:1784–1789.
- Fang JS, Gillies RD, Gatenby RA. 2008. Adaptation to hypoxia and acidosis in carcinogenesis and tumor progression. Seminars in Cancer Biology. Netherlands: Elsevier.
- Ghanbarzadeh S, Khorrami A, Arami S. 2015. Nonionic surfactant-based vesicular system for transdermal drug delivery. Drug Deliv 22:1071–1077.
- Gillies RJ, Robey I, Gatenby RA. 2008. Causes and consequences of increased glucose metabolism of cancers. J Nucl Med 49:24S–42S.
- Guinedi AS, Mortada ND, Mansour S, Hathout RM. 2005. Preparation and evaluation of reverse-phase evaporation and multilamellar niosomes as ophthalmic carriers of acetazolamide. Int J Pharm 306:71–82.
- Han L, Ma H, Guo Y, Kuang Y, He X, Jiang C. 2013. pH‐Controlled Delivery of Nanoparticles into Tumor Cells. Adv Healthc Mater 2:1435–1439.
- Hao Y, Zhao F, Li N, Yang Y, Li KA. 2002. Studies on a high encapsulation of colchicine by a niosome system. Int J Pharm 244:73–80.
- Hunter C, Dolan T, Coombs G, Baillie A. 1988. Vesicular systems (niosomes and liposomes) for delivery of sodium stibogluconate in experimental murine visceral leishmaniasis. J Pharma Pharmacol 40:161–165
- Israelachvili J, Marcelja S, Horn R. 1980. Physical principles of membrane organization. Q Rev of Biophys 13:121–200.
- Jadon PS, Gajbhiye V, Jadon RS, Gajbhiye KR, Ganesh N. 2009. Enhanced oral bioavailability of griseofulvin via niosomes. AAPS PharmSciTech 10:1186.
- Janic B, Bhuiyan MP, Ewing JR, Ali MM. 2016. pH-Dependent cellular internalization of paramagnetic nanoparticle. ACS Sens 1:975.
- Karanth H, Murthy R. 2007. pH-sensitive liposomes-principle and application in cancer therapy . J Pharm Pharmacol 59:469–483.
- Karim KM, Mandal AS, Biswas N, Guha A, Chatterjee S, Behera M, et al. 2010. Niosome: a future of targeted drug delivery systems. J Adv Pharm Technol Res 1:374.
- Kerwin BA. 2008. Polysorbates 20 and 80 used in the formulation of protein biotherapeutics: structure and degradation pathways. J Pharm Sci 97:2924–2935.
- Kishore RS, Pappenberger A, Dauphin IB, Ross A, Buergi B, Stampfli A, et al. 2011. Degradation of polysorbates 20 and 80: studies on thermal autoxidation and hydrolysis. J Pharm Sci 100:721–731.
- Koo B, Becker LE, Chuang S, Merante F, Robinson BH, et al. 1993. Mitochondrial encephalomyopathy, lactic acidosis, stroke‐like episodes (MELAS): clinical, radiological, pathological, and genetic observations. Ann Neurol 34:25–32. [f][https://doi.org/10.1002/ana.410340107]
- Lee RJ, Wang S, Turk MJ, Low PS. 1998. The effects of pH and intraliposomal buffer strength on the rate of liposome content release and intracellular drug delivery. Bioscience Rep 18:69–78.
- Liu H, Tu L, Zhou Y, Dang Z, Wang L, Du J, et al. 2017. Improved bioavailability and antitumor effect of docetaxel by TPGS modified proniosomes: in Vitro and in Vivo evaluations. Scic Rep 7:43372. doi: 10.1038/srep43372.
- Lo CT, Jahn A, Locascio LE, Vreeland WN. 2010. Controlled self-assembly of monodisperse niosomes by microfluidic hydrodynamic focusing. Langmuir 26:8559–8566.
- Lohumi A. 2012. A novel drug delivery system: niosomes review. J Drug Dev 2:129–135.
- Marianecci C, Di Marzio L, Rinaldi F, Celia C, Paolino D, Alhaique F, et al. 2014. Niosomes from 80s to present: the state of the art. Adv Colloid Interface Sci 205:187–206.
- Mizock BA, Falk JL. 1992. Lactic acidosis in critical illness. CritCare Med 20:80–93.
- Moghassemi S, Hadjizadeh A. 2014. Nano-niosomes as nanoscale drug delivery systems: an illustrated review. J Control Release 185:22–36.
- Nuutila J, Lilius EM. 2005. Flow cytometric quantitative determination of ingestion by phagocytes needs the distinguishing of overlapping populations of binding and ingesting cells. Cytometry A 65:93–102.
- Pardakhty A, Varshosaz J, Rouholamini A. 2007. In vitro study of polyoxyethylene alkyl ether niosomes for delivery of insulin. Int J Pharm 328:130–141.
- Rajamäki K, Nordströmö T, Nurmi K, Åkerman KE, Kovanen PT, Öörni K, et al. 2013. Extracellular acidosis is a novel danger signal alerting innate immunity via the NLRP3 inflammasome. J Biol Chem 288:13410–13419.
- Rajera R, Nagpal K, Singh SK, Mishra DN. 2011. Niosomes: a controlled and novel drug delivery system. Biol Pharm Bull 34:945–953.
- Reshetnyak YK, Andreev OA, Lehnert U, Engleman DM. 2006. Translocation of molecules into cells by pH-dependent insertion of a transmembrane helix. Proc Natl Aca Sci U.S.A 103:6460–6465.
- Reshetnyak YK, Andreev OA, Segala M, Markin VS, Englemann DM. 2008. Energetics of peptide (pHLIP) binding to and folding across a lipid bilayer membrane. Proc Natl Aca Sci U.S.A 105:15340–15345.
- Reshetnyak YK, Segala M, Andreev OA, Engelmann DM. 2007. A monomeric membrane peptide that lives in three worlds: in solution, attached to and inserted across lipid bilayers. Biophysl J 93:2363–2372.
- Sahoo RK, Biswas N, Guha A, Sahoo N, Kuotsu K. 2014. Nonionic surfactant vesicles in ocular delivery: innovative approaches and perspectives. BioMed Res Int 2014:263604. doi: 10.1155/2014/263604.
- Smith LL. 1981. Cholesterol autoxidation, Springer Science & Business Media New York, USA.
- Stingl J, Caldas C. 2007. Molecular heterogeneity of breast carcinomas and the cancer stem cell hypothesis. Nat Rev Cancer 7:791–799.
- Stubbs M, Mcsheeny PM, Griffiths JR, Bashford CL. 2000. Causes and consequences of tumour acidity and implications for treatment. Mol Med Today 6:15–19.
- Subbarao NK, Parente RA, Szoka FC, JR, Nadasdi L, PONGRACZ K. 1987. The pH-dependent bilayer destabilization by an amphipathic peptide. J Biochem 26:2964–2972.
- Tian Y, Zhang Y, Teng Z, Tian W, Luo S, Kong X, et al. 2017. pH-dependent transmembrane a of peptide-functionalized gold nanostars for computed tomography/photoacoustic imaging and photothermal therapy. ACS Appl Mater Interfaces 9:2114–2122.
- Vander Heiden MG, Cantley LC, Thompson CB. 2009. Understanding the Warburg effect: the metabolic requirements of cell proliferation. Science 324:1029–1033.
- Weerakkody D, Mooshnikova A, Thakur MS, Moshnikova V, Daniels J, Engelman DM, et al. 2013. Family of pH (low) insertion peptides for tumor targeting. Proc. Nat Acad Sci USA 110:5834–5839.
- Wei Y, Liao R, Mahmood AA, Xu H, Zhou Q. 2017. pH-Responsive pHLIP (pH Low Insertion Peptide) Nanoclusters of Superparamagnetic Iron Oxide Nanoparticles as a Tumor-selective MRI Contrast Agent. Acta Biomater 55:194–203.
- Weigelt B, Peterse JL, Vant Veer LJ. 2005. Breast cancer metastasis: markers and models. Nat Rev Cancer 5:591–602.
- Wijesinghe D, Arachchige MC, Lu A, Reshetnyak YK, Andreev OA. 2013. pH dependent transfer of nano-pores into membrane of cancer cells to induce apoptosis. Sci Rep 3:3560. doi: 10.1038/srep03560.
- Yao L, Daniels J, Moshnikova A, Kuznetsov S, Ahmed A, Engelman DM, et al. 2013a. pHLIP peptide targets nanogold particles to tumors. Proc. Nat Acad Sci U.S.A 110:465–470.
- Yao L, Daniels J, Wijesinghe D, Andreev OA, Reshetnyak YK. 2013b. pHLIP®-mediated delivery of PEGylated liposomes to cancer cells. J Control Release 167:228–237.
- Yu M, Guo F, Wang J, Tan F, Li N. 2015. Photosensitizer-loaded pH-responsive hollow gold nanospheres for single light-induced photothermal/photodynamic therapy. ACS Applied Materials & Interfaces7:17592–17597.
- Yu M, Guo F, Wang J, Tan F, Li N. 2016. A pH-Driven and photoresponsive nanocarrier: Remotely-controlled by near-infrared light for stepwise antitumor treatment. Biomaterials 79:25–35.