Abstract
Phospholamban (PLB) is a small transmembrane protein that regulates calcium transport across the sarcoplasmic reticulum (SR) of cardiac cells via a reversible inhibitory interaction with Ca2 + -ATPase. In this work solid-state NMR methods have been used to investigate the dynamics of the inhibitory association between PLB and Ca2 + -ATPase. Skeletal muscle Ca2 + -ATPase was incorporated into phosphatidylcholine membranes together with a ten-fold excess of a null-cysteine mutant of PLB labelled with 13C at Leu-44 in the transmembrane domain ([α-13C-L44]AAA-PLB). In these membranes the PLB variant was found to partially inhibit Ca2 + -ATPase by reducing the affinity of the enzyme for calcium. Cross-polarization magic angle spinning (CP-MAS) 13C NMR spectra of the membranes exhibited a signature peak from [α-13C-L44]AAA-PLB at 56 ppm. Changes in the intensity of the peak were observed at different temperatures, which was diagnostic of direct interaction between [α-13C-L44]AAA-PLB and Ca2 + -ATPase. Measurements of dipolar couplings between the 13C label and neighbouring protons were analysed to show that the mean residency time for the association of AAA-PLB with Ca2 + -ATPase was on the order of 2.5 ms at temperatures between 0°C and 30°C. This new NMR approach will be useful for examining how the association of the two proteins is affected by physiological stimuli such as kinases and the elevation of calcium concentration.
Introduction
The contractility of heart muscle is intimately coupled to the flux of calcium ions into and out of the cytosol of cardiac myocytes Citation[1]. The sarco(endo)plasmic reticulum (SR) plays a central role in muscle contractility, functioning as a calcium store from which ions are rapidly released into the cytosol through calcium-activated ryanodine receptors to initiate contraction. Muscle relaxation depends upon the rapid clearance of calcium from the cytosol into the SR by the sarco(endo)plasmic reticulum Ca2 + -ATPase (SERCA), a 110 kDa integral membrane protein that couples ATP hydrolysis with vectorial Ca2 + transport across the SR membrane of muscle cells Citation[2]. Various isoforms of SERCA are found in different muscle types, with SERCA1 predominating in fast twitch muscle and SERCA2 in cardiac and smooth muscle Citation[3].
Calcium transport by SERCA2 is regulated by phospholamban (PLB), a 52 amino acid transmembrane protein that associates with SERCA2 at low Ca2 + concentrations and reversibly inhibits SERCA2 by lowering the apparent affinity of the enzyme for Ca2 + Citation[4], Citation[5]. The inhibitory effect is reversed when PLB is phosphorylated at Ser16/Thr17 by cAMP-dependent protein kinase A and calcium/calmodulin-dependent kinase, respectively, or at high calcium concentrations Citation[6], Citation[5]. PLB runs as a pentamer on sodium dodecyl sulphate polyacrylamide gel electrophoresis (SDS-PAGE) gels and it is believed that in SR membranes PLB exists as a mixture of oligomeric and monomeric forms in dynamic equilibrium Citation[7], Citation[8]. Several variants of PLB have been prepared with mutated residues within the transmembrane domain, including a triple mutant in which the three native cysteines are substituted with alanine (AAA-PLB). This triple mutant and related mutants run as monomers on SDS-PAGE gels Citation[9], indicating that oligomerization of PLB is driven by interactions between the transmembrane helices. Monomer-favouring mutants suppress Ca2 + affinity for Ca2 + -ATPase more strongly than does the wild-type protein Citation[10–12], which suggests that it is the monomeric form of PLB which interacts with SERCA2a and regulates calcium transport Citation[12].
There are conflicting opinions about how changes in calcium concentration or the phosphorylation of PLB lead to the reactivation of SERCA. Early evidence, particularly from cross-linking studies, suggests that the restoration of calcium transport is related to the dissociation of phosphorylated PLB from SERCA, either as a result of phosphorylation itself or following an increase in calcium concentration Citation[13–15]. More recent work favours the argument that dissociation from the enzyme is not necessary for relief of inhibition. Co-immunoprecipitation studies suggest that the interactions between SERCA and phosphorylated PLB appear to be maintained at low calcium concentration, with dissociation of the two proteins occurring only under conditions of elevated Ca2 + Citation[16]. This observation suggests that the reactivation of the calcium pump involves structural changes at the protein-protein interface Citation[16], Citation[17].
Mutational analysis has revealed interaction sites involving residues 17–32 in the cytoplasmic domain of PLB and the L67 loop region of SERCA Citation[6]. Phosphorylation of PLB may lead to disruption of contacts in this region while leaving other interactions intact. Evidence to support this suggestion comes from the finding that the PLB mutant N27A has a super inhibitory effect on SERCA that is not relieved by phosphorylation Citation[18]. This implies that the conformational changes resulting from the N27A mutation prevent phosphorylation from overcoming any inhibitory interactions. More recent experiments provide further support that PLB remains tightly associated with the enzyme and that inhibition is relieved as a result of structural rearrangements rather than dissociation Citation[19], Citation[20]. For example, fluorescence measurements between Tyr6 of PLB and an engineered Cys at residue 24 near the membrane surface indicated that upon calcium reactivation of SERCA the cytoplasmic domain of PLB undergoes an increase in its dimensions Citation[19]. This contrasts with the effect of phosphorylation, which results in a more compact structure consistent with increased helical content Citation[19]. In both cases however, the conformation of the cytoplasmic domain relative to the transmembrane domain remains highly ordered in comparison with the wide range of structures seen when the same fluorescence experiments were carried out on PLB in isolation Citation[21]. While these studies clearly demonstrate that PLB can remain associated with SERCA following both phosphorylation and increases in calcium concentration, it is still not clear how these factors affect the binding affinity of PLB for the enzyme.
Mechanistic studies of the regulation of SERCA enzymes by PLB would clearly benefit from direct information about the duration of the inhibitory association between the two proteins and how the rate of protein-protein dissociation responds to external stimuli such as calcium and kinase activity. Such information has been difficult to acquire because of the lack of non-invasive techniques that report on the appropriate timescale under equilibrium conditions. This paper describes a new approach based on high-resolution solid-state 13C NMR spectroscopy, which has been used to estimate the rate of dissociation of the monomeric PLB variant, AAA-PLB, from Ca2 + -ATPase when the two proteins are incorporated into lipid bilayers. The method uses a variant of cross-polarization magic angle spinning (CP-MAS) NMR to measure the magnetic dipolar couplings between protons and a non-perturbing 13C label placed within the transmembrane domain of AAA-PLB. These preliminary results demonstrate that the NMR methods are able to detect the interaction between AAA-PLB and SERCA1 and that the rate of dissociation of the two proteins occurs on the order of milliseconds. This new approach offers the potential to examine whether the phosphorylation of PLB or elevation of calcium concentration accelerates the dissociation of the two proteins.
Materials and methods
Materials
The synthetic PLB analogue AAA-PLB, in which the native cysteine residues (C36, C41, C46) were replaced by alanine, was purchased in pure form (>95%) from the Department of Biochemistry, University of Southampton. AAA-PLB contained a 13C label at the α-position of residue 44 in native PLB and is referred to as [α-13C-L44]AAA-PLB. SERCA was prepared in SR membranes from rabbit fast twitch muscle using procedures described elsewhere Citation[22]. A single preparation yielded approximately 50 mg of SERCA1, which was estimated by SDS-PAGE to be over 90% pure. Dimyristoylphosphatidylcholine (DMPC) and dioleoylphosphatidylcholine (DOPC) were purchased from Avanti-Polar Lipids Inc. All other chemicals were purchased from Sigma Chemicals Ltd (UK).
Preparation of membrane samples
[α-13C-L44]AAA-PLB was incorporated into lipid membranes either alone or together with SERCA1. The SERCA-free membranes were prepared according to the following procedure. DMPC and [α-13C-L44]AAA-PLB were dissolved in 50:50 chloroform:methanol at a molar ratio of 20:1 and dried down to a film as described earlier. Samples were then rehydrated in 10 mM phosphate, pH 7 and centrifuged at 13000 rpm in a bench top microfuge. Pellets were stored at −20oC until required for NMR.
Membranes containing DOPC, Ca2 + ATPase and PLB were prepared using an adaptation of previous methods Citation[23], Citation[24]. The three components were combined in a molar ratio (DOPC:PLB:SERCA1) of 160:10:1 according to the procedure described in the following. DOPC and PLB were dissolved in 2–5 ml of 50:50 chloroform/methanol, and dried as described above. The resulting thin film was rehydrated in detergent buffer (10 mM Tris, 0.25 M sucrose, 0.6% β-octyl glucoside, pH 7.5) and sonicated. C12E8 to 1mg/ml was added to the required volume of Ca2 + -ATPase prepared in a buffer containing 10 mM Tris, 0.25 M sucrose, pH 7.5. The samples were then incubated, with stirring, at room temperature for 15 min, followed by 45 min at 4°C. The detergent was removed by the addition of Amberlite XAD2 resin, or for NMR samples, by diluting with 10 mM phosphate, pH 7 and centrifuging at 200,000 g for 45 min at 4°C. Finally a sample of the suspension was centrifuged on a 10–40% density gradient at 60,000 g for 12 h.
Activity measurements
Specific Ca2 + -ATPase activity was quantified at 37°C as the amount of inorganic phosphate (Pi) liberated upon the hydrolysis of ATP, as measured by formation of a phospho-molybdate complex under acidic conditions. The detergent C12E8 (at 0.5 mg/ml) added to the reaction mixtures ensured that any sealed vesicles were disrupted and that the protein was accessible to reagents on both sides of the membrane. Samples were made up in a total volume of 0.3 ml of reaction buffer (30 mM Tris, pH 8) with CaCl2 added to give the required free calcium concentration. Following addition of 0.2 ml of assay medium (4 mM ATP, 4 mM MgCl2, 0.5 mM ethylene glycol bis(β-aminoethyl ether)-N,N,N′,N′-tetraacetic acid [EGTA], 30 mM imidazole, pH 7.3) samples were incubated for 10 min at 37°C. The reaction was stopped in 1 ml of quench solution (ice cold 4.5% ammonium molybdate/perchloric acid 4:1 v/v) before extraction of the complex with 3 ml of n-butylacetate. The mixture was vortexed thoroughly and centrifuged at 2000 rpm for 5 min. The organic layer was then removed and the absorbance read at 320 nm in quartz cuvettes.
The protein concentrations used for calculating specific activity were measured by the modified Lowry method Citation[25], which detected SERCA1 but was not sensitive to the presence of PLB. Free calcium concentrations were determined essentially as described by Tatulian et al. Citation[26]. A buffer solution (1.5 ml) containing 50 µM 1,2-bis(2-aminophenoxy)ehane-N,N,N′,N′-tetraacetic acid (tetrasodium salt) (BAPTA), 20 mM MOPS, 0.1 M KCl 5 mM MgCl2, 5 mM ATP, pH 7 and 2 µl Ca2 + ATPase stock (160 nM) was prepared. Fluorescence emission of BAPTA was measured at a wavelength of 360 nm after excitation at a wavelength of 299 nm.
NMR measurements
All solid state NMR experiments were performed on a Bruker Avance 400 spectrometer operating at a magnetic field of 9.3 Tesla and corresponding to resonance frequencies of 400 MHz for 1H and 100.13 MHz for 13C. Proton-decoupled 13C CP-MAS experiments were performed by rotating the sample at the magic angle in a 4 mm zirconia rotor at rates (ωr/2π) of between 4 kHz and 7 kHz. Sample spinning rates were controlled automatically to within±2 Hz. Hartmann-Hahn cross-polarization from 1H to 13C was achieved over a 1.6 ms contact time at a field of 65 kHz for both nuclei, and protons were decoupled at a field of 85 kHz during signal acquisition. A recycle delay of 2 s was used in all 13C CP-MAS experiments. The sample temperature was maintained between −10°C and 30°C (±0.5°C).
Measurements of 13C-1H dipolar coupling strengths were performed using the constant time dipolar and chemical shift correlation (CT-DIPSHIFT) experiment Citation[27] at a spinning frequency of 4 kHz. In this experiment, transverse 13C magnetization was first achieved by cross-polarization under the conditions described above. The 13C magnetization was then allowed to evolve over a period of exactly two cycles of sample rotation (4π/ωr). In the middle of this period a non-selective 8-µs π pulse was applied at the 13C resonance frequency to refocus the chemical shifts. Dipolar interactions between protons were removed using the frequency switched Lee-Goldburg sequence for an interval t, which begins immediately after the cross-polarization contact period and ends at a defined point before first cycle of sample rotation has elapsed. Following the interval t, protons were decoupled from 13C at a field of 85 kHz for the remainder of the evolution period (i.e., 4π/ωr – t). The 13C free induction decay was then recorded, with two-pulse phase-modulated (TPPM) proton decoupling Citation[28] applied at a field of 85 kHz during the acquisition period. The spectrum was obtained by Fourier transformation of the FID. In a typical experiment a series of 7 such spectra were obtained, each corresponding to a different interval t. Values of the C-H dipolar coupling strength dHC were obtained from peak intensities in the 7 spectra as will be described in the Results section.
Results and discussion
Functional analysis of the NMR samples
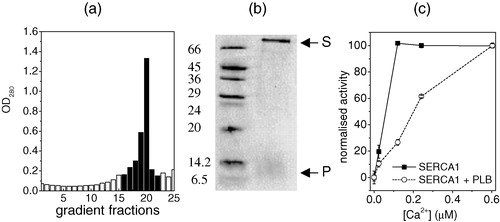
AAA-PLB was incorporated into phosphatidylcholine bilayers in the absence or presence of SERCA1, in quantities and molar ratios suitable for analysis by NMR. Previous studies of the inhibition of Ca2 + -ATPase by PLB have shown that the activity of SERCA1 and its functional response to PLB are very similar to the behaviour of SERCA2 Citation[29]. In this study and in others it has been considered valid, therefore, to substitute the high abundance skeletal muscle enzyme in place of the much scarcer cardiac isoform. The initial lipid to SERCA1 ratio in the reconstitution procedure was 160:1 and the lipid to AAA-PLB ratio was 10:1. Sucrose density gradient centrifugation of the membrane suspension obtained after removing the detergent yielded a single membrane band (see ) that was harvested in several sucrose fractions. Analysis of the pooled fractions by SDS-PAGE indicated that both AAA-PLB and SERCA1 were present in the membranes from the appearance of bands on the gel at positions corresponding to approximately 6.5 kDa and 110 kDa (see ). The position of the band for AAA-PLB on the gel confirmed previous observations that the null-cysteine PLB variant runs as a monomer on SDS-PAGE Citation[9]. The specific ATPase activity of the membrane fraction was measured at different calcium concentrations and was compared with SERCA1 activity in DOPC membranes prepared under identical conditions but containing no AAA-PLB (). In the presence of AAA-PLB, half-maximal ATPase activity was observed at approximately 0.2 µM calcium whereas in the absence of AAA-PLB half-maximal activity was observed at 0.08 µM calcium. Hence the co-reconstitution of AAA-PLB and SERCA1 in a molar ratio of 10:1 significantly reduced the affinity of the enzyme for calcium, an effect that has been observed in other studies Citation[9], Citation[30]. These experiments confirmed, therefore, that the functional interaction between the two proteins could be reconstituted in membranes suitable for NMR analysis.
Figure 1. The analysis of the composition and specific enzyme activity of DOPC membranes into which were incorporated SERCA1 and AAA-PLB in an initial SERCA1/AAA-PLB molar ratio of 1:10 and an initial SERCA1:DOPC ratio of 1:160. The membranes were re-formed after removal of the detergent used in the reconstitution procedure. Optical densities were measured from 25 fractions taken from a sucrose density gradient after sedimentation of the re-formed membranes (a). Fractions with an optical density of more than 0.2 (shaded columns) were combined for further analysis. A 15% SDS-PAGE gel of the combined fractions (b, right lane) showed a band corresponding to molecular weights of between 6.5 and 14.2 kDa, which was consistent with monomeric AAA-PLB (denoted P), and a band above 66 kDa, which was consistent with SERCA1 (denoted S). The bands from marker proteins and their molecular weights are shown in the right lane. In (c) the calcium-dependent ATPase activity of the pooled fractions (circles) is compared with the ATPase activity of membranes prepared under identical conditions but in the absence of AAA-PLB (squares). The two plots are normalized to the activity of each membrane sample at the highest calcium concentration (0.8 µM). All experimental conditions are described in Methods and materials.
Detection of PLB-SERCA interactions by NMR
High-resolution 13C CP-MAS NMR spectroscopy was employed to detect the interactions between AAA-PLB and SERCA1 that were responsible for the inhibitory effect shown in . For this purpose, AAA-PLB was labelled with 13C at the α-carbon position of Leu44 in the helical transmembrane domain (i.e., [α-13C-L44]AAA-PLB) to provide the source of a signature signal from the labelled protein that could be observed in the 13C spectrum. Parallel CP-MAS NMR experiments were performed on [α-13C-L44]AAA-PLB in membranes with or without the presence of SERCA1 at temperatures from 263 K to 303 K.
The 13C CP-MAS spectrum of membranes containing [α-13C-L44]AAA-PLB and SERCA1 (in a 10:1 ratio) under freezing conditions at 263 K exhibited a characteristic peak at 56 ppm from the labelled protein (see , shaded peak). This peak has been assigned previously to monomers of AAA-PLB Citation[31]. An additional peak at 52 ppm was also present, which has been attributed to larger oligomeric species of AAA-PLB that are present in lipid bilayers but are not detected by SDS-PAGE Citation[31]. This species of AAA-PLB is not discussed further here. A signature peak at 56 ppm from the labelled protein was also observed in the spectrum of membranes not containing SERCA1 (not shown).
Figure 2. The results of 13C CP-MAS NMR experiments obtained from DOPC membranes containing [α-13C-L44]AAA-PLB with or without SERCA1. Regions of the NMR spectra of membranes containing SERCA1 at 253 K and 303 K are shown in (a) and (c). The peak of interest assigned to AAA-PLB is shaded for clarity. The spectrum of membranes without SERCA1 at 303 K is shown in (b). Each spectrum was collected after the accumulation of 4096 transients. Below the spectra are shown plots of the areas of the peak at 56 ppm assigned to AAA-PLB over the temperature range 253 K to 303 K. The intensity values corresponding to the spectra shown above the graph are denoted a–c. The sample spinning rate was 4 kHz.
![Figure 2. The results of 13C CP-MAS NMR experiments obtained from DOPC membranes containing [α-13C-L44]AAA-PLB with or without SERCA1. Regions of the NMR spectra of membranes containing SERCA1 at 253 K and 303 K are shown in (a) and (c). The peak of interest assigned to AAA-PLB is shaded for clarity. The spectrum of membranes without SERCA1 at 303 K is shown in (b). Each spectrum was collected after the accumulation of 4096 transients. Below the spectra are shown plots of the areas of the peak at 56 ppm assigned to AAA-PLB over the temperature range 253 K to 303 K. The intensity values corresponding to the spectra shown above the graph are denoted a–c. The sample spinning rate was 4 kHz.](/cms/asset/2c8bbfdd-a399-4395-a145-20cdaa7714cc/imbc_a_117507_uf0002_b.jpg)
The areas of the peak at 56 ppm were measured from the spectra at each of the temperatures. The peak areas for [α-13C-L44]AAA-PLB in SERCA1-free membrane samples (, filled circles) declined markedly as the temperature was raised above freezing and, at 303 K, the peak at 56 ppm had virtually disappeared (, inset). The reduction in peak intensity has been observed previously Citation[32], and occurs because the rate of rotational diffusion of AAA-PLB becomes more rapid as the temperature is raised Citation[31]. The rotational diffusion of the protein has a scaling effect on the magnetic dipolar interactions between the 13C label and neighbouring protons, which becomes more pronounced as the rate of diffusion increases. At the highest temperature of 303 K the dipolar interactions are completely averaged to zero because the rate of rotational diffusion occurs is rapid compared to the magnitude of the dipolar coupling constant (∼12.5 kHz) and because the C-H bond at the α-position of Leu44 is close to 54.7° with respect to the axis of rotation. The consequence of the increasing dipolar scaling effect is that the rate of cross-polarization, which is crucial in the NMR experiment to generate the observed 13C signals, becomes slower and hence the peak intensity diminishes to zero.
Similar measurements were conducted on [α-13C-L44]AAA-PLB in membranes containing SERCA1. The peak intensities declined much less markedly as the temperature was raised than was the case in the absence of enzyme (, open circles) and at 303 K about 40% of the original peak intensity remained (, shaded peak), compared to virtually zero in the absence of enzyme. The functional studies on these membranes summarized in c implied that some of the AAA-PLB molecules must engage with the regulatory site of the SERCA1 molecules to achieve the observed inhibitory effect. Hence, it is reasonable to suggest that the different peak intensity profiles for [α-13C-L44]AAA-PLB in the absence and presence of SERCA is a direct consequence of this inhibitory association.
The peak intensities for [α-13C-L44]AAA-PLB in the presence of SERCA can again be interpreted in terms of molecular dynamics. SERCA1 undergoes rotational diffusion on the tens of microsecond time scale (or longer) in fluid membranes, which is much slower than the nanosecond rotational rates observed for the smaller PLB molecules Citation[33]. When AAA-PLB associates with SERCA1 the smaller protein will assume the slower rate of diffusion of the larger enzyme. Consequently, the H-C dipolar interactions within AAA-PLB molecules are not averaged by rotational diffusion when AAA-PLB is associated with SERCA1. The residual couplings present when AAA-PLB associates with SERCA1 provide the essential mechanism to generate the signature peak in the spectrum and a marked peak intensity can be measured from the spectrum even at 303 K.
Studies of the rate of dissociation of PLB from Ca2 + -ATPase
The previous section illustrates how H-C dipolar interactions within small transmembrane proteins can be modulated significantly by protein rotational diffusion. This phenomenon can, in principle, be exploited to probe the rate of dissociation of AAA-PLB from SERCA1. The feasibility of this approach was investigated using the CT-DIPSHIFT NMR experiment to measure the strength of the H-C dipolar coupling at the labelled site of [α-13C-L44]AAA-PLB and how it relates to the kinetics of the interaction between the labelled protein and SERCA1.
In the CT-DIPSHIFT experiment, 13C magnetization is allowed to evolve for a defined period t under the influence of the dipolar field generated by neighbouring protons. The recorded FID is Fourier transformed and the peak intensity I corresponding to the site of interest (i.e., the α-carbon of Leu 44) is measured from the spectrum. Several such spectra are collected, each corresponding to a different period t covering periods from zero to one cycle of sample rotation (2π/ωr, where ωr is the sample spinning rate in radians). The intensity at time t is given by Citation[34]1 where dHC is the coupling strength, ΩML are the set of Euler angles describing the orientation of each molecule in the magnetic field, κ is a constant related to non-ideal experimental scaling and < … > denotes a statistical powder average over all possible molecular orientations. A plot of I as a function of t is referred to as a dipolar curve, which is highly sensitive to the strength of the dipolar coupling. The experimental curves are compared with curves calculated for different values of dHC to find the coupling strength giving the best agreement. The theoretical coupling for a bonded C-H pair in the absence of molecular motion is 12.5 kHz (i.e., the rigid limit value). In the presence of molecular motion the peak intensities constituting the dipolar curve are modulated and comparison of the experimental data with simulations give an apparent value of the coupling constant d appHC, which can take values of between zero and 12.5 kHz.
For [α-13C-L44]AAA-PLB in the presence of SERCA, the labelled protein may undergo exchange between free and SERCA1-bound phases and consequently the peak intensities of the dipolar curves will be modulated according to the function2
where d fHC and d bHCare the coupling constants for AAA-PLB in the free and bound states, KD is the dissociation constant, τres is the residency time (defined here as the inverse of the off-rate) for AAA-PLB associated with SERCA1 and SB is the fraction of signal from AAA-PLB bound to SERCA. The value of SB is calculated by adaptation of a stochastic method described previously Citation[35]. Experimental dipolar curves for [α-13C-L44]AAA-PLB can therefore be compared with curves calculated for different values of τres to estimate the rate of dissociation from SERCA1, provided the following assumptions are made. First, it is assumed that d fHC is averaged to zero by rapid rotational diffusion of AAA-PLB in the free state, as described above, whereas d bHC takes the rigid limit value of 12,500 Hz because the rotational diffusion of the AAA-PLB/SERCA1 complex is slow on the time scale of the dipolar interaction. This assumption has been tested and confirmed in our previous work Citation[31]. Second, it is assumed that the rate of rotational diffusion of free AAA-PLB occurs on the sub-microsecond time-scale and is much faster than the rate of exchange between free and bound states. This assumption is valid, because the rate of rotational diffusion has been measured and is on the order of tens of nanoseconds Citation[33]. Third, it is assumed that the binding stoichiometry is 1:1 and that over 95% of sites are occupied at the AAA-PLB/SERCA1 molar ratio of 10:1 used here.
With these considerations, dipolar curves can be calculated for any τres value using the function in equation [2], keeping all other parameters (including dHC) constant. Examples of curves for different τres values are shown in . For slow exchange rates (τres=10 ms) the calculated dipolar curve exhibits a pronounced change in 13C peak intensities as the magnetization evolves over one sample rotation cycle (, bottom). By contrast, the curve calculated for a relatively rapid exchange rate (τres=10 µs) exhibits no change in peak intensity as the magnetization evolves over the same period (, top). This latter curve is consistent with the curve expected for AAA-PLB in the absence of SERCA1 (i.e., when d appHC is zero). In fact, the exchange-modulated dipolar curve for any value of τres can be reproduced using the simple exchange-free function, by substituting the appropriate d appHC value into equation [1]. Hence, a direct relationship can be established between d appHCand τres as shown in .
Figure 3. Simulated plots of the dependence of H-C dipolar couplings on the residency time τres of [α-13C-L44]AAA-PLB bound to SERCA1 in lipid membranes. Simulated H-C dipolar curves showing the predicted 13C peak intensity at different fractions of one cycle of sample rotation are shown for residency times τres of 10 µs 500 µs and 10 ms (a). Each curve corresponds to an apparent value of the coupling strength (d appHC) The relationship between d appHC and τres is shown in (b).
![Figure 3. Simulated plots of the dependence of H-C dipolar couplings on the residency time τres of [α-13C-L44]AAA-PLB bound to SERCA1 in lipid membranes. Simulated H-C dipolar curves showing the predicted 13C peak intensity at different fractions of one cycle of sample rotation are shown for residency times τres of 10 µs 500 µs and 10 ms (a). Each curve corresponds to an apparent value of the coupling strength (d appHC) The relationship between d appHC and τres is shown in (b).](/cms/asset/f5c63834-292f-4d44-9d20-d3a89328edae/imbc_a_117507_uf0003_b.jpg)
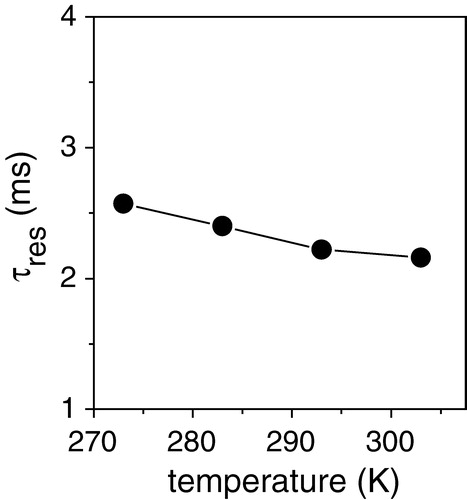
A series of dipolar curves was obtained for [α-13C-L44]AAA-PLB in DOPC membranes containing SERCA1 at temperatures from 273 K to 303 K (see ). The experimental curves are each shown with the curve calculated for the rigid limit dipolar coupling of 12.5 kHz (dashed lines). The simulated rigid limit curve agreed well with an experimental dipolar profile obtained from this sample at a low temperature (253 K) at which rotational motions are eliminated (data not shown). The simulated rigid limit curves were in poor agreement with the experimental curves at 273 K and above, however, which indicates that the dipolar couplings were modulated by exchange of AAA-PLB between free and bound states. The simulated curves of best fit (solid lines) at each temperature were calculated by substituting the appropriate value of τres into equation [2]. In are shown the corresponding values of τres at each temperature. Thus AAA-PLB remains associated with SERCA for a mean residency time of about 2.5 ms in the temperature range studied, or, in other words, the off-rate for SERCA-bound AAA-PLB is approximately 400 s−1.
Figure 4. Experimental H-C dipolar curves and simulations for [α-13C-L44]AAA-PLB in DOPC membranes containing SERCA1 in the molar ratios described in the legend to . Data points were collected at the temperatures stated. The solid lines represent the best fitting curves calculated by substitution of the appropriate τres value into the function summarized in Equation [2]. The dashed lines show the calculated dipolar curve for the rigid limit value of dHC in the absence of exchange. The sample spinning rate was 4 kHz.
![Figure 4. Experimental H-C dipolar curves and simulations for [α-13C-L44]AAA-PLB in DOPC membranes containing SERCA1 in the molar ratios described in the legend to Figure 1. Data points were collected at the temperatures stated. The solid lines represent the best fitting curves calculated by substitution of the appropriate τres value into the function summarized in Equation [2]. The dashed lines show the calculated dipolar curve for the rigid limit value of dHC in the absence of exchange. The sample spinning rate was 4 kHz.](/cms/asset/1328b413-0ccb-4a49-b8e3-722d6775b18d/imbc_a_117507_uf0004_b.jpg)
Figure 5. Measurements of the residency time τres for the association of AAA-PLB with SERCA1 at temperatures from 273 K to 303 K. Values of τres correspond to the curves in best agreement with the experimental data shown in .
Conclusions
This paper has described a non-invasive NMR method for detecting the regulatory interactions between a null-cysteine variant of PLB and SERCA1 after incorporation of the two proteins into lipid bilayers. It has long been recognized that PLB has a reversible inhibitory effect on calcium transport by SERCA enzymes Citation[12], Citation[13], but the underlying kinetics of the interaction between the two proteins have been difficult to measure under equilibrium conditions. Here, inhibition of SERCA1 was reproduced after reconstitution of the enzyme with 13C-labelled null-cysteine analogue AAA-PLB into membranes suitable for analysis by solid-state NMR methods. By measuring the H-C dipolar couplings within the labelled protein, it was found that the inhibition originates from the association of AAA-PLB with SERCA1 for a residency time on the order of 2.5 ms.
The scarcity of quantitative information about the kinetics of the PLB-SERCA interaction has, inter alia, precluded a clear understanding of how calcium transport is restored after phosphorylation of PLB or at high calcium concentrations. The physiologically essential resumption of calcium transport into the SR in response to these stimuli might occur because the dissociation of PLB from SERCA is accelerated, shifting the equilibrium toward predominantly free PLB Citation[12–14]. Alternatively, the two proteins may remain associated with each other, but activity is instead restored as a result of structural rearrangements within one or both proteins Citation[15], Citation[16]. This ambiguity has not been resolved here, but it is possible to speculate upon the feasibility of the two hypotheses from the observations reported in this work. Clearly, the rate of dissociation of AAA-PLB from SERCA1 occurs on the millisecond time scale and is therefore rather slow, but nevertheless the two proteins do indeed fully dissociate from each other under non-phosphorylating and low calcium conditions. It is reasonable to suggest, therefore, that phosphorylation of PLB simply shifts the equilibrium in favour of free PLB by increasing the off-rate or reducing the on-rate for the formation of the PLB-SERCA complex. Recent NMR studies of the structure and dynamics of PLB alone in micelles have shown that, following phosphorylation at Ser-16, the helical cytoplasmic domain of PLB undergoes unwinding and becomes more disordered and less restricted in its motion Citation[36]. Such alterations in both the conformation and dynamics of PLB may explain the changes in the protein-protein interactions observed after phosphorylation of PLB. Structural rearrangements within the cytoplasmic domain of PLB may redefine the surface area that is presented to SERCA and thereby reduce the rate of association with the inhibitory site or sites. Further NMR experiments on AAA-PLB phosphorylated at Ser-16 are under way to test this argument.
Although AAA-PLB appears to freely associate with, and dissociate from, SERCA1, the residency for the bound protein is quite long. Previous reconstitution experiments in this group and by others Citation[12], have shown that PLB must be present in a large excess over Ca2 + -ATPase in order to achieve measurable inhibition of the enzyme, which indicates that the affinity of PLB for SERCA is rather low. The millisecond residency time of PLB suggests, therefore, that the rate of association of PLB with SERCA enzymes must be rather slow. The slow formation of the inhibitory complex may be a consequence of the smaller protein having to locate multiple binding sites within the cytoplasmic and transmembrane regions of the enzyme. Site-directed mutational analysis of PLB suggests that the region from Glu-2 to Ile-18 within the cytoplasmic domain is essential for the functional association of PLB with SERCA Citation[29]. Further interaction sites have been found between the transmembrane domain of PLB and transmembrane helices M2 and M6 of SERCA Citation[37], Citation[38]. Alternatively, binding of PLB to SERCA may occur via an induced fit mechanism. A model based upon cross-linking studies has been proposed in which, in the absence of Ca2 + , PLB is able to fit in to a transmembrane groove formed by M2, M4, M6, and M9 of SERCACitation[38]. In the Ca2 + bound form however this groove is closed, accounting for the ability of Ca2 + to disrupt PLB-SERCA interactions.
The association between PLB and SERCA2 in cardiac myocytes is of particular pharmacological relevance. Both the over expression of PLB relative to SERCA2 and the inefficient phosphorylation of PLB can lead to the disruption of calcium homeostasis in cardiac cells and have been implicated as mechanisms responsible for cardiovascular disorders such as congestive heart failure (CHF) Citation[39]. Treatments involving small molecules that intervene in the interaction between the two proteins to restore normal calcium transport into the SR have been considered as a viable therapeutic option for CHF. The NMR method described here is capable of detecting how the interaction between the SERCA enzymes and PLB may be influenced by changes to the physiological equilibrium induced by the phosphorylation of PLB or changes in calcium concentration. Ultimately, these NMR methods may also have a role to play in drug discovery by detecting the disruptive effects of small molecules.
The British Heart Foundation is acknowledged for a post-doctoral research fellowship (to E.H.). The BBSRC are thanked for support toward a 400 MHz NMR spectrometer under the Joint Research Equipment Initiative.
References
- Bers DM. Calcium fluxes involved in control of cardiac myocyte contraction. Circ Res 2000; 87: 275–281
- Stokes DL, Wagenknecht T. Calcium transport across the sarcoplasmic reticulum: Structure and function of Ca2+-ATPase and the ryanodine receptor. Eur J Biochem 2000; 267: 5274–5279
- Mascioni A, Karim C, Barany G, Thomas D, Veglia G. Structure and orientation of sarcolipin in lipid environments. Biochemistry 2002; 41: 475–482
- Lee AG. How phospholamban could affect the apparent affinity of Ca2+-ATPase for Ca2+ in kinetic experiments. FEBS Letters 2003; 551: 37–41
- Tada M, Katz AM. Phosphorylation of the sarcoplasmic-reticulum and sarcolemma. Ann Rev Physiol 1982; 44: 401–423
- Asahi M, Green NM, Kurzydlowski K, Tada M, MacLennan DH. Phospholamban domain IB forms an interaction site with the loop between transmembrane helices M6 and M7 of sarco(endo)plasmic reticulum Ca2+ ATPases. Proc Natl Acad Sci USA 2001; 98: 10061–10066
- Cornea RL, Jones LR, Autry JM, Thomas DD. Mutation and phosphorylation change the oligomeric structure of phospholamban in lipid bilayers. Biochemistry 1997; 36: 2960–2967
- Li M, Reddy LG, Bennett R, Silva ND, Jones LR, Thomas DD. A fluorescence energy transfer method for analyzing protein oligomeric structure: Application to phospholamban. Biophys J 1999; 76: 2587–2599
- Karim CB, Marquardt CG, Stamm JD, Barany G, Thomas DD. Synthetic null-cysteine phospholamban analogue and the corresponding transmembrane domain inhibit the Ca-ATPase. Biochemistry 2000; 39: 10892–10897
- Autry JM, Jones LR. Functional co-expression of the canine cardiac Ca2+ pump and phospholamban in Spodoptera frugiperda (Sf21) cells reveals new insights on ATPase regulation. J Biol Chem 1997; 272: 15872–15880
- Kimura Y, Kurzydlowski K, Tada M, MacLennan DH. Phospholamban inhibitory function is activated by depolymerization. J Biol Chem 1997; 272: 15061–15064
- Reddy LG, Autry JM, Jones LR, Thomas DD. Co-reconstitution of phospholamban mutants with the Ca-ATPase reveals dependence of inhibitory function on phospholamban structure. J Biol Chem 1999; 274: 7649–7655
- Chen Z, Stokes DL, Rice WJ, Jones LR. Spatial and dynamic interactions between phospholamban and the canine cardiac Ca2+ pump revealed with use of heterobifunctional cross-linking agents. J Biol Chem 2003; 278: 48348–48356
- James P, Inui M, Tada M, Chiesi M, Carafoli E. Nature and site of phospholamban regulation of the Ca-2+ pump of sarcoplasmic-reticulum. Nature 1989; 342: 90–92
- Jones LR, Cornea RL, Chen ZH. Close proximity between residue 30 of phospholamban and cysteine 318 of the cardiac Ca2+ pump revealed by intermolecular thiol cross-linking. J Biol Chem 2002; 277: 28319–28329
- Asahi M, McKenna E, Kurzydlowski K, Tada M, MacLennan DH. Physical interactions between phospholamban and sarco(endo)plasmic reticulum Ca2 + -ATPases are dissociated by elevated Ca2+, but not by phospholamban phosphorylation, vanadate, or thapsigargin, and are enhanced by ATP. J Biol Chem 2000; 275: 15034–15038
- Negash S, Yao Q, Sun HY, Li JH, Bigelow DJ, Squier TC. Phospholamban remains associated with the Ca2+- and Mg2+-dependent ATPase following phosphorylation by cAMP-dependent protein kinase. Biochem J 2000; 351: 195–205
- Zhai J, Schmidt AG, Hoit BD, Kimura Y, MacLennan DH, Kranias EG. Cardiac-specific overexpression of a superinhibitory pentameric phospholamban mutant enhances inhibition of cardiac function in vivo. J Biol Chem 2000; 275: 10538–10544
- Li JH, Bigelow DJ, Squier TC. Conformational changes within the cytosolic portion of phospholamban upon release of Ca-ATPase inhibition. Biochemistry 2004; 43: 3870–3879
- Mueller B, Karim CB, Negrashov IV, Kutchai H, Thomas DD. Direct detection of phospholamban and sarcoplasmic reticulum Ca-ATPase interaction in membranes using fluorescence resonance energy transfers. Biochemistry 2004; 43: 8754–8765
- Li JH, Xiong YJ, Bigelow DJ, Squier TC. Phospholamban binds in a compact and ordered conformation to the Ca-ATPase. Biochemistry 2004; 43: 455–463
- East JM, Lee AG. Lipid selectivity of the Ca2+ and Mg2+ ion dependent adenosinetriphosphate studied with fluorescence quenching by a bromine phospholipid. Biochemistry 1982; 21: 4144–4151
- Dalton KA, Pilot JD, Mall S, East JM, Lee AG. Anionic phospholipids decrease the rate of slippage on the Ca2 + -ATPase of sarcoplasmic reticulum. Biochem J 1999; 342: 431–438
- Reddy LG, Jones LR, Thomas DD. Depolymerization of phospholamban in the presence of calcium pump: A fluorescence energy transfer study. Biochemistry 1999; 38: 3954–3962
- Waterborg JH, Matthews HR. The Lowry method for protein quantitation. The protein protocols handbook, JM Walker. Humana press, New Jersey 1996; 7–9
- Tatulian SA, Chen B, Li J, Negash S, Middaugh CR, Bigelow DJ, Squier TC. The inhibitory action of phospholamban involves stabilization of a-helices within the Ca-ATPase. Biochemistry 2002; 41: 741–751
- Hong M, Gross JD, Griffin RG. Site-resolved determination of peptide torsion angle phi from the relative orientations of backbone N-H and C-H bonds by solid-state NMR. J Phys Chem B 1997; 101: 5869–5874
- Bennett AE, Rienstra CM, Auger M, Lakshmi KV, Griffin RG. Heteronuclear decoupling in rotating solids. J Chem Phys 1995; 103: 6951–6958
- Toyofuku T, Kurzydlowski K, Tada M, Maclennan DH. Amino-acids Glu(2) to Ile(18) in the cytoplasmic domain of phospholamban are essential for functional association with the Ca2+-ATPase of sarcoplasmic-reticulum. J Biol Chem 1994; 269: 3088–3094
- Reddy LG, Jones LR, Cala SE, Obrian JJ, Tatulian SA, Stokes DL. Functional reconstitution of recombinant phospholamban with rabbit skeletal Ca2 + -Atpase. J Biol Chem 1995; 270: 9390–9397
- Hughes, E (2005) , Clayton, J, Middleton, DA. In press. Probing the oligomeric state of phospholamban variants in phospholipid bilayers from solid-state NMR measurements of rotational diffusion rates. Biochemistry. ;44:4055–4066.
- Ahmed Z, Reid DG, Watts A, Middleton DA. A solid-state NMR study of the phospholamban transmembrane domain: Local structure and interactions with Ca2 + -ATPase. Biochim Biophys Acta 2000; 1468: 187–198
- Karim CB, Kirby TL, Zhang Z, Nesmelov Y, Thomas DD. Phospholamban structural dynamics in lipid bilayers probed by a spin label rigidly coupled to the peptide backbone. PNAS 2004; 101: 14437–14442
- Huster D, Xiao L, Hong M. Solid-state NMR investigation of the dynamics of the soluble and membrane-bound colicin Ia channel-forming domain. Biochemistry 2001; 40: 7662–7674
- Patching SG, Brough AR, Herbert RB, Rajakarier JA, Henderson PJF, Middleton DA. Substrate affinities for membrane transport proteins determined by C-13 cross-polarization magic-angle spinning nuclear magnetic resonance spectroscopy. J Am Chem Soc 2004; 126: 3072–3080
- Metcalfe EE, Traaseth NJ, Veglia G. Serine 16 phosphorylation induces an order-to-disorder transition in monomeric phospholamban. Biochemistry 2005; 44: 4386–4396
- Asahi M, Kimura Y, Kurzydlowski K, Tada M, MacLennan DH. Transmembrane helix M6 in sarco(endo)plasmic reticulum Ca2 + -ATPase forms a functional interaction site with phospholamban. Evidence for physical interactions at other sites. J Biol Chem 1999; 274: 32855–32862
- Toyoshima C, Asahi M, Sugita Y, Khanna R, Tsuda T, MacLennan DH. Inaugural article: Modeling of the inhibitory interaction of phospholamban with the Ca2+ ATPase. Proc Natl Acad Sci USA 2003; 100: 467–472
- Schmidt A, Edes I, Kranias EG. Phospholamban: A promising therapeutic target in heart failure?. Cardiovasc Drugs Ther 2001; 15: 387–396