Abstract
Adenosine diphosphate ribosylation factor-1 (ARF1) is activated by cell membrane binding of a self-folding N-terminal domain. We have previously presented four possible conformations of the membrane bound, human ARF1 N-terminal peptide in planar lipid bilayers of DOPC and DOPG (7:3 molar ratio), determined from lamellar neutron diffraction and circular dichroism data. In this paper we analyse the four possible conformations by molecular dynamics simulations. The aim of these simulations was to use MD to distinguish which of the four possible membrane bound structures was the most likely. The most likely conformation was determined according to the following criteria: (a) location of label positions on the peptide in relation to the bilayer, (b) lowest mean square displacement from the initial structure, (c) lowest system energy, (d) most peptide-lipid headgroup hydrogen bonding, (e) analysis of phi/psi angles of the peptide. These findings demonstrate the application of molecular dynamics simulations to explore neutron diffraction data.
Introduction
Molecular dynamics (MD) simulations have been used to provide information about numerous biological molecules, including phospholipid membranes and membrane proteins (Balali-Mood et al. [Citation2003], Scott [Citation2002], Mashl et al. [Citation2001], Moore et al. [Citation2001], Berger et al. [Citation1997], Feller et al. [Citation1997]). They have been successfully applied to investigations of ion channels and membrane-lytic peptides (Forrest et al. [Citation2000], Randa et al. [Citation2001], Sansom et al. [Citation1998], Tieleman et al. [Citation1998], Tieleman et al. [Citation1999]). Other membrane protein studies have concentrated on proteins which lie on the surface of the bilayer (Berneche et al. [Citation1998], Nina et al. [Citation2000]). However, a major difficulty encountered when constructing a membrane and protein system for study by simulation is in the assembly of the starting structure. Proper placement of the protein within the bilayer/water simulation box must be determined before simulations can begin (Basyn et al. [Citation2003]). Since the total system can be very large, simulation times are necessarily relatively short. As a result, there is generally not enough simulation time available for whole body equilibration and rearrangement of the system so that the protein finds its appropriate place in the bilayer. There are several possible means to overcome this problem. Firstly, some simplifications can be made, such as mean field approximations of the lipid environment (Basyn et al. [Citation2001], [Citation2003]), or solvent (Kessel et al. [Citation2001], Bechor & Ben-Tal [Citation2001], Lins et al. [Citation2001]). Another alternative would be to use coarse-grain approaches to over come the timescale problem (Marrink & Mark [Citation2004], Nielsen et al. [Citation2005]).
In this paper, we explore the use of better initial conditions from experimental observations.
We have previously reported neutron diffraction measurements that were carried out in order to elucidate the bilayer location and orientation of a peptide derived from the N-terminal domain of human adenosine diphosphate ribosylation factor-1 (ARF1) in a mixed bilayer containing dioleoyl-phosphatidylcholine (DOPC) and dioleoyl-phosphatidylglycerol (DOPG) in a 7:3 molar ratio (Davies et al. [Citation2003]). In this study we used specific deuteration at the three phenylalanine residues of the peptide. Neutron diffraction, using the difference method, enabled us to determine two important parameters. First is the depth of three residues in the bilayer to a resolution of better than 1 Å. Secondly, the diffraction data shows the time-averaged amplitude of the fluctuations of the same residues, which can be compared to the simulation results. Combined with a model of the secondary structure, there are two mathematically possible orientations of the peptide with respect to the membrane. As explained in an earlier paper (Bradshaw et al. [Citation2000]) at least four deuterated labels are normally required in order to orient a peptide unambiguously and result in a single fitted model, because it is possible to fit a plane to any three points, making it impossible to distinguish between two orientations of the peptide. Two other possible solutions arose as a result of uncertainty regarding the exact structure of the peptide, which may be completely α-helical, or partially α-helical, as in the crystal structure of the intact protein (Amor et al. [Citation1994]). Faced with these four possibilities, we used thermodynamic arguments, such as the location of hydrophobic and hydrophilic residues, to discriminate between them and propose what we considered to be the most likely structure. The aim of this current study was to see if molecular modelling techniques could be used to discriminate more rigorously between the possibilities and unanimously determine the biologically correct structure. Here, we present a detailed MD study of a peptide in a mixed lipid bilayer, in which the initial conditions of the system were pre-determined from experimental results. The peptide under study was the N-terminal sequence of adenosine diphosphate ribosylation factor-1 (pARF1), which was placed in a mixed lipid bilayer containing DOPC and DOPG.
ARFs are a family of intracellular G proteins that are activated by certain cell-signaling cascades (Spang, [Citation2002]). The full length ARFs are approximately 20 kD in size (Amor et al. [Citation1994]) and at least six isoforms have been identified. ARF1 is of particular biomedical interest as structural and biochemical studies of the GTP binding and hydrolysis cycle have provided clues about the potential mechanisms of action of intracellular messengers such as phosphatidylinositol, phopshatidic acid and diacylglycerol (Randazzo et al. [Citation2000]). To accomplish this, they combine the characteristic GDP/GTP switch with a unique membrane/cytoplasm switch. Membrane binding is also crucial to the normal biological regulation of ARFs by their guanine exchange factor (GEF) proteins and GTPase activating proteins (GAPs) (Menetrey et al. [Citation2000]). In addition, ARFs have been pinpointed as being involved in glucose transport (Cormont & Le Marchand-Brustel [Citation2001]). Furthermore, they have been implicated in the regulation of exocytosis (Collins [Citation2003]).
A number of crystal structures have been published for the soluble, inactive forms of ARF proteins. However, little is known about the active, membrane bound structures of ARF, the details of which are crucial to our understanding of how these proteins function both as molecular switches and bio-timers in cells. Membrane binding is a necessary precursor to the large structural reorganizations of the core and switch regions of ARF1 (Goldberg [Citation1999]). The highly conserved N-terminal domain primarily controls the membrane binding of ARF1 (Antonny et al. [Citation1997], Franco et al. [Citation1993]), and is assumed to be an amphipathic helix lying approximately parallel to the membrane surface. The helical region seen within the N-terminal domain of ARF1 crystal structure may elongate upon membrane association (Amor et al. [Citation1994]). Changes in the length of the helix, and thus the connecting flexible linker region, could affect the molecular reorganization of the core and switch regions of ARF1. Differences in the length of the flexible linker regions of ARF1 and ARF6 may contribute to the differences seen in the switch regions of these two ARF isoforms, which are thought to play an important physiological role in endocytotic pathways (Menetrey et al. [Citation2000]). To understand this role as a reversible membrane anchor, it would be necessary to know the precise depth and orientation of the N-terminal peptide domain within a lipid bilayer.
In the previous study, circular dichroism (CD) was used to indicate the secondary structure for our models (Davies et al. [Citation2003]). The first model was taken directly from the published crystal structure of the full ARF1 protein. This model has similar helical content to that measured with CD. The second model was derived from the first, by adjusting the phi and psi angles into a fully α-helical conformation. Since, from the neutron data alone, each of these two models of secondary structure has two alternative orientations relative to the membrane, we were left with four possibilities to choose from. Based on a consideration of the location of hydrophobic and hydrophilic residues on the peptide we argued that only one of these conformations is likely to be correct. From this conformation, it was possible to speculate that the ARF1p helical region does not elongate when bound to the membrane and lies parallel to the membrane.
The neutron diffraction and CD data allows us to build a more precise computational model of ARF1p within a DOPC/DOPG bilayer than would otherwise be possible. Analysis of the MD simulations shows one orientation of the peptide within the bilayer, to be the most likely one. More importantly, the results highlight the necessity of experimentally determined structural information in the construction of a peptide/membrane simulation system.
Methods
Determination of secondary structure models
The sequence of ARF1p used in the neutron and CD experiments is GNIFANLFKGLFGKK (SWISSPROT #P32889). The N-terminus of the peptide was capped with an acetyl group, whereas the C-terminus (q= − 1) and the three lysine residues were charged (q= + 1). Full atomic coordinates and simulation topology for the peptide in the same Cartesian coordinate system as the bilayer were determined from the neutron diffraction experiments.
The four structural models that satisfy the experimental data are as follows:
Model A
The atomic coordinates of model A were taken from the N-terminal domain of the crystal structure of ARF1 (Amor et al. [Citation1994]) and oriented to fit the data. In this model, the backbone of the peptide lies at an angle of less than 5° to the bilayer surface. From a thermodynamic standpoint, this model would seem to be quite feasible because the hydrophobic surface of the peptide is oriented towards the core of the membrane.
Model B
Although the structure of the peptide is the same as model A, its orientation with respect to the membrane is effectively inverted, meaning that the hydrophobic surface of model B faces away from the membrane. This orientation appears to be less favourable from a thermodynamic point of view. For example, Ile-3 was unexpectedly exposed to the aqueous environment.
Model C
The structure of this peptide was obtained by energy minimization of model A, while the phi and psi angles were constrained into an α-helix. Although the relative orientation of the hydrophobic and hydrophilic residues appears to be favorable, this particular orientation lifts leucine residues 7 and 11 out of the bilayer. It should be noted that ab initio α-helices could not be positioned to fit the neutron data.
Model D
The peptide structure is similar to model C, but the orientation of the peptide has been reversed. Lysines 14 and 15 are pushed further into the bilayer than would be deemed physically/chemically realistic.
Although common sense predicts that models B and D are unlikely to be correct orientations of the membrane bound peptide, they were included in the study for two reasons:
Based on the neutron data described, they can not be discounted.
To provide a realistic test of the potential of the combined approach to produce a single molecular structure without subjective interference.
Construction of the bilayer
The pre-requisite for peptide/membrane simulations is a fully equilibrated bilayer. An equilibrated mixed DOPC/DOPG bilayer has been built and successfully simulated by us previously (Balali-Mood et al. [Citation2003]). The bilayer was constructed with explicit hydrogens in the phospholipid headgroups, and implicit hydrogens in the acyl chains. Atomic point charges for both PC and PG head-groups were generated by HyperChem 5.0 (Hypercube Inc, Waterloo, Canada) using the STO-3G set as used in previous studies of DMPC and DPPC (Berger et al. [Citation1997], Feller et al. [Citation1997]). The bond, angle and torsion energies were derived from the GROMACS (Lindahl et al. [Citation2001]) explicit forcefield (ffgmx2). Two monolayers were constructed, one of 70 DOPC molecules and one of 70 DOPG molecules, by replicating each lipid in an array of ten molecules by seven molecules. The two monolayers were then superimposed and either the DOPC or the DOPG molecule at each site was deleted to leave a single molecule in that position. In order to replicate the conditions of the neutron measurements, a random number generator was used to select the choice of molecule for deletion at each site, to give a final ratio of 7 DOPC to 3 DOPG molecules. The composite monolayer of 70 lipid molecules was then duplicated and rotated to form a 140-lipid bilayer. The genion program in GROMACS was used to assign Na+ counter ions for the negatively charged DOPGs, and PME methods were used for the treatment of electrostatic interactions as implemented in GROMACS.
The MD simulation software, GROMACS was used to centre the bilayer in a triclinic box, and a total of 2815 Simple Point Charge (SPC) water molecules were added. The ratio of water molecules per lipid (20.1:1) was chosen to replicate the conditions used in the neutron diffraction experiments. Energy minimization (EM) by the ‘steepest descent’ method was used to remove bad contacts and reduce the potential energy of the system. The system was then subjected to a 20 ps MD simulation utilizing the NVT (18315 atoms/particles, volume of 800 nm3, and temperature of 300 K) ensemble. The rationale behind this protocol was to allow the SPC molecules to equilibrate naturally within the system, without SPC molecules being pressurized into the bilayer. The system was then subjected to another MD simulation using the NPT (18315 atoms/particles, isotropic pressure of 1 bar and temperature of 300 K) ensemble over a 4000 ps period.
Placement of the peptide in the bilayer
Each peptide model was superimposed on the equilibrated membrane, centred in x and y in the simulation box. The location of the peptide in the z direction was determined from the neutron data, as discussed previously. Close contacts between atoms (<1.5 Å) were detected, and all molecules (water, DOPC & DOPG) identified as significantly overlapping the peptide co-ordinates were removed manually. Finally, the molecules and atoms were renumbered. To balance the system charge, a Cl− ion was placed near each of the three lysine residues of the peptide, and a Na+ ion was placed near the negatively charged C-terminus of pARF1, using the genion program in GROMACS.
summarizes the molecular content of the four models. The entire system was then subjected to EM (steepest descent method) prior to an NVT (number of particles described below, constant volume of 275 nm3, constant temperature of 300 K) ensemble simulation for 20ps. The NVT ensemble simulation was performed in order for the water molecules in the system to become re equilibrated after the disruption to the system. shows the number of molecules in each system simulated. The numbers of water molecules per lipid and the PC:PG ratio were only slightly altered from the original plain bilayer.
Table I. The number of lipids and SPC solvent molecules present in each model. The molecules deleted were in direct atomic conflict with ARF1p. As can be observed, the ratios of DOPC:DOPG were not significantly altered; the original ratio of waters (SPC) per lipid molecule (20.1:1) was altered by <1%. The control bilayer (no peptide) contained 140 lipids in total (98 DOPC and 42 DOPG) together with 42 Na+ counter-ions and 2954 water molecules. The figures in parentheses indicate the number of molecules deleted in the peptide containing (upper) leaflet.
Each of the four systems was then run with an NPT ensemble simulation utilizing the PME algorithm to treat electrostatic and long-range interactions. All NPT ensemble simulations were run at 300 K and isotropic 1 bar pressure, with coupling constants of 5 and 1 ps, for pressure and temperature, respectively. All simulations were for 4000 ps each, at the rate of about 80 ps per processor-day.
Results and discussion
Label positions and width
A useful criterion in assessing the validity of each of the simulated models is how closely the positions of the three phenylalanine labels agree with the experimentally determined values calculated from the neutron data. illustrates the positions of each of the labelled residues in all four models, during the last ns of the simulation, and compares it with the values obtained from the neutron data. The position of each label is shown in . As with the neutron results, the locations are expressed as the distance from the centre of the bilayer in Ångstroms. We had previously proposed that model A was most likely to be the biologically correct conformation. This proposal is supported by the label positions in model A, which have remained within 1% of the positions calculated from the neutron data, throughout the 4 ns of the simulation. Model C showed values which were close to experimental values, although not to the same extent as those observed in model A. However, models B and D had values that have deviated from the initial labels and are clearly no longer in agreement with experimental data.
Figure 1. A schematic representation of the label positions in the NPT ensemble. Comparison is shown between each of the four simulated model, as well as experimental data (Davies et al. [Citation2003]).
![Figure 1. A schematic representation of the label positions in the NPT ensemble. Comparison is shown between each of the four simulated model, as well as experimental data (Davies et al. [Citation2003]).](/cms/asset/374953e0-1a37-40ca-8311-3bfd086968c2/imbc_a_121997_f0001_b.jpg)
Table II. The position and width of the three phenylalanine residues of ARF1p, deuterium labeled in the neutron study (Davies et al. 2003). The table provides a comparison between experimental data previously published and two of the simulated models. Both of these models were in the correct hydrophobic/hydrophilic orientation. The position of each label site is expressed as the distance from the centre of the bilayer. The width of each label site is expressed as 1/e in both experimental and simulation studies.
also displays the peak widths obtained from the four simulated models. We had previously calculated the width of the labelled residues from the neutron data. The width of the label positions was narrower in all four of the simulated configurations. However, this is to be expected, since the neutron data represent the average of thousands of peptides embedded in a lamellar stack of bilayers, as opposed to the simulation systems whereby only one peptide was present. Nevertheless, we can see that, once again, model A displays values closest to experimental values.
The amplitude of the fast fluctuation motion of the phenylalanine residues is indicated in the widths of the peaks in . For models A and C, the simulation matches the neutron data well, while for models B and D, there were greater oscillations. This suggests that the simulations reproduced the local environment of those residues of model A and C realistically. Conformation A had an average mean square displacement (MSD) of 0.40 nm2 conformation C a MSD of 0.50 nm2, conformation B a MSD of 0.64 nm2 and conformation D a MSD of 0.78 nm2. Perhaps not surprisingly, models B and D had higher average MSD values, this is primarily due to the fact that both models were not placed in the correct hydrophobic orientation, resulting in less stable structures when compared to models A and C. In addition, the label positions deviated from experimental values (in both models B and D) within the 20 ps NVT simulation of the peptide, as well as the first 50 ps of the 4000 ps NPT run. shows a snapshot of the starting configurations of all models.
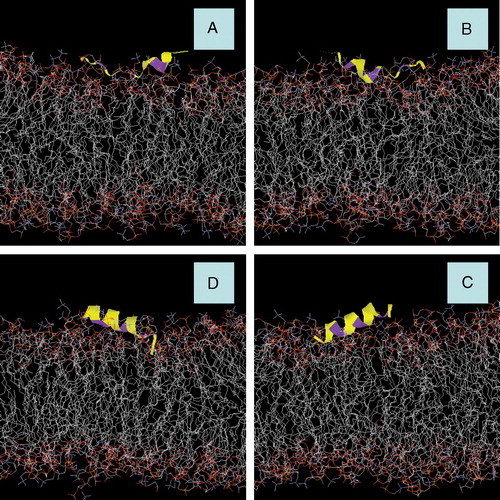
Figure 2. Snapshots of AFR1p in a mixed DOPC/DOPG bilayer. (A) Starting snapshot of Model A. (B) Starting snapshot of Model B. (C) Starting snapshot of Model C. (D) Starting snapshot of Model D. The peptide is displayed with a yellow colouring. The phenylalanine residues are represented with purple colouring. Water molecules and Na+ counter-ions are deleted for greater clarity. This figure is reproduced in colour in Molecular Membrane Biology online.
The ARF1p peptide models did not shift significantly during the simulations in models A and C. illustrates the time-averaged position of the hydrogens of the three phenylalanine residues, both from simulation and from the neutron data. The whole body displacement of the peptide in the z direction was negligible for model A, as the position of each phenylalanine remained close to its experimentally measured position during the simulation. However, the peptides in models B and D did ‘ride’ up and down from their initial conditions. Furthermore, the peptide axes did not tilt more than 1° from its initial angle in model A. However, models B, C and D () reduced their tilt by 4°, 5° and 8°, respectively.
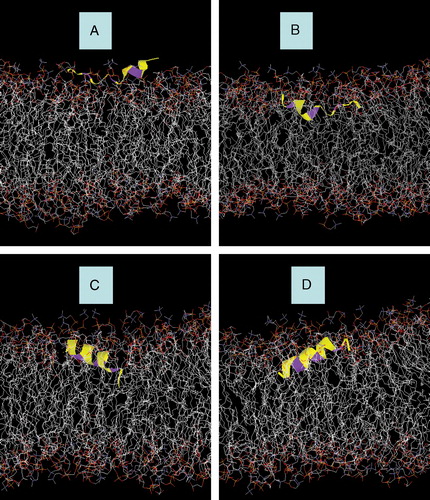
Figure 3. Snapshots of AFR1p in a mixed DOPC/DOPG bilayer. (A) Model A after 3.9 ns of MD simulation with an NPT ensemble. (B) Model B after 3.9 ns of MD simulation with an NPT ensemble. (C) Model C after 0.5 ns of MD simulation with an NPT ensemble. (D) Model D after 0.5 ns of MD simulation with an NPT ensemble. The peptide is displayed with a yellow colouring. The phenylalanine residues are represented with purple colouring. Water molecules and Na+ counter-ions are deleted for greater clarity.
System energy
Each of the models (bilayer, peptide, water and counter-ions) reached a near equilibrium energy after only 10 ps of an NVT simulation. Furthermore, the energy fluctuations were never larger than 2000 kJ/mol. The kinetic energies of the four models were within 1% of each other, reflecting the fact that they all contained a similar number of atoms.
Model A is the most energetically favourable conformation. The mean total energy of model A was −9.87×10⁵ kJ/mol. Conformations C, B and D had mean total energies of −9.58×10⁵, −9.21×10⁵ and −9.16×10⁵ kJ/mol, respectively. The differences in energy are almost certainly due to the energetically unfavourable conditions in which the peptide was placed in models B, C and D. In the earlier paper (Davies et al. [Citation2003]), we reported that the hydrophobic moment of models B and D was unfavourably oriented, with the hydrophobic face of the peptide upward, towards the water. These models are expected, therefore, to have a higher potential energy than A and C (hydrophobic face down). Conformation D has such a large tilt (20°), that it is expected to cause the most disruption to the system, as the C-terminus has inserted into the hydrophobic oleoyl chains of the bilayer. Thus it was not surprising to find it had the largest total energy. The order in which we find the system energies, clearly demonstrate the effect of hydrophobicity on the binding of the peptide to the membrane.
For comparison, we simulated the peptide in a water solvent box and added its system potential energy to that of the pure membrane. The α-helical structure of ARF (models C and D) in water possessed a slightly higher total energy (−4.9×10⁴) than the crystal structure (−4.5×10⁴) (models A and B). Importantly, the energy of the combined system for models A and C were less than the combined energy of the separate simulations.
Hydrogen bonding
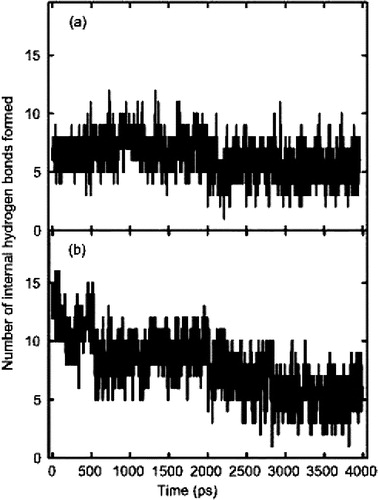
The hydrogen bonding between the peptide and the bilayer was monitored during the course of all four simulations. The GROMACS analysis programme (g_hbond) was used to calculate the maximum number of possible hydrogen bonds and identified 30 donors and 38 acceptors within the peptide. The internal hydrogen bonds within models A (crystal structure) and C (initial α-helix) were monitored throughout the 4000 ps of simulation time and are shown in .
Figure 4. Total internal hydrogen bonding within ARF1p: (a) the stable hydrogen bonding pattern of the crystal structure of model A. There are no major fluctuations observed within this model. (b) the initial α-helical structure of model C. The initial hydrogen bonding pattern within this model was typical of an α-helix. However, as the simulation progresses, the number of hydrogen bonds was reduced to values closely associated with model A.
Model A had the highest intermolecular hydrogen bonding, with an average of 34 bonds, throughout the course of the simulation. This figure comprises 21 peptide-SPC and 13 peptide-phospholipid bonds, 9 of which were with the PC headgroups. All amino acid residues apart from the first residues glycine (Gly-1) and asparagine (Asn-2), were involved in hydrogen bonding with PC headgroups. Four amino acids hydrogen bonded with PG headgroups: Asn-2 and all three lysine residues.
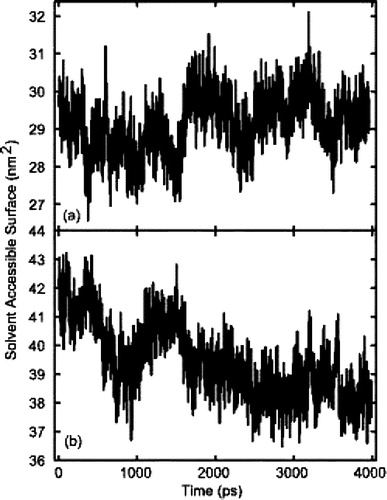
The next highest number of h-bonds was found in model C, with an average of 29, which breaks down as 24 peptide-SPC and 7 peptide-phospholipid bonds. Much of the difference between these two models is accounted for by the fact that the C-terminal lysines did not form hydrogen bonds in model C. This conformation of the peptide produced a slightly higher number of hydrogen bonds with the solvent in comparison to model A. This was due to the higher solvent accessible surface (SAS) of model C. A comparison of SAS, between models A and C, is shown in .
Figure 5. Solvent Accessible Surface (SAS) of models A and C. (a) model A which, due to a partially helical structure, had a lower SAS than model C. However, as can be seen the fluctuations of SAS were lowest in model A. (b) the SAS of model C. Initially the SAS of model C was higher, primarily due to the peptide's helical conformation. As the simulation progressed, the SAS of model C was reduced, due to a decrease in helical content.
As expected, models B and D, both of which have the amphipathic peptide inverted, have far fewer hydrogen bonds, 18 for model B and 15 for model D. Model B contained only 4 hydrogen bonds between the peptide and lipids. These hydrogen bonds were formed between PC headgroups and asparagines (Asn-2), lysine (Lys-9) and phenylalanine (Phe-12), respectively. In addition Lys-9, which formed a hydrogen bond with the PC headgroup, also formed a hydrogen bond with a PG headgroup. This conformation of the peptide only formed 14 stable hydrogen bonds with the solvent (SPC) present in the system.
At this point, we felt it was appropriate to discard models B and D. Taking into consideration the changes in label positions of the phenylalanine residues, the higher values observed in average MSD, total energy of the respective systems, as well as a significantly lower number of hydrogen bonds seen in these two models, we considered that no further analysis of these simulated systems was justified. The common feature in these models was the incorrect hydrophobic orientation.
Structural changes
Helical content
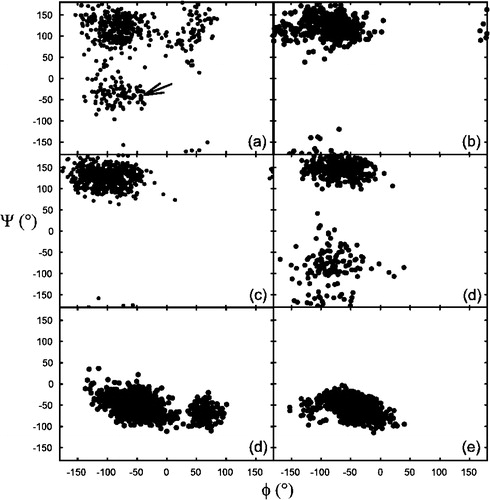
Phi and psi angles of selected residues were analysed, as illustrated in the Ramachandran plot in . The main difference between models A and C was the extent of the helical region. In model A, the helix terminates before the last 3 residues. Ramachandran plots for individual residues of models A and C (examples shown in ) demonstrate that these three residues retain a predominantly non-helical structure in model A throughout the simulation. In contrast, however, the corresponding residues in model C unwind during the simulation to a non-helical conformation, despite having a helical structure to start with. An example amino acid residue taken from the helical region of the peptide (Ile-3) demonstrates that the helical conformation of this section of the peptide is maintained through the four nanoseconds of MD simulation. In other words, model C rapidly reverted to a structure closely approximating that of model A, very soon after the simulation started.
Figure 6. Ramachandran plot of certain amino acid residues in models A and C. (a) The penultimate lysine residue in model C, between 0 and 1 ns of simulation. This residue was initially (arrow), but rapidly developed a non-helical conformation. (b) The same residue between 3–4 ns of simulation. There is no indication of helicity within this time frame. (c) The penultimate residue (Lys-13) in model A between 0 and 1 ns. As can be observed no helicity is present in the starting structure. (d) The same residue between 3 and 4 ns of simulation. The conformation is still predominantly non-helical, although there are minor fluctuations in phi/psi these are still outside the α-helical region of the Ramachandran plot. (d) A complete 0–4 ns Ramachandran plot of a residue from the α-helical region of the peptide (Ile-3) in model C. The conformation remains predominantly helical throughout the 4 ns simulation period. (e) The corresponding isoleucine residue in model A, which also maintains its predominantly helical conformation throughout the 4 ns of simulation.
Effects on the bilayer
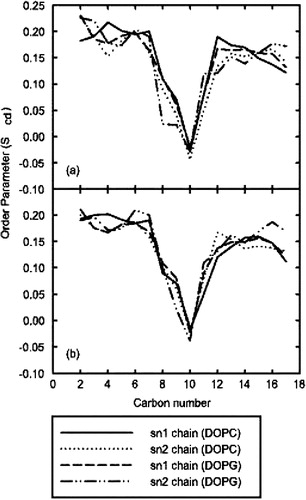
The bilayer was not significantly altered by the presence of the peptide. The area per lipid and volume per lipid (determined from the undisturbed monolayer opposite the peptide) were 74 Å2 and 1312 Å3 respectively. These values compare favorably with previously reported values (Balali-Mood et al. [Citation2003]). The values were within 1% of the previously published values for a plain mixed bilayer. shows that the lipid order parameter did not change significantly between the plain bilayer and the peptide/bilayer system. These results show that the cavity introduced by the wholesale deletion of lipids in bad contact with the peptide did not disrupt the overall integrity of the bilayer structure.
Figure 7. Order parameters of oleoyl chains in model A. (a) the deuterium order parameters calculated for the top leaflet of the membrane, which contained ARF. (b) the lower leaflet, which was unperturbed from the pre-equilibrated bilayer. As can be seen, no significant changes in order parameters occurred as a result of peptide insertion.
Conclusions
Although tremendous advances have been made in molecular dynamics simulations of proteins and lipid bilayers, typically such simulations are qualified by uncertainties in the initial conditions. Reaching both energetic and structural equilibrium in such large systems poses a difficult computation problem. Without data to support the choice of initial conditions, only a small number of possible initial states can be reasonably tested. The need for combining experimental techniques, which provide data on the Ångstrom length or picosecond time scales, with MD simulations is clear (Kamath & Wong [Citation2002]). Our neutron diffraction data provides directly verifiable length scale data, not previously used in such simulations.
The difficulty is compounded when one considers that for the enormous variety of bilayer simulations with different sizes, ensembles, and force fields, nearly all simulations of pure bilayers yield reasonable results (Scott [Citation2002]). This is most likely due to the fact that all force fields contain atomic interaction parameters that mimic the hydrophobic effect quite well. When combined with the confinement of the simulation box it is perhaps not surprising that the structural integrity of the bilayer is maintained, at least over short simulation times.
We can see a related problem in the simulations of models B and D; although obviously incorrect in comparison to models A and C, they reached an equilibrium state very quickly and showed no signs of changing in 4 ns of simulation time. Had we not known at the beginning that A and C were, mutually exclusive choices based on the data, (B and D were mathematically optional orientations), there was no a priori reason to reject the simulations of B and D. This is directly relevant to simulations that study proteins at membrane interfaces. Such simulations may not yield clues as to whether there are better orientations of the protein within the membrane. One can argue that transmembrane helices or ion channels studied using MD might not fall into this category as the protein in question spans the membrane, hence the depth of the protein in relation to the membrane is no longer an issue.
In this paper, we have demonstrated that the information gained from structural experiments can be used to generate starting structures for explicit atomic level studies with molecular dynamics simulations. To conclude, we have shown that MD simulation is a powerful tool for exploring experimental data to atomic resolution. However, the starting position of a peptide in relation to a membrane is crucial to the interpretation of the data. The analysis and comparison of the four models lead to the confirmation of our original choice of model A, as the correct conformation of ARF1p in relation to the bilayer.
This paper was first published online on prEview on 23 September 2005.
References
- Amor JC, Harrison DH, Kahn RA, Ringe D. Structure of the human ADP-ribosylation factor 1 complexed with GDP. Nature 1994; 372: 704–708
- Antonny B, Beraud D, Chardin P, Chabre M. N-terminal hydrophobic residues of the G-protein ADP-ribosylation factor-1 insert into membrane phospholipids upon GDP to GTP exchange. Biochemistry 1997; 36: 4675–4684
- Balali-Mood, K, Harroun, TA, Bradshaw, JP. 2003. Molecular dynamics simulation of a mixed DOPC/DOPG bilayer. Eur Phys J E, 12:s136–140. (E-direct)
- Basyn F, Charloteaux B, Thomas A, Brasseur R. Prediction of membrane protein orientation in lipid bilayers: A theoretical approach. J Mol Graph Model 2001; 20: 235–244
- Basyn F, Spies B, Bouffioux O, Thomas A, Brasseur R. Insertion of X-ray structures of proteins in membranes. J Mol Graph Mod 2003; 22: 11–21
- Bechor D, Ben-Tal N. Implicit solvent model studies of the interactions of the influenza hemagglutinin fusion peptide with lipid bilayers. Biophys J 2001; 80: 643–655
- Berger O, Edholm O, Jahnig F. Molecular dynamics simulations of a fluid bilayer of dipalmitoylphosphatidylcholine at full hydration, constant pressure, and constant temperature. Biophys J 1997; 72: 2002–2013
- Berneche S, Nina M, Roux B. Molecular dynamics simulation of mellittin in a dimyristoylphosphatidylcholine bilayer membrane. Biophys J 1998; 75: 1603–1618
- Bradshaw JP, Darkes MJ, Harroun TA, Katsaras J, Epand RM. Oblique membrane insertion of viral fusion peptide probed by neutron diffraction. Biochemistry 2000; 39: 6581–6585
- Collins RN. Rab and ARF GTPase regulation of exocytosis. Mol Membr Biol 2003; 20: 105–115
- Cormont M, Le Marchand-Brustel Y. The role of small G-proteins in the regulation of glucose transport. Mol Membr Biol 2001; 18: 213–220
- Davies SM, Harroun TA, Hauss T, Kelly SM, Bradshaw JP. The membrane bound N-terminal domain of human adenosine diphosphate ribosylation factor-1 (ARF1). FEBS Lett 2003; 548: 119–124
- Feller SE, Yin D, Pastor RW, MacKerell AD, Jr. Molecular dynamics simulation of unsaturated lipid bilayers at low hydration: Parameterization and comparison with diffraction studies. Biophys J 1997; 73: 2269–2279
- Forrest LR, Kukol A, Arkin IT, Tieleman DP, Sansom MSP. Exploring models of the influenza A M2 channel: MD simulations in a phospholipid bilayer. Biophys J 2000; 78: 55–69
- Franco M, Chardin P, Chabre M, Paris S. Myristoylation is not required for GTP-dependent binding of ADP-ribosylation factor ARF1 to phospholipids. J Biol Chem 1993; 268: 24531–24534
- Goldberg J. Structural and functional analysis of the ARF1-ARFGAP complex reveals a role for coatomer in GTP hydrolysis. Cell 1999; 96: 893–902
- Kamath S, Wong TC. Membrane structure of the human immunodeficiency virus gp41 fusion domain by molecular dynamics simulation. Biophys J 2002; 83: 135–143
- Kessel A, Musafia B, Ben-Tal N. Continuum solvent model studies of the interactions of an anticonvulsant drug with a lipid bilayer. Biophys J 2001; 80: 2536–2545
- Lindahl E, Hess B, van der Spoel D. GROMACS 3.0: A package for molecular simulations and trajectory analysis. J Mol Model 2001; 7: 306–317
- Lins, L, Charloteaux, B, Thomas, A, Brasseur, R. 2001. Computational study of lipid-destabilizing protein fragments: Towards a comprehensive view of tilted peptides proteins.Struc Func Genetics, 44:435–447.
- Marrink SJ, Mark AE. Molecular view of hexagonal phase formation in phospholipids membranes. Biophys J 2004; 87: 3894–3900
- Mashl R J, Scott HL, Subramaniam S, Jakobsson E. Molecular simulation of dioleoylphosphatidylcholine lipid bilayers at differing levels of hydration. Biophys J 2001; 81: 3005–3015
- Menetrey J, Macia E, Pasqualato S, Franco M, Cherfils J. Structure of Arf6-GDPsuggests a basis for guanine nucleotide exchange factors specificity. Nat Struct Biol 2000; 7: 466–469
- Moore PB, Lopez CF, Klein ML. Dynamical properties of a hydrated lipid bilayer from a multinanosecond molecular dynamics simulation. Biophys J 2001; 81: 2484–2494
- Nielsen, SO, Ensing, B, Oritz, V, Moore, PB, Klein, ML. 2005. Lipid bilayer perturbations around a transmembrane nanotube: A coarse grain molecular dynamics study. Biophys J, 88:3822–3828.
- Nina M, Berneche S, Roux B. Anchoring of a monotopic membrane protein: The binding of prostaglandin H2 synthase-1 to the surface of a phospholipid bilayer. Eur Biophys J 2000; 29: 439–454
- Randa HS, Forrest LA, Voth GA, Sansom MSP. Molecular dynamics of synthetic leucine-serine ion channels in a phospholipid membrane. Biophys J 2001; 77: 2400–2410
- Randazzo PA, Nie Z, Miura K, Hsu VW. Molecular aspects of the cellular activities of ADP-ribosylation factors. Sci Stke 2000; 1: 59–64
- Sansom MSP, Tieleman DP, Forrest LR, Berendsen HJ. Molecular dynamics simulations of membranes with embedded proteins and peptides: Porin, alamethicin and influenza virus M2. Biochem Soc Trans 1998; 26: 438–443
- Scott HL. Modelling the lipid component of membranes. Curr Opin Struct Biol 2002; 12: 495–502
- Spang, A. 2002. ARF1 regulatory factors and COPI vesicle formation. Curr Opin Cell Biol. 14:423–4
- Tieleman DP, Berendsen HJC, Sansom MSP. Surface binding of alamethicin stabilizes its helical structure: Molecular dynamics simulations. Biophys J 1999; 76: 3186–3191
- Tieleman DP, Breed J, Berendsen HJC, Sansom MSP. Alamethicin channels in a membrane: Molecular dynamics simulations. Faraday Discuss 1998; 1: 209–223