Abstract
The structural and dynamic properties of the oxoglutarate carrier were investigated by introducing a single tryptophan in the Trp-devoid carrier in position 184, 190 or 199 and by monitoring the fluorescence spectra in the presence and absence of the substrate oxoglutarate. In the absence of substrate, the emission maxima of Arg190Trp, Cys184Trp and Leu199Trp are centered at 342, 345 and 348 nm, respectively, indicating that these residues have an increasing degree of solvent exposure. The emission intensity of the Arg190Trp and Cys184Trp mutants is higher than that of Leu199Trp. Addition of substrate increases the emission intensity of Leu199Trp, but not that of Cys184Trp and Arg190Trp. A 3D model of the oxoglutarate carrier was built using the structure of the ADP/ATP carrier as a template and was validated with the experimental results available in the literature. The model identifies Lys122 as the most likely candidate for the quenching of Trp199. Consistently, the double mutant Lys122Ala-Leu199Trp exhibits a higher emission intensity than Leu199Trp and does not display further fluorescence enhancement in response to substrate addition. Substitution of Lys122 with Cys and evaluation of its reactivity with a sulphydryl reagent in the presence and absence of substrate confirms that residue 122 is masked by the substrate, likely through a substrate-induced conformational change.
| Abbreviations | ||
| MCF | = | mitochondrial carrier family |
| MCS | = | Mitochondrial Carrier Signature |
| OGC | = | oxoglutarate carrier |
| TM | = | transmembrane |
| TMS | = | transmembrane segment |
| SDSL | = | site directed spin-labeling |
| MTSES | = | sodium(2-sulfonatoethyl)methane thiosulfonate |
| AAC | = | ADP/ATP carrier |
| DM | = | dodecyl-β-D-maltoside |
| RMSD | = | root mean square deviation |
Introduction
The specific transport of various essential metabolites across the inner mitochondrial membrane is mediated by nuclear encoded transporters of the mitochondrial carrier family (MCF). These carriers share some common features, such as a tripartite structure made up of 3 tandemly repeated sequences of about 100 amino acids in length, the presence of six α helical transmembrane segments, a conserved PX(D/E)XX(K/R)X(K/R) sequence, called the Mitochondrial Carrier Signature (MCS) motif located at the C-terminal end of the odd transmembrane helices, and a conserved glycine located at the N-terminal end of the even transmembrane helices (Palmieri [Citation1994]). More than 20 human carriers have been identified so far and several of them have been characterized in their transport and kinetic properties, following heterologous expression and reconstitution into liposomes (Palmieri [Citation2004]). An important contribution to the description of their structural characteristics has been provided by EM studies on two dimensional crystals of the yeast ADP/ATP carrier (AAC) (Kunji & Harding [Citation2003]) and by the elucidation of the 3D structure of the bovine AAC crystallized in one of its defined conformations in complex with the inhibitor carboxyatractyloside (Pebay-Peyroula et al. [Citation2003]).
Among the members of the MCF the oxoglutarate carrier (OGC), also known as the oxoglutarate/malate carrier, has been the subject of systematic work aimed at understanding its structural and functional properties (Stipani et al. [Citation2001] and references therein). This carrier was the first eukaryotic membrane protein to be expressed in Escherichia coli and refolded in a reconstitutively active state (Fiermonte et al. [Citation1993]). This allowed further studies, which include Cys-scanning mutagenesis of transmembrane segment IV (TMS IV) that identified the residues lining the water accessible translocation path of the carrier (Stipani et al. [Citation2001]), and site directed spin-labeling (SDSL) that demonstrated the helical character of TMS IV, its amphipathicity and the relative mobility of its different parts (Morozzo della Rocca et al. [Citation2003]). More recently, NMR spectroscopy has been used to determine the structure of the predicted TMS I, II, V and VI and part of their flanking hydrophilic residues, which showed well-defined α-helical regions (Castiglione-Morelli et al. [Citation2004], Castiglione-Morelli et al. [Citation2005]). Although these results have extended our knowledge of the OGC toward the molecular level, the mechanism of oxoglutarate translocation through this transport protein is not yet entirely understood. A full description of this transport process requires the knowledge of the 3D structure of the carrier and of the conformational changes allowing the selective passage of the specific substrate.
In order to gain information in this direction we engineered the Cys-less OGC (Stipani et al. [Citation2001]) by substituting the two native tryptophans (Trp181 and Trp279) with Tyr and inserting a single tryptophan into the Cys-less and Trp-less OGC protein at position 184, 190 or 199. The environments of the tryptophans inserted in the transport protein were monitored by fluorescence spectroscopy in the presence and absence of oxoglutarate. The results were interpreted in the light of the homology model of the OGC based on the available X-ray structure of the ADP/ATP carrier. They indicate the occurrence of substrate-induced conformational changes that alter the interaction between Trp199 and Lys122.
Materials and methods
Prediction of the transmembrane regions
Membrane helices of the oxoglutarate carrier were predicted with the program ENSEMBLE, consisting of three different machine learning approaches, namely a cascade neural network (NN), and two different hidden Markov models (HMM). The methods and their ensemble were trained and tested in cross validation on 59 well resolved membrane proteins. ENSEMBLE scores with a per-protein accuracy of 90% and 71% for topography and topology, respectively (Martelli et al. [Citation2003]). The comparative model building was performed with the MODELLER program (Sali & Blundell [Citation1993]). For a given alignment, ten model structures were built and evaluated with the PROCHECK/PROSAII suite of programs (Laskowski et al. [Citation1993]). Only the best evaluated model was retained after the analysis. Close contacts were removed with the DEBUMP program of the WHATIF package (Vriend [Citation1990]).
Overexpression and purification of OGC mutants
The Cys-less OGC was obtained by replacing the three native cysteines (184, 221 and 224) with serine residues using the OGC cDNA fragment (Runswick et al. [Citation1990]) as template as described (Stipani et al. [Citation2001]). The Cys-less OGC cDNA was then employed as template to generate the Lys122Cys and the Trp-less mutant by replacing the two native tryptophans (Trp181 and Trp279) with tyrosine residues. Mutants Cys184Trp, Arg190Trp and Leu199Trp were obtained using the Cys-less Trp-less OGC cDNA as template, and the double mutant Lys122Ala-Leu199Trp was obtained from the Leu199Trp mutant OGC cDNA. All mutations were introduced by the overlap extension PCR method (Ho et al. [Citation1989]) using oligonucleotides carrying appropriate mutations in their sequences. The PCR products were cloned into the expression vector pMW7. Transformants in E. coli DH5α cells were selected on ampicillin (100 µg/ml) and screened by direct colony PCR and restriction digestion of plasmids. The sequences of the inserts were verified.
The overproduction of Cys-less OGC and OGC mutants as inclusion bodies in the bacterial cytosol was accomplished as previously described (Fiermonte et al. [Citation1993]), except that the host cells were E. coli C0214(DE3) (Stipani et al. [Citation2001]). The inclusion bodies were purified by sucrose layer density gradient centrifugation (Fiermonte et al. [Citation1993]) and resuspended in TE buffer (10 mM Tris and 1 mM EDTA, pH 7.0). SDS-PAGE and electroelution of Cys-less OGC or OGC mutants were performed as previously described (Morozzo della Rocca et al. [Citation2003]). The eluted samples were concentrated using Centricon-30 tubes, and the TGS buffer (25 mM Tris, 192 mM glycine and 0.1% (w/v) SDS) was extensively exchanged with DM buffer (0.17 mM dodecyl-β-D-maltoside, 1 mM EDTA and 10 mM Tris-HCl, pH 7.1) in the same tubes repetitively flooded with excess DM buffer for about 36 h (Morozzo della Rocca et al. [Citation2003]).
Reconstitution of Cys-less OGC and OGC mutants into liposomes and transport measurements
The recombinant proteins in detergent were diluted 10-fold with a buffer containing 2 mM Pipes, pH 7.0, 0.6% (w/v) Triton X-114, and 0.2 mM EDTA and reconstituted into liposomes in the presence of 20 mM oxoglutarate, as described previously (Palmieri et al. [Citation1995]). The external substrate was removed from proteoliposomes on Sephadex G-75 columns. Transport at 25°C was started by adding [14C]oxoglutarate to eluted proteoliposomes and terminated after 30 sec (initial rate) or 90 min (steady-state) by the addition of 20 mM pyridoxal 5′-phosphate and 16 mM bathophenanthroline. In controls, the inhibitors were added at the beginning together with the labeled substrate. Finally, the external substrate was removed from quenched samples on Dowex AG1-X8, and the radioactivity in the liposomes was measured (Palmieri et al. [Citation1995]). The experimental values were corrected by subtracting control values, and the transport activities were calculated by taking into account the efficiency of reconstitution (i.e., the share of successfully incorporated protein).
Fluorescence and CD spectra
Fluorescence spectra of OGC mutants in detergent solution were acquired on a ISS-K2 spectrofluorometer (ISS) equipped with a tungsten bulb as the light source and two grating monochromators. The sample was held in quartz cuvettes at 25.0±0.1°C under gentle stirring by a magnet. Slit width in the excitation and emission monochromator were both 4 nm. Excitation was carried out at 295 nm in order to excite selectively tryptophans. Emission spectra were recorded from 300 to 450 nm, with a typical scan speed of 60 nm/min. Buffer emission was measured each time and subtracted. Protein samples in DM buffer were used at a 20 micromolar concentration. Oxoglutarate titration was made by adding aliquots of a freshly prepared 2 mM solution of oxoglutarate in appropriate buffer. The same was done in the case of citrate. The samples were mixed and allowed to equilibrate prior to the next spectra acquisition. Stability was checked before proceeding to the next aliquot.
In order to correct the spectrum for the inner filter effect exerted by oxoglutarate, a correction function was built by carrying out measurements in which two external cuvettes were used, in addition to the central one that contained a standard solution of the water soluble tryptophan analogue NATA (N-acetyl tryptophanamide), were added. The first cuvette was placed in the excitation path and the second on the emission path. Oxoglutarate was added in the external cuvettes and the spectra were compared to those of NATA. In the case of citrate no correction was necessary since this compound does not absorb at the wavelengths of interest.
The fluorescence intensity maxima, F, as a function of the added substrate were analyzed in terms of relative difference from initial values, F0, as (F-F0)/F0. The resulting intensity curves were fitted using a single binding site model with the GraphPad Prism Software.
CD spectra were acquired on a Jasco-J11 spectropolarimeter. Quartz cuvettes of 0.1 cm optical paths were used as sample holders. Samples were thermostatted at 25.0±0.2°C. Spectra were taken at 20 nm/min scan speed, 2 s integration time, over the 200–250 nm range. Four spectra were accumulated and averaged. Sample optical density at 280 nm was OD = 0.22. Background buffer spectra were acquired and subtracted.
Results and discussion
Activity and spectroscopic analysis of single Trp mutants
Previous studies on TMS IV showed that this helix is involved in the translocation of the substrate and that its N- and C-terminal parts have different packing, with a breakpoint occurring at the crucial residue Arg190 (Morozzo della Rocca et al. [Citation2003]). On this basis we inserted a single Trp in the Trp-less protein at position 184, 199 or 190, i.e., at the extremities and the central region of helix IV. These positions were chosen because of their location at different heights of helix IV, allowing us to monitor different regions of this helix.
The tryptophan-less mutant (Trp-less) and the three single tryptophan mutants of OGC (Cys184Trp, Arg190Trp and Leu199Trp) were over-expressed, purified and reconstituted into liposomes. The Cys184Trp mutant displays a steady-state level of oxoglutarate transport of 9.2±1.1 µmol/mg protein, a value which is comparable to those of the native OGC protein and the Cys-less, Trp-less mutant. The steady-state level of oxoglutarate transport of the Trp199 replacement mutant is lower but still appreciable (4.8±0.5 µmol/mg protein). In contrast, mutation of Arg190 to Trp completely abolishes the transport activity of the carrier. Arg190 has previously been found to be essential for transport (Stipani et al. [Citation2001]) and the loss of activity upon its substitution has been attributed to the absence of the positive charge and not to misfolding of the mutant.
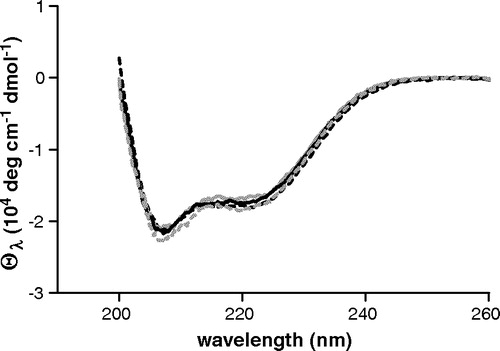
Consistently, the CD spectrum of the single Arg190Trp mutant dissolved in dodecyl-β-D-maltoside (DM) buffer is identical to that of the Cys-less OGC as well as to those of the Cys184Trp and Leu199Trp mutants, indicating that the protein maintains a qualitatively similar secondary structure ().
Figure 1. UV Circular dichroism spectra of Cys-less and single tryptophan mutants. Cys-less: black dashed line; Cys184Trp: grey dashed line; Arg190Trp: black solid line; Leu199Trp: grey solid line. Protein concentration is 8 µM in DM buffer, pH = 7.1.
The fluorescence spectra of the three single tryptophan mutants in DM buffer are reported in . The emission maxima of Arg190Trp, Cys184Trp and Leu199Trp are centered at 342, 345 and 348 nm, respectively, giving evidence that they have an increasing degree of solvent exposure. The spectra are also characterized by different emission intensities, each tryptophan being quenched differently because of its specific chemical microenvironment. In particular, Arg190Trp and Cys184Trp display an emission intensity which is higher than that of Leu199Trp.
Figure 2. Panel A: Fluorescence spectra of single tryptophan OGC mutants in detergent solubilized form. Cys184Trp: grey dashed line; Arg190Trp: black solid line; Leu199Trp: grey solid line. Excitation wavelength is 295 nm. Protein concentration is 20 µM in DM buffer, pH = 7.1. Panel B: Percentage of the peak fluorescence emission intensities as a function of added compound concentration. Solid symbols represent titration with oxoglutarate. Triangles: Cys184Trp; wedges: Arg190Trp; squares: Leu199Trp. Data for non specific binding in the presence of citrate are shown for Leu199Trp mutant in open diamonds. The curves represent the fit of the experimental data considering a one-site binding model.
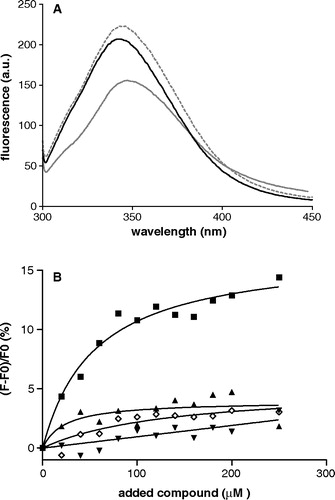
The three Trp-modified carriers were titrated with oxoglutarate in order to monitor possible conformational changes due to substrate binding. The spectra of Cys184Trp and Arg190Trp do not show a significant difference with and without substrate. Instead, titration of Leu199Trp with oxoglutarate causes an increase in the fluorescence intensity without shifting its emission frequency. shows the percentage of the fluorescence intensity variation as a function of oxoglutarate concentration. These data allow the evaluation of a dissociation constant of about 50 µM, a value which is in good agreement with the half-saturation constant of oxoglutarate previously determined for the OGC purified from mitochondria or for the wild-type or Cys-less OGC expressed in E. coli (Fiermonte et al. [Citation1993], Stipani et al., [Citation2001]). Titration of Leu199Trp with citrate, a compound that is not transported by the carrier, induces no significant fluorescence change (), indicating that the effect seen with oxoglutarate is a consequence of specific binding. The static fluorescence anisotropy measured before and after addition of the substrate does not show any significant difference for all three mutants. Its value is quite low (r=0.08±0.005), suggesting that Trp has a large degree of motional freedom both in the presence and absence of substrate and thus excluding a direct interaction between the indole group and the substrate (Lakowicz [Citation1999]). Moreover, the unchanged emission frequency shows that the tryptophan is sensing a similar hydrophilic environment both with and without oxoglutarate.
Taken all together, these results suggest that the most likely explanation for the observed increase in fluorescence intensity of Leu199Trp, caused by the addition of oxoglutarate, is due to the removal or partial screening of quenchers from tryptophan 199.
Molecular modelling
A 3D model of the OGC was built in order to identify the amino acid residue that quenches the fluorescence intensity of Trp199 and restores it in the presence of substrate.
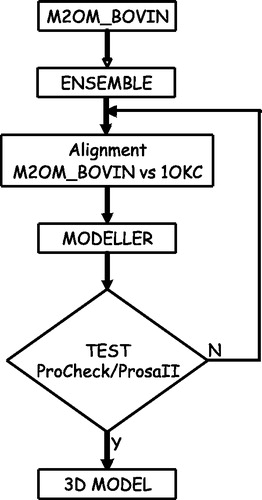
Modelling of M2OM_BOVIN starts with the prediction of the transmembrane regions of the target sequence with ENSEMBLE, which is specifically suited to predict the topology of membrane proteins (). ENSEMBLE is a combination of three different predictors, including a neural network and two hidden Markov models, and has been trained on the atomic solved structures of 59 TM chains taken from the PDB data base (Martelli et al. [Citation2003]). ENSEMBLE is trained and tested with multiple profile sequence alignments and its prediction generalizes over phylogenetically linked sequences (Martelli et al. [Citation2003]). For these reasons, ENSEMBLE locates TM helices from the N to the C helix cap, and does not simply identify the lipid-embedded region. The result of the prediction shows that the protein is inserted into the lipid bilayer with six alpha helices, similarly to what was proposed (Bisaccia et al. [Citation1994]) and was more recently reported for the ADP/ATP carrier (Pebay-Peyroula et al. [Citation2003]).
Figure 3. Flow chart of our modelling procedure. The transmembrane topology of the bovine oxoglutarate carrier (M2OM_BOVIN) is predicted with ENSEMBLE. The output is then aligned in an expert-driven way with the template sequence (bovine AAC), constraining the transmembrane helical positions and the conserved sequence motifs, as explained in the text. For each given alignment a set of ten 3D models is built by threading the sequence onto the template structure. Each new model is evaluated with the PROCHECK/PROSAII suite and only the best evaluated models are retained for further minimization and removal of conflicting positions.
The question then arises as to whether the ADP/ATP carrier can be used as a template for modelling the 3D structure of the target sequence. Sequence alignment indicates that the two sequences are only 20% identical, and this would prevent any possible application of building by homology unless a good alignment is pre-determined between the target and the template, by constraining known conserved regions. In our case, the results of the TM prediction indicate that the target sequence is endowed with the same number of helices as the mitochondrial ADP/ATP carrier: the alignment of the target to the template can be expert-driven in order to constrain conserved transmembrane regions and other conserved sequence motifs such as MCS, present in the odd numbered transmembrane helices, and the glycine residues conserved at the N-terminus of the even numbered ones (). An additional constraint is that gaps, if they occur, are confined to the loop regions. A repetitive procedure can be used to insert the gaps into different positions of the loop regions and different models can be computed ().
Figure 4. Sequence alignment of OGC and AAC, indicated with M2OM and 1OKC, respectively. The alignment emphasizes the threefold repeated sequence, and secondary structure is highlighted in bold and labeled on top, following Pebay-Peyroula et al. ([Citation2003]). Conserved motifs are also pointed out.
![Figure 4. Sequence alignment of OGC and AAC, indicated with M2OM and 1OKC, respectively. The alignment emphasizes the threefold repeated sequence, and secondary structure is highlighted in bold and labeled on top, following Pebay-Peyroula et al. ([Citation2003]). Conserved motifs are also pointed out.](/cms/asset/f993767f-beab-42ff-b607-24e78d726eeb/imbc_a_126916_f0004_b.jpg)
For each alignment a 3D structure of the target based on that of the template was computed. All the optimal models are within 0.15 nm RMSD, as measured on their C-α atoms, the main differences being localized in the loops connecting the alpha helices. The iterative procedure depicted in allows us to optimize the computed model according to the different alignments that can be produced. The final 3D model is then structurally aligned with the template as shown in . The corresponding 3D model, spanning residues Pro16-Met303, is represented in .
Figure 5. Panel A: The 3D model of OGC depicted with RasMol. Transmembrane and matrix exposed helices are colour-coded and the limiting residues are highlighted on the right in the same colours. Panel B: Superposition of the three structural repeats of the OGC model. The threefold repeat alignment is shown at the bottom with helical motifs. MCF motifs and conserved glycines are highlighted in red. RMSD of the C-α traces is ≤ 2 Å.
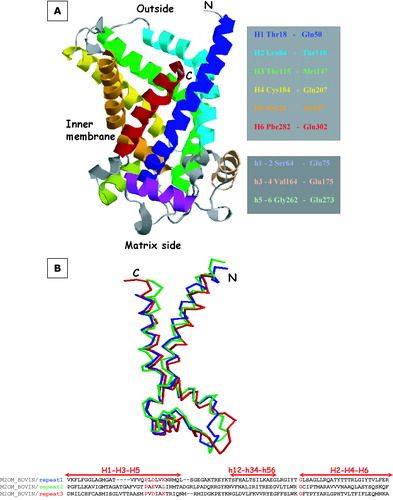
In the following section key features of the model are described. The threefold repetitive primary structure is reflected in the tertiary structure and the folds of the three repeats are very similar as shown by the RMSD of their C-α trace, that is less than 2 Å (). The three-fold repeated MCS motif is strongly conserved among the two proteins; in particular, the prolines are fully conserved and impose a sharp kink on the odd numbered helices. The negative charged residues (Glu29, Asp134 and Asp231) and the positive charge residues (Lys32, Arg137 and Arg234) of the AAC, that are located on the kinked regions of the odd numbered transmembrane helices, are all maintained by conservative substitutions in the OGC (Asp43, Glu141 and Asp241; Lys46 and Lys244), with the exception of Leu144 that substitutes Arg137 (). These residues are supposed to be involved in a number of charge pair interactions among themselves and with charged residues located in the transmembrane helices (Nelson et al. [Citation1998]).
The overall distribution of hydrophobic residues is conserved in the two carriers, ensuring a suitable location of the hydrophobic surface facing the lipid part of the membrane. All the hydrophilic residues that are located on the transmembrane helices look towards the water accessible crevice. In particular, the four transmembrane positively charged residues found in the AAC are spatially conserved in the OGC model, despite their different substrate. Three of them are fully conserved (Arg90, Arg190 and Arg288 in OGC, Arg79, Arg187 and Arg279 in AAC), while the fourth is located in different transmembrane helices (Arg98 in H2 in OGC and Lys22 in H1 in AAC), although facing the internal channel at a comparable height in both carriers.
The cationic cluster composed of seven positively charged residues, found at the bottom of the deep AAC crevice (Pebay-Peyroula et al. [Citation2003]), is only partially present in the OGC model, where only four charged residues (Arg90, Arg288, Lys244, Lys46) make up this cluster. Also the two matrix-facing cationic patches in AAC represented by Arg139, Lys162, Lys165 and by Arg236, Arg243, Arg258, Lys259 are only partially found in OGC, being represented by Arg146, Arg170, Gln173 and by Arg246, “Met252”, “Val268”, Lys269, respectively.
Comparison of the model with the available data
The 3D model of OGC has been validated by comparing it with the data coming from the systematic results obtained by Cys-scanning mutagenesis of transmembrane H4 starting from a functionally active OGC protein devoid of Cys residues (Cys-less carrier) (Stipani et al. [Citation2001]).
Single Cys-replacement of Gly183, Arg190, Gln198 and Tyr202 in H4 results in loss of transport function (Stipani et al. [Citation2001]). In the OGC model all these residues are lined up in the pore-facing side of the helix. Mutation of Gly183, the strongly conserved N-terminal glycine of helix 4, to Thr or Val abolishes activity while mutation to Ala retains significant activity (63%) (Stipani et al. [Citation2001]), indicating the crucial role of the size of this residue. Gly183 is in fact in contact with residues belonging to helix 5 at approximately the same height (with respect to the membrane normal) of the kink in helix 3. In this position there is close packing of transmembrane helices 4, 5 and helix h56 in the matrix. Therefore, any increase in the residue 183 side-chain size results in perturbation of the packing and/or interaction with TM helix 5 and/or h56, thus explaining the decrease in activity exhibited by the various Gly183 mutants.
Arg190 is one of the four charged residues predicted to reside in the transmembrane region of the carrier in the topological model proposed by Bisaccia et al. ([Citation1994]). Neutralization of Arg190 leads to the abolition of transport activity (Stipani et al. [Citation2001]). This residue in the 3D model is localized in the middle of the channel, in a crucial position to attract and/or interact with the negatively charged transported substrate.
Mutation of Gln198 to either Ala, Asn, Phe, Lys or Glu fully inactivates the carrier (Stipani et al. [Citation2001]) indicating that this residue has a crucial role in the transport activity. In the model, this residue protrudes into the pore, thus providing an explanation for previous EPR data which shows that this residue is highly accessible to hydrophilic compounds (Morozzo della Rocca et al. [Citation2003]). The model shows that the lateral chain of Gln198 is oriented towards the neighbouring TM helix 5 forming an interface with Ser229 and Thr233. Such an interaction is in agreement with the reduced mobility of the modified side chain observed in EPR experiments (Morozzo della Rocca et al. [Citation2003]) and suggests that these contacts could be important for function.
The Tyr202Cys mutant is virtually inactive, and the substitutions of Tyr with Phe, Thr, Ala or Val are not tolerated (Stipani et al. [Citation2001]). Therefore, the Tyr hydroxyl at position 202 is essential, probably being required for H-bonding, and it cannot be replaced by the thiol group of Cys or the hydroxyl group of Thr (Stipani et al. [Citation2001]). In the model, Tyr202 is at the top (at the C-terminal end, cytoplasmic side) of helix 4 and its side chain points towards the pore. It is located in the same position as AAC's Tyr194, a position occupied by tyrosine in the repeats of many carriers (Jezek & Jezek [Citation2003]).
Single mutations in Cys of Val194, Asn195, Leu199 or Ser203 exhibit a diminished initial rate of oxoglutarate transport (between 18% and 33% of the C-less OGC) but a substantial steady-state level (between 40% and 100% of the C-less OGC) (Stipani et al. [Citation2001]). In the model Asn195, Leu199 and Ser203 are located at the interface between helix 4 and helix 3, and Val194 at the interface between helix 4 and helix 5, suggesting that these inter-helix contacts are relevant for the transport process or the stability of the α-helical bundle. The occurrence of these helix-helix interactions is also consistent with EPR data (not available for Ser203) showing that Val194Cys, Asn195Cys and Leu199Cys have a reduced degree of mobility and accessibility (Morozzo della Rocca et al. [Citation2003]). Therefore, the mutated interfacial cysteines could hamper the helical movements, which may be essential for the conformational changes accomplishing transport, or may interfere with the structural integrity of the bundle.
The functional and EPR data obtained on single mutants of helix 4 are thus consistent with the model of helix 4 and its interactions with the other helices in the structure.
Lys122 is the quencher of Trp199
Inspection of the 3D model of OGC indicates that the charged residue closest to the side chain of Trp199 is Lys122. Positively charged residues are excellent quenchers of the indole group (Chen & Barkley [Citation1998]).
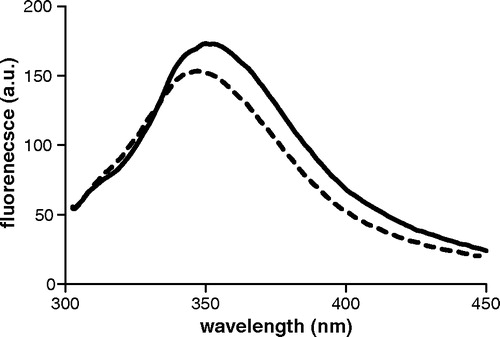
Therefore, Lys122, which is 3 Å distant from Leu199Trp and is located at the N-terminus of H3 with its side chain facing the pore (), may be responsible for the lower emission intensity of the Leu199Trp mutant as compared to Cys184Trp and Arg190Trp. It is interesting that oxoglutarate induces a fluorescence intensity enhancement of Trp199 (B), indicating that the environment of Trp199 is modified and suggesting that Lys122 is masked by the substrate through a direct interaction or a substrate-induced conformational change. To test this hypothesis, a double mutant having Lys122 mutated to Ala and Leu199 to Trp (referred to as Lys122Ala-Leu199Trp) was prepared and characterized. When reconstituted into liposomes, this mutant displays a significant steady-state level of transport activity (about 2.5 µmol/mg protein). The fluorescence spectrum of the double mutant is reported in together with that of Leu199Trp. Although the spectrum of the double mutant is slightly red-shifted, it also has a higher quantum yield as compared to the single mutant, confirming that Lys122 quenches the fluorescence of Trp199.
Figure 6. 3D view of Trp199 and Lys122 in the OGC model. The protein is seen from the cytoplasmic side and secondary structure elements are shown in cartoons. The two selected residues are depicted in sticks and their molecular surface is outlined in white. This figure is reproduced in colour in Molecular Membrane Biology online.
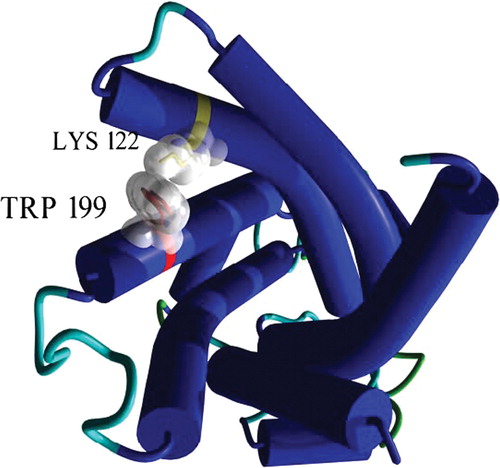
Figure 7. Fluorescence spectra of Lys122Ala-Leu199Trp and Leu199Trp mutants are plotted as solid and dashed lines respectively. Excitation wavelength is 295 nm. Protein concentration is 20 µM in DM buffer, pH = 7.1.
Titration of the double mutant with oxoglutarate up to 0.25 mM shows no difference in the emission intensity (data not shown). These results can be explained either by a lack of binding of oxoglutarate to the double mutant or by a lack of quenching due to the absence of the positively charged Lys122 residue. We prefer the latter explanation since the double mutant retains a relatively good transport rate, which implies that oxoglutarate binding sites remain intact in the carrier.
In order to investigate whether Lys122 may be masked by oxoglutarate, a single mutant of the Cys-less OGC having residue 122 mutated to cysteine was produced. The reconstituted Lys122Cys mutant exhibits a good level of steady-state transport activity, corresponding to 90% of that of the Cys-less OGC. The mutant is very sensitive to the action of MTSES, since incubation of the protein reconstituted into liposomes with 2.5 µM MTSES results in a considerable loss of activity to about 20% of the control (). However, if oxoglutarate is present during the incubation of the proteoliposomes with MTSES, the activity is restored to about 60% of the control value (), demonstrating that oxoglutarate protects cysteine 122 against reaction with MTSES.
Figure 8. Influence of substrate on the inhibition of mutant Lys122Cys by MTSES. Proteoliposomes were preincubated for 10 min with 2.5 µM MTSES, in the presence (black bar) or absence (grey bar) of 0.2 mM oxoglutarate. Transport was initiated by adding 3 mM [14C] oxoglutarate and terminated after 1 min. Results are expressed as percent residual activity with respect to the control value without inhibitor. The data represent means±SD of four independent experiments in duplicate.
![Figure 8. Influence of substrate on the inhibition of mutant Lys122Cys by MTSES. Proteoliposomes were preincubated for 10 min with 2.5 µM MTSES, in the presence (black bar) or absence (grey bar) of 0.2 mM oxoglutarate. Transport was initiated by adding 3 mM [14C] oxoglutarate and terminated after 1 min. Results are expressed as percent residual activity with respect to the control value without inhibitor. The data represent means±SD of four independent experiments in duplicate.](/cms/asset/b6e86724-cfa7-42f1-93bc-56a04a7c4747/imbc_a_126916_f0008_b.jpg)
These results show that the accessibility and/or the reactivity of residue 122 is strongly reduced in the presence of the substrate. This may be due to a direct contact with oxoglutarate or to a substrate-induced conformational change that masks residue 122, probably increasing the distance between residues 122 and 199. Therefore, Leu199 and Lys122 sense substrate binding, most likely through a substrate-induced conformational change that screens Trp199 from Lys122. As a matter of fact, docking studies with the substrate in the OGC carrier indicate that oxoglutarate does not interact with Lys122 but may induce a conformational change masking residue 122 (data not shown).
In conclusion, fluorescence measurements of single tryptophan-containing mutants of OGC and the analysis of substrate protection against chemical modification of Lys122Cys, together with the development of a high quality homology model of OGC, have enabled us to identify residues involved in substrate-induced conformational changes of this transporter. The availability of a 3D model and the combined use of multiple spectroscopic and functional approaches should in the near future make it possible to obtain additional information leading to an understanding of the oxoglutarate transport mechanism through the OGC protein.
This paper was first published online on prEview on 13 October 2005.
This work was supported by grants from MIUR-PRIN, Italian Ministry of Health, FISR project on Functional Genomics, CEGBA, FIRB, Biosapiens (UE) and by the EC contract LSHM-CT-2004-503116. We thank Dr A. Di Venere and Dr G. Mei for their help with the fluorescence measurements.
Related Research Data
References
- Bisaccia F, Capobianco L, Brandolin G, Palmieri F. Transmembrane topography of the mitochondrial oxoglutarate carrier assessed by peptide-specific antibodies and enzymatic cleavage. Biochemistry 1994; 33: 3705–3713
- Castiglione-Morelli MA, Ostuni A, Pepe A, Lauria G, Palmieri F, Bisaccia F. Solution structure of the first and second transmembrane segments of the mitochondrial oxoglutarate carrier. Mol Membr Biol 2004; 21: 297–305
- Castiglione-Morelli MA, Ostuni A, Croce F, Palmieri F, Bisaccia F. Solution structure of the fifth and sixth transmembrane segments of the mitochondrial oxoglutarate carrier. Mol Membr Biol 2005; 22: 191–201
- Chen Y, Barkley MD. Toward understanding tryptophan fluorescence in proteins. Biochemistry 1998; 37: 9976–9982
- Fiermonte G, Walker JE, Palmieri F. Abundant bacterial expression and reconstitution of an intrinsic membrane-transport protein from bovine mitochondria. Biochem J 1993; 294: 293–299
- Ho SN, Hunt HD, Horton RM, Pullen JK, Pease LR. Site-directed mutagenesis by overlap extension using the polymerase chain reaction. Gene 1989; 77: 51–59
- Jezek P, Jezek J. Sequence anatomy of mitochondrial anion carriers. FEBS Lett 2003; 534: 15–25
- Kunji ER, Harding M. Projection structure of the atractyloside-inhibited mitochondrial ADP/ATP carrier of Saccharomyces cerevisiae. J Biol Chem 2003; 278: 36985–36988
- Lakowicz J. Principles of fluorescence spectroscopy. Kluwer Academic and Plenum Publishers, New York 1999
- Laskowski RA, MacArthur MW, Moss DS, Thornton JM. PROCHECK: A program to check the stereochemical quality of protein structures. J Appl Cryst 1993; 26: 283–291
- Martelli PL, Fariselli P, Casadio R. An ENSEMBLE machine learning approach for the prediction of all-alpha membrane proteins. Bioinformatics 2003; 19(Suppl. 1)i205–211
- Morozzo della Rocca B, Lauria G, Venerini F, Palmieri L, Polizio F, Capobianco L, Stipani V, Pedersen J, Cappello AR, Desideri A, Palmieri F. The mitochondrial oxoglutarate carrier: structural and dynamic properties of transmembrane segment IV studied by site-directed spin labeling. Biochemistry 2003; 42: 5493–5499
- Nelson DR, Felix CM, Swanson JM. Highly conserved charge-pair networks in the mitochondrial carrier family. J Mol Biol 1998; 277: 285–308
- Palmieri F. Mitochondrial carrier proteins. FEBS Lett 1994; 346: 48–54
- Palmieri F. The mitochondrial transporter family (SLC25): physiological and pathological implications. Pflugers Arch – Eur J Physiol 2004; 447: 689–709
- Palmieri F, Indiveri C, Bisaccia F, Iacobazzi V. Mitochondrial metabolite carrier proteins: purification reconstitution and transport studies. Methods Enzymol 1995; 260: 349–369
- Pebay-Peyroula E, Dahout-Gonzalez C, Kahn R, Trezeguet V, Lauquin GJ, Brandolin G. Structure of mitochondrial ADP/ATP carrier in complex with carboxyatractyloside. Nature 2003; 426: 39–44
- Runswick MJ, Walker JE, Bisaccia F, Iacobazzi V, Palmieri F. Sequence of the bovine 2-oxoglutarate/malate carrier protein: Structural relationship to other mitochondrial transport proteins. Biochemistry 1990; 29: 11033–11040
- Sali A, Blundell TL. Comparative protein modelling by satisfaction of spatial restraints. J Mol Biol 1993; 234: 779–815
- Stipani V, Cappello AR, Daddabbo L, Natuzzi D, Miniero DV, Stipani I, Palmieri F. The mitochondrial oxoglutarate carrier: Cysteine-scanning mutagenesis of transmembrane domain IV and sensitivity of Cys mutants to sulfhydryl reagents. Biochemistry 2001; 40: 15805–15810
- Vriend G. WHAT IF: a molecular modelling and drug design program. J Mol Graph 1990; 8: 52–56