Abstract
To understand the formation and properties of ceramide-enriched domains in cell membranes, the biophysical properties of the binary system palmitoyloleoylphosphatidylcholine (POPC)/palmitoylceramide were thoroughly characterized. Diverse fluorescent probes and parameters were necessary to unravel the complexity of this apparently simple system. For the first time, a complete phase diagram is reported, characterizing the lamellar phases of these mixtures, and providing a quantitative framework integrating biophysical and biological studies. The diagram suggests that in resting cells no ceramide domains exist, but upon apoptotic stimuli, platforms may form. Moreover, our data show that 2 mol% of Cer strongly affects the POPC fluid matrix, suggesting that a small increase in Cer levels can significantly affect cell membrane properties. In this work, we also show that Cer domains, formed in conditions similar to physiological, are extremely ordered and rigid. The domains composition is estimated from the phase diagram and their large size was concluded from fluorescence resonance energy transfer. Dynamic light scattering and electron microscopy were used to characterize the system morphology, which is highly dependent on ceramide content and includes vesiculation and tubular structure formation.
Introduction
In the last decade Ceramide (Cer) has emerged as an important signaling molecule in the regulation of several cellular processes such as differentiation, senescence, proliferation, cell cycle arrest and apoptosis. Numerous studies show that Cer production in response to external stress stimuli is a nearly universal feature of programmed cell death (for reviews see Citation[1], Citation[2]). This lipid can be generated within a cell either by de novo synthesis pathway (slow process for Cer production) or by hydrolysis of sphingomyelin (SM) in the cell surface, leading to rapid accumulation of Cer in the membrane. Both pathways were shown to be involved in Cer generation in response to stress stimuli Citation[3]. Several targets for Cer action as a second messenger have been identified, namely Cer-activated protein kinase, cathepsin D and protein phosphatases Citation[4]. The mechanisms of stress-signaling cascades activation by Cer are still not clear. However, evidences is emerging for an indirect action of Cer, resulting from the alterations of the biophysical properties of the plasma membrane Citation[5], Citation[6]. Increase in Cer levels has also been implicated in the modulation of endocytic pathways, vesicle aggregation, membrane vesiculation, fusion/fission, membrane permeabilization and vesicular trafficking Citation[6], Citation[7]. Recently it was shown that hydrolysis of SM in lipid monolayers drives spontaneous nucleation and circular growth of Cer-enriched domains Citation[8]. It was also suggested that SM hydrolysis within lipid rafts leads to the fusion of small rafts into large platforms. Membrane rafts and Cer platforms were shown to have a key role in the internalization of virus and parasites and to induce apoptosis of the host cell upon infection (reviewed by Citation[9]). Stress signaling cascades are probably modulated indirectly by Cer-enriched platforms, which would serve as sorting devices that lead to the aggregation and/or exclusion of receptors, proteins or other signaling molecules into/from the rafts Citation[9].
To understand the role of Cer in signal initiation and lipid second-messenger formation from rafts, it is necessary to systematically characterize the changes that occur at the plasma membrane upon increase in Cer level. Relevant aspects, such as minimum Cer concentration needed to form microdomains and/or platforms, rigidity/order of the membrane and size of the domains, are not yet elucidated. The understanding of how the properties of a fluid membrane change upon Cer incorporation is crucial for the interpretation of data arising from both biological and biophysical studies. Furthermore, establishing a relation between physiological Cer levels and a measurable structuring effect on the membrane (e.g., order parameters) will help clarifying whether cellular events are dependent or not on this lipid.
In order to address these aspects, we selected a binary system and systematically studied the effect of increasing amounts of palmitoylceramide on the properties of 1-palmitoyl-2-oleoyl-sn-glycero-3-phosphocoline (POPC) bilayers, an unsaturated phospholipid common in many natural membranes Citation[10]. This methodology is the only one that allows the correct interpretation of the complex thermotropic behavior of Cer and is the basis for the understanding of more complex systems involving these lipids. The complete description of the POPC/Cer lamellar phases was possible because a multi-probe, multi-parameter approach was applied, progressively unraveling the complexity of the system, by exploiting the temperature and composition dependence of fluorescence spectra, anisotropy and fluorescence lifetime of trans-parinaric acid (t-PnA), diphenylhexatriene (DPH) and N-nitrobenz-2-oxadiazo-4-yl-dioleoylphosphatidylethanolamine (NBD). Using complementary biophysical techniques (dynamic light scattering (DLS), fluorescence resonance energy transfer (FRET) and transmission electron microscopy (TEM)), a global picture of the effects (macro and microscopic) that Cer exerts on a fluid membrane was drawn for the first time. Our data clearly show that an increase in Cer content leads to extensive alterations in the biophysical properties of the whole membrane and among other effects may drive the formation of large Cer platforms.
Materials and methods
Chemicals
POPC, palmitoylceramide (Cer) and NBD were obtained from Avanti Polar Lipids (Alabaster, AL). DPH and t-PnA were from Molecular Probes (Leiden, The Netherlands). All organic solvents were UVASOL grade from Merck.
Liposome preparation
Unless otherwise stated, multilamellar vesicles (MLV) (total lipid concentration 0.1 mM) were used. MLV containing the adequate lipids and DPH and NBD when used were prepared by standard procedures Citation[11]. The suspension medium was sodium phosphate 10mM, NaCl 150mM, EDTA 0.1mM buffer (pH 7.4). The samples were re-equilibrated by freeze-thaw cycles and incubation at T > 90°C. For studies with t-PnA, samples were slowly brought to room temperature and the probe was then added from an ethanol stock solution (final ethanol volume always less than 1%, preventing bilayer destabilization Citation[12]). The samples were re-equilibrated again by freeze-thaw cycles and subsequently kept overnight at 4°C. Before starting the measurements, the samples were slowly heated to the required temperature and incubated for 1 h. The probe/lipid ratios used were 1:200 for DPH, 1:500 for t-PnA and 1:1000 for NBD.
Concentration of the POPC and Cer stock solutions was determined gravimetrically with a high precision balance (Mettler Toledo UMT2). POPC concentration was also checked by phosphorus analysis Citation[13] and the results agreed with the previous method. Probe concentrations were determined spectrophotometrically using ε(t-PnA, 299.4 nm, ethanol) = 89×103 M−1cm−1Citation[14], ε(DPH, 355 nm, chloroform) = 80.6×10³ M−1cm−1Citation[15], ε(NBD, 458 nm, chloroform) = 21×103 M−1cm−1Citation[16].
Absorption and fluorescence
All measurements were performed in 0.5 cm×0.5 cm quartz cuvettes and under magnetic stirring. The absorption and steady-state fluorescence instrumentation was previously described Citation[17]. The absorption spectra were corrected for turbidity. For steady-state fluorescence measurements the excitation and emission wavelengths were: λexc=358 nm and λem=430 nm for DPH, λexc=303 nm and λem=405 nm for t-PnA and λexc=465 nm and λem=536 nm for NBD. The temperature was achieved by a Julabo F25 circulating water bath and controlled with 0.1°C precision directly inside the cuvette with a PT100. For measurements performed at different temperatures, the heating rate was always below 0.2°C/min.
The time-resolved fluorescence measurements with DPH were performed using 340 nm as the excitation wavelength (secondary laser of DCM) and collecting the emission at 430 nm; for t-PnA the excitation and emission wavelengths were 295 nm (laser of Rhodamine 6G) and 405 nm, respectively Citation[18]. NBD was excited at 428 nm (Ti-Sapphire laser, Citation[19]) and the emission was collected at 536 nm. The data was analyzed as previously described Citation[17].
Dynamic light-scattering
For DLS measurements, a standard multiangle laser light scattering apparatus from Brookhaven Instruments Inc. (USA), model 2030AT was used. Data analysis was carried out as previously described; all the material used in the experiments was treated to remove dust particles Citation[20]. The samples were prepared with buffer previously filtered through 0.2 µm cellulose nitrate membranes (MFS, Dublin, CA).
Transmission electron microscopy
TEM was carried out using a Jeol (Tokyo, Japan) Electron Microscope 100SX, operated at 60 kV. Samples were placed over copper grids, covered with carbon membrane. Negative staining was performed with uranyl acetate 1% in water. Total lipid concentration of the mixtures was varied (ranging from 0.1 mM to 0.5 mM) giving essentially the same results.
FRET experiments
To avoid multilayer geometry, FRET experiments were carried out in large unilamellar vesicles (LUV) (1 mM total lipid concentration), obtained from MLV by the extrusion technique Citation[11]. t-PnA and NBD were used as donor-acceptor pair at a probe to lipid ratio of 1/1000 and 1/130, respectively. Data analysis was carried out as described by Citation[19] (see Appendix for detailed information on the model). Because t-PnA cromophore is located near the bilayer centre and NBD in the membrane surface, only out-of-plane energy transfer occurs. The equation describing donor decay in the presence of acceptor is similar to Eq A6 in Citation[19], but considering out-of-plane transfer for two leaflets, instead of in-plane and out-of-plane transfer.
Results
Formation of Cer rich gel domains and ordering of the fluid bilayer
A shows the fluorescence anisotropy of t-PnA, DPH and NBD as a function of Cer mole fraction (XCer) at 24°C. t-PnA anisotropy presents a sharp increase with XCer, reaching a plateau for XCer>0.20. The high anisotropy values show that the probe is strongly immobilized, evidencing the formation of a gel phase. For XCer>80mol%, t-PnA anisotropy strongly decreases indicating that the probe is in a disordered environment. As will be clear later, this is due to an exclusion of t-PnA from the lipid phase, which becomes even more rigid, and not due to a decrease of the average order of the bilayer.
Figure 1. Cer effects on a fluid membrane detected by different probes. (A) Steady-state fluorescence anisotropy of t-PnA (•), DPH (⋄) and NBD (▴) as a function of membrane composition at 24°C. (B) Effect of temperature on t-PnA anisotropy as a function of composition: 24°C (•), 37°C (○) and 65°C (![]()
In contrast to t-PnA, DPH shows only a slight increase in the anisotropy with Cer content (up to 30% Cer). The measured values are not typical of a gel-phase (e.g., 0.3 in POPC/SM, Citation[18]), showing that this probe is excluded from Cer gel phase, as previously suggested in the literature Citation[21]. For very high Cer content it was not possible to measure DPH anisotropy due to the low fluorescence signal, leading to high variability between measurements. This probably results from DPH segregation into the aqueous environment. Considering that DPH is only reporting the properties of the POPC rich fluid phase, the slight increase in anisotropy upon Cer incorporation, reflects the ability of this lipid to enhance the acyl chain packing of POPC, in agreement with the suggestion by Hsueh et al. Citation[22]. It is important to note that a trend of variation of the parameters with clearly distinct regimes and abrupt changes in slope (as observed for t-PnA) is necessary to assure that phase separation is occurring and not just a change in the global order of the bilayer without phase coexistence/domain formation.
A different behavior was observed for NBD, which senses only the changes undergone on the bilayer surface, being unable to report the increase in the order of POPC acyl chains. As a result, NBD anisotropy remains very low for all Cer contents.
From the different behavior observed for each of the three probes, it is shown that t-PnA is suitable to report the properties of the Cer enriched phase, since its anisotropy is very sensitive to the presence of this lipid, even in small amounts (note that 2 mol% of Cer is already able to induce a significant increase in the probe anisotropy).
As would be expected, the formation of Cer gel domains is dependent not only on the lipid content, but also on the temperature (B). At 37°C, the raise in t-PnA anisotropy is also very steep, and the values are again typical of gel, clearly showing that Cer is inducing phase separation. At higher temperatures (65°C; B), t-PnA anisotropy is much less dependent on Cer content, suggesting that both Cer and POPC are in the fluid phase, and no gel domains are formed.
It was also observed that, the mean fluorescence lifetime of t-PnA sharply increases with XCer (), confirming the formation of Cer rich gel domains. This data further indicates that the domains are so rigid that the increase in anisotropy due to an increase of the rotational correlation times compensates for the raise in the probe fluorescence lifetime [see e.g., Citation[23]].
Figure 2. Mean fluorescence lifetime of the probes as a function of Cer mole fraction.t-PnA (•), DPH (⋄) and NBD (▴), at 24°C; and DPH (♦) at 37°C. Dotted lines are merely guides to the eye.
It should also be stressed that the longer mean fluorescence lifetimes obtained for t-PnA are typical of gel phase Citation[24]. It can be concluded that, in addition to the ability of t-PnA to incorporate the Cer-rich gel phase, the probe strongly prefers that phase, as reported for its interaction with other gel-containing lipid systems Citation[24]. In fact, a partition coefficient, Kp, of 1 would lead to an approximately linear variation of the fluorescence parameters with XCer, a preference for the Cer poor phase to a downward curvature, and a preference for the Cer-rich phase to an upward curvature; the steeper the curvature, the stronger the preference Citation[18]. The photophysical parameters of t-PnA as a function of XCer display a strong upward curvature, showing unequivocally the strong preference of this probe for the Cer-rich phase. For very high Cer content, the mean fluorescence lifetime strongly decreases, reflecting again a transition in which the probe changes from a highly ordered to a highly disordered environment (see discussion).
On the other hand, the mean fluorescence lifetime of both DPH and NBD are independent of XCer and similar to the one obtained for t-PnA in the fluid phase (). These results confirm the hypothesis that DPH is excluded from the Cer rich gel phase, reporting only the properties of the fluid.
Thermotropic behavior of POPC/Cer mixtures
To investigate the thermotropic properties of the binary POPC/Cer mixtures (ranging from pure POPC to pure Cer), the anisotropy of the probes was measured as a function of temperature. For pure POPC (A) the trend of variation and the anisotropy values were similar for all probes. The main-transition temperature (Tm) of POPC is (−2.9±1.3)°C Citation[25], so the observed anisotropy decrease is not reporting a phase transition, but only a gradual increase of membrane fluidity with temperature, once the membrane is fluid at all temperatures. For all the mixtures studied, the trend of variation of DPH anisotropy was similar to the one obtained with pure POPC, as exemplified in B and C for 20 and 50 mol% of Cer respectively, thus also reporting only changes in fluid phase.
Figure 3. Thermotropic behavior of POPC/Cer mixtures. Steady-state fluorescence anisotropy of t-PnA (•), DPH (⋄) and NBD (▴) as a function of temperature in MLV composed of (A) pure POPC and pure Cer (▵, using NBD as a probe); and POPC/Cer mixtures containing (B) 20 and (C) 50 mol% Cer. (D) Determination of fluid + gel-to-fluid phase boundary. Steady-state fluorescence anisotropy of t-PnA as a function of temperature in MLV composed of pure POPC (•) and POPC/Cer binary mixtures containing 2 (○), 8 (—), 12 (⋄) and 60 (×) mol% of Cer. The lines are only guides to the eye.
t-PnA, a probe which was shown here to partition preferentially to Cer domains, exhibited a completely different behavior (B, C and D): while in POPC (A) t-PnA anisotropy decreased with temperature without abrupt changes, for POPC/Cer mixtures anisotropy variation clearly indicates a phase transition. Below Tm, the anisotropy is very high, after which a steep decrease occurs towards a limiting value and identical to the one observed for pure, fluid POPC. These results, together with both the high Tm of Cer (∼90–93°C, Citation[26], Citation[27]) and the photophysical properties of t-PnA (mean fluorescence lifetime and anisotropy), reveal that this transition corresponds to the conversion from a gel to a fluid phase. Up to 50mol% of Cer Tm is shifted towards higher values, with increasing Cer. For higher XCer, the transition occurs always at ∼60°C (as exemplified in D for 60 mol% of Cer). Also important are the significant changes that 2 mol% of Cer are able to induce in the thermotropic behavior of the predominant fluid POPC lipid matrix (D). The properties of the whole bilayer are affected by the presence of a very small amount of Cer, close to the physiological concentrations of this lipid Citation[28].
It should also be noted that t-PnA and DPH have the particularity of presenting identical mean fluorescence lifetimes () and anisotropy (A) in POPC. Therefore, direct comparison of the properties of the two probes is possible and additional information regarding the nature of the POPC/Cer mixtures can be obtained. In B and C, the anisotropy change with temperature for DPH and t-PnA (as well as for NBD, see below) is presented for POPC/Cer 80:20 and 50:50 mol%, respectively. It is shown that below the phase transition t-PnA anisotropy is high and only slightly decreases, reporting a gel phase region, while DPH, which is excluded from Cer domains, presents a variation characteristic of the fluid POPC. Above the transition, a drop in t-PnA anisotropy is observed towards a limit value identical to DPH and thus, characteristic of the POPC-rich fluid phase. These observations are consistent for all the mixtures studied.
Regarding NBD, for mixtures up to 50 mol% of Cer (exemplified in B for 20% Cer), the anisotropy trend of variation and values are independent of XCer, and equal to POPC (A). However, for higher XCer, an increase in anisotropy is observed for temperatures above 55–65°C (A and C, for pure Cer and 50% Cer, respectively). Shah et al. Citation[26] previously reported that fully hydrated Cer presents complex polymorphic phase behavior with a solid-solid transition detected by the appearance of an exothermic peak between 55–70°C in the DSC scan, which corresponds to a transition from a gel- to a more ordered gel-phase. Our results with NBD are also suggesting that a transition to a more ordered gel phase, where the probe in the headgroup is significantly affected, is occurring in that range of temperatures for pure Cer and mixtures with high XCer. When two fluid phases (liquid disordered and liquid ordered) are present, NBD prefers the more ordered phase Citation[19] due to the orientation of the dipole moment of the NBD group Citation[29]. By analogy, when the transition occurs from a gel phase to a more ordered gel-phase, NBD is able to partition into the latter one, reporting its formation.
Altogether, the data here presented allow the determination of the complete binary phase diagram POPC/Cer.
Cer-induced membrane morphological alterations
Cer is very apolar and thus weakly hydrated Citation[6]. To check if the changes in the fluorescence properties of the probes are related to Cer crystal formation, TEM experiments were performed. This technique was chosen because sub mM total lipid concentration could be used and Cer-induced morphological changes can be appreciated. In (and Supplementary ) TEM micrographs are shown for different POPC/Cer compositions. Up to 10 mol% of Cer, only vesicles with a mean diameter of ∼100 nm are observed. As Cer concentration is increased, the vesicles increase in size, tend to aggregate and show morphological alterations that drive vesiculation. For XCer>50% cylindrical structures can be observed. These structures have round extremities, and correspond to a membranous formation. Crystalline structures are only observed above 92%. While POPC is still present, crystals present a large number of defects as compared to those observed for pure Cer. From the point where crystals are formed on (L7, ), the aqueous milieu has to be taken into account, i.e., the total lipid concentration is critical, and results from different biophysical studies have to be compared carefully.
Figure 4. POPC/Cer binary phase diagram and Cer-induced morphological alterations. The full lines are experimentally determined and have quantitative accuracy. The dotted lines (except L7) are the best estimates based on thermodynamic rules, photophysical parameters of the probes and TEM micrographs. The line L7 is based on the t-PnA excitation spectra, and the TEM observations, and is independent of the rest of the diagram. The gray dashed-dotted line is taken from [22]. Abbreviations correspond to: F – fluid phase; G1 – POPC-rich gel phase; G2 – Cer-rich gel phase; G3 – highly ordered Cer-rich gel phase. See text for other details. TEM micrographs correspond to the following compositions: 20 (A), 70 (B), 92 (C) and 100 (D) mol% Cer.
![Figure 4. POPC/Cer binary phase diagram and Cer-induced morphological alterations. The full lines are experimentally determined and have quantitative accuracy. The dotted lines (except L7) are the best estimates based on thermodynamic rules, photophysical parameters of the probes and TEM micrographs. The line L7 is based on the t-PnA excitation spectra, and the TEM observations, and is independent of the rest of the diagram. The gray dashed-dotted line is taken from [22]. Abbreviations correspond to: F – fluid phase; G1 – POPC-rich gel phase; G2 – Cer-rich gel phase; G3 – highly ordered Cer-rich gel phase. See text for other details. TEM micrographs correspond to the following compositions: 20 (A), 70 (B), 92 (C) and 100 (D) mol% Cer.](/cms/asset/29dbe6c6-cbfa-4ee6-80a6-53437555a91d/imbc_a_143930_f0004_b.gif)
The size and shape of the particles was also monitored by DLS and further compared with TEM results (Supplementary ). At room temperature, the size only slightly increased with Cer up to 10% (ranging from ∼110 to 150nm), which is in agreement with TEM data determination ( and Supplementary Figure S1A). For mixtures up to 20% Cer, it was still possible to estimate the size of the particles which are in the range of 1–2 µm, as also observed by TEM. For higher Cer concentration the polydispersity sharply increased, preventing accurate size determination. According to TEM, for higher Cer concentration, vesicle aggregation and tubular structure formation are taking place. These phenomena largely contribute to polydispersity increase.
Cer-domain size
In order to estimate the size of Cer domains, FRET experiments were carried out using donor and acceptor probes with different lipid phase-preferences: t-PnA (donor) partitions to the gel, while NBD (acceptor) partitions to fluid; FRET efficiency is dependent on the separation distance between donor and acceptor. As a result, it will decrease when gel domains form and the extent of the decrease is related to the size of the domains. From , where FRET efficiency is plotted as a function of gel fraction, XG, can be concluded that big Cer platforms are being formed since FRET efficiency drops almost to 0% when XG is increased.
Figure 5. Cer platform formation. Variation of FRET efficiency, E, for the donor/acceptor pair t-PnA/NBD, as a function of gel-phase mole fraction in the F + G2 coexistence region along the tie-line at 24°C of the phase diagram in . The black dashed-dotted line corresponds to a value of E calculated for a random distribution of donor and acceptor molecules in the pure fluid phase. The gray dotted line is merely a guide to the eye.
Discussion
POPC/Cer mixtures require a multi-probe approach
It is known that Cer is able to promote phase separation in phosphatidylcholine (PC) bilayers, namely in the unsaturated, fluid POPC Citation[30], Citation[22]. Several approaches, including fluorescence experiments using DPH anisotropy Citation[30], were employed to study the ability of Cer to induce domain formation. However, a recent study Citation[21] reported that DPH might be in fact excluded from the Cer domains. Such suggestion can render this probe unsuitable to describe the properties of Cer rich domains. Regarding this point, we employed three probes with different lipid-phase related properties: t-PnA which partitions preferentially to gel phases Citation[24]; DPH, which is expected to distribute equally between phases Citation[31]; and NBD, a phospholipid with unsaturated acyl chains and the fluorescent label in the headgroup, preferring fluid rather than gel lipid phases Citation[31]. This multi-probe approach enabled us to gain more information on the system and select the probes that best report the properties of each phase. Comparing the behavior of the probes, we can conclude that while t-PnA partitions to Cer-gel domains and thus is able to follow Cer domain formation and report its properties, DPH is excluded from these domains, in agreement with Citation[21]. Moreover, regarding that usually Kp∼1 for DPH in a typical gel-fluid separation, the Cer rich gel domains should be highly ordered and compact, in order to exclude the probe. As a consequence, DPH reports only the properties of the fluid POPC phase, and the increase in its anisotropy values are showing that Cer is able to increase the order of the phospholipid acyl chains. This is interesting from the biological point of view since it means that the localized formation of Cer in the membrane can also affect the properties of the more fluid membrane domains, suggesting a long range effect.
POPC/Cer binary phase diagram
Due to the strong preference of t-PnA for the gel-phase, the anisotropy variation as a function of temperature of this probe can not be used to determine the solidus phase boundary of the diagram, i.e., the gel-to-gel + fluid transition temperature. From those data the gel + fluid-to-fluid transition (liquidus boundary, F + G2-to-F) can be taken. The corresponding points are represented in (closed circles, line L1). For POPC and Cer the Tm was taken from Citation[18] and Citation[27], respectively. Pure Cer further presents a solid-solid transition from gel to a highly ordered gel (G3, ) Citation[26], which was sensed by NBD anisotropy (A). The experimental data were corrected for the intrinsic transition width of the pure lipids Citation[18], Citation[32]. For low Cer content, our data is in very good agreement with the NMR study by Citation[22]. The transition detected by t-PnA for XCer>50%, occurs always at ∼60°C, giving rise to a horizontal line in the diagram (L1). Above this temperature and also for XCer>50%, NBD detects the solid-solid transition, i.e., the formation of G3. So, there should be a line connecting liquidus line (L1) at 50% Cer to the main transition of pure Cer (L2, ). Bellow this line there will be coexistence between fluid- and the more ordered gel-phase of Cer (F + G3).
To draw the lower part of the diagram, t-PnA data were again used. Both the anisotropy (B) and mean fluorescence lifetime () of the probe strongly decreased for XCer>80%. The changes in probe fluorescence are related to a phase change. For thermodynamic consistency of the diagram, this should be a single Cer-rich gel phase (G2). To draw the line that separates the Cer gel (G2) from the region of gel-fluid coexistence (F + G2) (L3), the points at which the anisotropy and mean fluorescence lifetime of t-PnA start to decrease were used (open circles). The line was drawn until interception with the boundary that defines the coexistence (G1 + G2) between POPC (-rich) gel (G1) and Cer (-rich) gel (G2). This boundary was taken from Citation[22], where it is assumed that these two lipids are immiscible in gel phase, a valid assumption for lipids with a large difference between their Tm values.
If a decrease in t-PnA fluorescence parameters is associated with a transition to a Cer-gel phase, then above 60°C and 80% Cer (B shows a decrease in t-PnA anisotropy in this conditions) it should exist a transition to that phase. According to the thermodynamic rules, both below and above a horizontal line two-phases should be present. Consequently, two areas of phase coexistence exist above the horizontal line: (i) F + G3 coexistence (introduced above) and, (ii) a small region of Cer-gel + highly ordered-gel coexistence (G2 + G3). These regions are connected at only one point (80% Cer), where the three phases are present, and separated by a region where only highly ordered gel (G3) exists. The binary phase diagram for POPC/Cer mixtures is of the peritectic type Citation[33]: with an isothermal (peritectic) line (at ∼60°C, L1 from 50 to 100% Cer) representing univariant equilibrium, and a peritectic point (at 80% Cer, point P) for 3-phase equilibrium. It should be possible to determine the shape of the F + G3-to-F boundary (L2). In fact, if G3 is detected by an increase in the anisotropy of NBD, this boundary should correspond to a temperature at which the anisotropy ceases to increase. Due to experimental limitations, it is not possible to draw the line with very high accuracy (to draw attention to this fact, the line is dashed), as it occurs at very high temperatures. However, once that the ceasing in NBD anisotropy increase was not observed, it can be surely affirmed that the transition occurs at or above the temperatures reached in the experiments, i.e., that the concavity of the curve is very pronounced. Similarly, the boundary that separates F + G3 from G3 (L5) is also dashed because arises from thermodynamic restrictions and is only an estimate. However, this part of the diagram is not so relevant because it is very far from the physiological conditions (very high T and XCer) and does not interfere with the other regions of the diagram.
This diagram is the simplest that can be drawn with our experimental data and in agreement with the thermodynamic rules and data from the literature.
Biophysical significance of the phase diagram
A thorough study of the properties of the probes as a function of both composition and temperature was undoubtedly required to determine the complete POPC/Cer phase diagram. Only a partial phase diagram for this mixture was presented in the literature up to this moment Citation[22]. The authors were able to determine the diagram up to 15% Cer, since higher Cer concentration led to the appearance of a solid component on the NMR spectra, in addition to the fluid and gel phases already present.
Although the cellular level of Cer is usually very low (1–2% Citation[28]), in cells undergoing apoptosis its level is increased, reaching as high as 10% of total phospholipid Citation[3]. Additionally, it is usually generated through SM hydrolysis, which is mostly located at lipid rafts. Even though Cer presents a fast flip-flop rate and lateral diffusion Citation[34], its local concentrations can be very high. In this way, it is essential to define which changes are occurring in the membrane in the presence of higher amounts of Cer.
POPC/Cer diagram presents a liquidus line (L1) with a shape similar to other gel/fluid binary lipid phase diagrams Citation[10], predicting that for example, at 37°C phase separation begins at XCer∼8%, and that this is the composition of the fluid phase in the coexistence range at that temperature, whereas it is of XCer∼2% at 20°C. The solubility of Cer in the fluid is thus higher at 37°C. As a consequence, Cer has a stronger effect on the fluid phospholipid matrix at the physiological temperature than at 20°C. This interesting effect is reflected in the unusual behavior of the probe DPH that presents a slightly longer mean fluorescence lifetime at 37°C ().
According to Shah et al. Citation[26], fully hydrated Cer exists in a highly ordered lamellar bilayer gel phase, both above and bellow the solid-solid transition. The bilayer periodicity and the chain packing are the main differences between the solid phases. t-PnA strongly prefers gel phases and its quantum yield sharply increases when incorporated into them. However, this is not the case for the highly ordered gel (G3). Moreover, for very high XCer, the strong decrease of the photophysical parameters of t-PnA cannot be due to the formation of a disordered phase. In fact, when XCer is increased in F + G2 region, i.e., along a tie-line, only the fraction of gel is augmenting, while the composition of each phase remains unchanged. When the solidus boundary is reached (L3, ), the single gel phase present becomes more enriched in Cer (its composition is the same as the lipid composition of the system). Consequently, this gel phase is becoming more ordered and compact, expelling t-PnA to the aqueous medium. This suggestion is further corroborated by the strong alterations observed on the probe excitation spectra when 100% of gel is attained: the typical tetraene vibrational progression of t-PnA is affected (Supplementary ) and a new band appears at ca. 292 nm. The specific case where only a single band at higher energies appears is evidencing that the two dipoles are stacked side-by-side (H type of aggregate), as expected for the fatty acid micelles in water Citation[24]. The order of the acyl chains inside the micelle is low, thus the low fluorescence lifetime and anisotropy.
To assure that the fluorescence parameters of the probes were only reporting transitions between lamellar phases, TEM experiments were performed. Crystalline structures are only observed above 92% Cer. However, crystal formation should not interfere with the diagram since it occurs only after 100% gel is attained. Nevertheless, the boundary separating F + G2 coexistence from G2 (L3, ) is close to the appearance of Cer crystal (L7), and this could quantitatively compromise the accuracy of the solidus line (L3). It should be stressed that this boundary is essential to correctly determine fluid and gel fractions. To test the quantitative accuracy of L3, the lever rule was applied to the binary phase diagram in order to determine the fraction of gel (XG) and fluid (XF) phases for each mixture. This calculation is necessary to determine Kp values (Citation[19] for more details). For t-PnA a Kp=4.5±0.6 was obtained. This value is in good agreement with the one determined for this probe in other gel-fluid systems (e.g., Kp=4±1 in POPC/ PDPC mixture, Citation[24]), showing once again the strong preference for the gel-phase. Moreover, the quantitative similarity between the Kp values suggests that the lamellar phases are quantitatively characterized with good accuracy in the phase diagram here presented.
It is often considered that Cer is able to drive the formation of big domains/platforms Citation[9]. However, direct evidence of the size of the domains is still missing. A suitable technique to accomplish this goal is FRET, but to obtain information about the size of lipid domains, it is necessary to have the phase diagram previously determined, because FRET efficiency, E, should be plotted as a function of phase mole fraction Citation[19]. The efficiency is dependent on the separation distance between donor (t-PnA) and acceptor (NBD). Since the probes partition to different phases, E will decrease when gel domains form and the extent of the decrease is related to the size of the domains. From , where FRET efficiency is plotted as a function of XG (G2), several conclusions arise: (i) for the situation where only fluid phase is present (XG=0, no gel-fluid coexistence) donors and acceptors distribute randomly in the membrane, resulting in an experimental efficiency that agrees with the expected value for a random situation (see appendix from Citation[19] for detailed information); (ii) increasing XG, the efficiency strongly decreases reporting that gel domains are forming; (iii) the efficiency drops almost to 0% showing that big platforms are being formed. For this donor-acceptor pair, the critical distance for energy transfer, R0, in gel phase is ∼31Å. The platforms are surely larger than ∼20R0=60 nm, i.e., they are at least larger than most of lipid rafts estimates by methods not involving cross-linking or detergent addition (see discussion in Citation[19]); iv) for very high XG, the system is approaching the limit of only one gel-phase. In this situation, donor and acceptors will distribute through this phase, leading to an increase in FRET efficiency.
Biological implications and conclusions
Although physiological levels of Cer are relatively low in cells, more and more studies are emerging in the literature showing that Cer raises several-fold upon an apoptotic stimulus Citation[1], Citation[4]. Methodologies to determine precisely Cer content and distribution are still poorly developed and thus only qualitative and/or relative variations can be appreciated. As a consequence, relations between biological observations and biophysical membrane properties are compromised and can only be interpreted recurring to phase diagrams. Only the complete diagram allows the characterization of the composition of the system, and is crucial to understand how the properties of the membranes are modulated by Cer. Even for the low Cer concentration regime, the extent, composition and properties of gel domains can only be accurately described knowing the global diagram.
The present study highlights the complexity of Cer containing lipid systems, and the importance of a full characterization of POPC/Cer behavior as a step necessary towards the understanding of more complex systems. Taking this binary mixture as a starting point, future methodologies for characterizing lipid composition in specific cellular compartments avoiding current difficulties, like contamination between organelles and activation of lipases concomitant with cell disruption, might be based on the measurement of different photophysical parameters of sets of probes with well characterized lipid-phase properties.
Several remarkable aspects emerged from this study, namely the ability of low Cer amounts (in the physiological range) to order the fluid lipids, the high tendency to phase separate leading to platform formation and the extreme rigidity of such platforms. These characteristics have a probable role in the modulation of several cellular processes, such as activation of stress signaling cascades. Modification in the conformation of proteins involved in stress signaling can occur as a consequence of the extensive alteration of membrane properties, leading either to their activation or inhibition Citation[2]. Furthermore, due to its highly ordered nature, Cer gel domains might be a key element in cellular sorting Citation[35], Citation[36], promoting the partition and/or exclusion of proteins and other molecules involved in cellular processes from these regions, as suggested by Gulbins et al. Citation[9].
When Cer is originated locally, especially by hydrolysis of SM in the rafts (e.g., as observed in B-lymphoma cells Citation[37]), particular caution should be taken since high local concentrations can drive vesiculation or the formation of tubular structures. These morphological changes together with the ability of Cer to rapidly diffuse between the two membrane leaflets Citation[34] can be on the basis of budding/fusion processes; blebbing; and morphological changes in the mitochondrial membrane. Additionally, sorting mechanisms are highly dependent on molecular shape Citation[35] which in turn is intimately related to lipid phase separation Citation[38]. The tendency of Cer to form tubular structures might be important in this context, since it is a precursor of a variety of (glyco) sphingolipids and is found in different organelles. Vesicular traffic is essential for transport of apoptotic sphingolipids from the plasma membrane to the mitochondria Citation[39]. Mitochondrial Cer levels are increased in response to different apoptotic stimuli, and are thought to activate the mitochondrial route of apoptosis. A recent study is indicative of the lipid restructuring ability of Cer to be on the basis of its role in cytochrome c (and apoptosis-inducing factor) induced release from the intermembrane space of mitochondria, because it is able to accomplish it without affecting the membrane potential Citation[40].
Biological membranes are composed of several different lipids (with varying chain length and saturation) and proteins that can strongly affect the phase behavior and biophysical properties. Moreover, asymmetric lipid distribution, rapid diffusion and translocation are all factors that should be taken into account (for review, see Citation[41]). Nevertheless, simple model systems are required to the understanding of more complex systems, which in general present phase-related properties.
S1 Cer-induced morphological alterations. Transmission electron microscopy images of POPC/Cer mixtures containing (A) 10, (B) 50, (C,D) 90 and (E,F) 96 mol% of Cer. Up to 10% Cer, the vesicles present a mean diameter of 100 nm and are round-shaped. With increasing amounts of Cer, vesicles tend to increase in size, aggregate and originate tubular structures. For very high Cer concentrations (∼92%) crystal formation starts to occur. Pure Cer crystals present a well defined crystalline structure, whereas the presence of POPC leads to a greater occurrence of crystal imperfections.
S2 Estimation of particle size by dynamic light scattering. Up to 20% Cer, it was possible to determine the size of the vesicles by DLS, which is in good agreement with TEM micrographs. For higher Cer amounts, size estimation was not possible due to a sharp increase in polydispersity. This is consequence of vesicle aggregation and tubule formation, as observed by TEM.
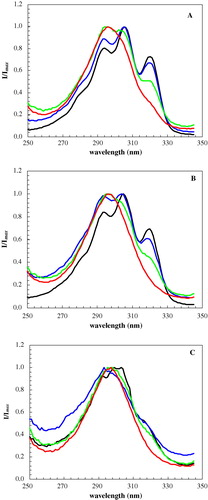
S3 Excitation spectra of t-PnA for POPC/Cer binary mixtures containing 50 (black), 80 (blue), 92 (green) and 100 (red) mol% of Cer at (A) 24°C, (B) 37°C and (C) 65°C. t-PnA exciton formation occurs at very high Cer content and reflects the exclusion of the probe from the highly ordered domains.
This paper was first published online on prEview on 27 January 2006.
This work and research grants (BD/10029/2002 to L.S., BPD/17842/2004 to R.F.M. de A. and BPD/11488/2002 to A.F.) were supported by POCTI/FCT, Portugal.
References
- Mathias S, Peña LA, Kolesnick RN. Signal transduction of stress via ceramide. Biochem J 1998; 335: 465–480
- Ruvolo PP. Intracellular signal transduction pathways activated by ceramide and its metabolites. Pharmacol Res 2003; 47: 383–392
- Hannun YA. Functions of ceramide in coordinating cellular responses to stress. Science 1996; 274: 1855–1859
- Pettus BJ, Chalfant CE, Hannun YA. Ceramide in apoptosis: an overview and current perspectives. Biochim Biophys Acta 2002; 1585: 114–125
- Kolesnick RN, Gõni FM, Alonso A. Compartmentalization of ceramide signaling: physical foundation and biological effects. J Cell Physiol 2000; 184: 285–300
- Cremesti AE, Gõni FM, Kolesnick RN. Role of sphingomyelinase and ceramide in modulating rafts: do biophysical properties determine biological outcome?. FEBS Lett 2002; 531: 47–53
- van Blitterswijk WJ, van der Luit AH, Veldman RJ, Verheij M, Borst J. Ceramide: second messenger or modulator of membrane structure and dynamics?. Biochem J 2003; 369: 199–211
- Härtel S, Fanani MA, Maggio B. Shape transitions and lattice structuring of ceramide-enriched domains generated by sphingomyelinase in lipid monolayers. Biophys J 2005; 88: 287–304
- Gulbins E, Dreschers S, Wilker B, Grassmé H. Ceramide, membrane rafts and infections. J Mol Med 2004; 82: 357–363
- Marsh D. Handbook of lipid bilayers. CRC Press, Boca Raton, FL 1990
- Mateo CR, Brochon J-C, Lillo MP, Acuña AU. Lipid clustering in bilayers detected by the fluorescence kinetics and anisotropy of trans-parinaric acid. Biophys J 1993; 65: 2237–2247
- Vierl U, Löbbecke L, Nagel N, Cevc G. Solute effects on the colloidal and phase behavior of lipid bilayer membranes: ethanol-dipalmitoylphosphatidylcholine mixtures. Biophys J 1994; 82: 823–834
- McClare CWF. An accurate and covenient organic phosphorus assay. Anal Biochem 1974; 39: 527–530
- Sklar LA, Hudson BS, Petersen M, Diamond J. Conjugated polyene fatty acids on fluorescent probes: spectroscopic characterization. Biochemistry 1977; 16: 813–818
- Lentz B. Membrane ‘fluidity’ from fluorescence anisotropy measurements. Spectroscopic membrane probes, L Loew. CRC Press, Boca Raton, FL 1988; 13–41
- Haugland R. Handbook of fluorescent probes and research chemicals6th ed. Molecular Probes, Eugene, OR 1996
- de Almeida RFM, Loura LMS, Fedorov A, Prieto M. Nonequilibrium phenomena in the phase separation of a two-component lipid bilayer. Biophys J 2002; 82: 823–834
- de Almeida RFM, Fedorov A, Prieto M. Sphingomyelin/Phosphatidylcholine/Cholesterol Phase diagram: boundaries and composition of lipid rafts. Biophys J 2003; 85: 2406–2416
- de Almeida RFM, Loura LMS, Fedorov A, Prieto M. Lipid rafts have different sizes depending on membrane composition: a time-resolved fluorescence resonance energy transfer study. J Mol Biol 2005; 346: 1109–1120
- Santos NC, Sousa AMA, Betbeder D, Prieto M, Castanho MARB. Structural characterization of organized systems of polysaccharides and phospholipids by light scattering spectroscopy and electron microscopy. Carbohydrate Res 1997; 300: 31–40
- Megha, London E. Ceramide selectively displaces cholesterol from ordered lipid domains (rafts). J Biol Chem 2004; 279: 9997–10004
- Hsueh Y-W, Giles R, Kitson N, Thewalt J. The effect of ceramide on phosphatidylcholine membranes: a deuterium NMR study. Biophys J 2002; 82: 3089–3095
- Lakowicz J. Principles of fluorescence spectroscopy2nd ed. Kluwer Academic, New York 1999
- Sklar LA, Miljanich GP, Dratz EA. Phospholipid lateral phase separation and the partition of cis-parinaric acid and trans-parinaric acid among aqueous, solid lipid, and fluid lipid phases. Biochemistry 1975; 18: 1707–1716
- Koynova R, Caffrey M. Phases and phase transitions of the phosphatidyl cholines. Biochim Biophys Acta 1998; 1376: 91–145
- Shah J, Atienza JM, Duclos RI, Rawlings AV, Dong Z, Shipley GG. Structural and thermotropic properties of synthetic C16:0 (palmitoyl) ceramide: effect of hydration. J Lipid Res 1995; 36: 1936–1944
- Sot J, Aranda FJ, Collado M-I, Gõni FM, Alonso A. Different effects of long- and short-chain ceramides on the gel-fluid and lamellar-hexagonal transitions of phospholipids: a calorimetric, NMR, and X-ray diffraction study. Biophys J 2005; 88: 3368–3380
- Prinetti A, Chigorno V, Prioni S, Loberto N, Marano N, Tettamanti G, Sonnino S. Changes in the lipid turnover, composition, and organization, as sphingolipid-enriched membrane domains, in rat cerebellar granule cells developing in vitro. J Biol Chem 2001; 276: 21136–21145
- Estronca L, Moreno M, Abreu M, Melo E, Vaz WLC. Solubility of amphiphiles in membranes: influence of phase properties and amphiphile head group. Biochem Biophys Res Comm 2002; 296: 596–603
- Holopainen JM, Subramanian M, Kinnunen PKJ. Sphingomyelinase induces lipid microdomain formation in a fluid phosphatidylcholine/sphingomyelin membrane. Biochemistry 1998; 37: 17562–17570
- Vaz WLC, Melo E. Fluorescence Spectroscopic studies on phase heterogeneity in lipid bilayer membranes. J Fluoresc 2002; 11: 255–271
- Mabrey S, Sturtevant JM. Investigation of phase transitions of lipids and lipid mixtures by high sensitivity differential scanning calorimetry. Proc Natl Acad Sci 1976; 73: 3862–3866
- Mehl R, Bever M. Phase diagrams in metallurgy: their development and application. McGraw-Hill, New York 1956
- López-Montero I, Rodriguez N, Cribier S, Pohl A, Vélez M, Devaux PF. Rapid transbilayer movement of ceramides in phospholipid vesicles and in human erythrocytes. J Biol Chem 2005; 280: 25811–25819
- Mukherjee S, Maxfield FR. Role of membrane organization and membrane domains in endocytic lipid trafficking. Traffic 2000; 1: 203–211
- van Meer G, Sprong H. Membrane lipids and vesicular traffic. Curr Opin Cell Biol 2004; 16: 373–378
- Bezombes C, Grazide S, Garret C, Fabre C, Quillet-Mary A, Müller S, Jaffrézou J-P, Laurent G. Rituximab antiproliferative effect in B-lymphoma cells is associated with acid-sphingomyelinase activation in raft microdomains. Blood 2004; 104: 1166–1173
- Roux, A, Cuvelier, D, Nassoy, P, Prost, J, Bassereau, P, Goud, B. Role of curvature and phase transition in lipid sorting and fission of membrane tubules. EMBO J 2005;1–9.
- Colell A, Morales A, Fernandez-Checa J, Garcia-Ruiz C. Ceramide generated by acidic sphingomyelinase contributes to tumor necrosis factor-alpha-mediated apoptosis in human colon HT-29 cells through glycosphingolipids formation. Possible role of ganglioside GD3. FEBS Lett 2002; 526: 135–141
- Di Paola M, Zaccagnino P, Montedoro G, Cocco T, Lorusso M. Ceramide induces release of pro-apoptotic proteins from mitochondria by either a Ca2 + -dependent or a Ca2 + -independent mechanism. J Bioenerg Biomembr 2002; 36: 165–170
- Devaux PF, Morris R. Transmembrane asymmetry and lateral domains in biological membranes. Traffic 2004; 5: 241–246