Abstract
Lateral segregation of cell membrane components gives rise to microdomains with a different structure within the membrane. Most prominently, lipid rafts are defined as domains in liquid ordered phase whereas surrounding membranes are more fluid. Here we review a 2-photon fluorescence microscopy approach, which allows the visualization of membrane fluidity. The fluorescent probe Laurdan exhibits a blue shift in emission with increasing membrane condensation caused by an alteration in the dipole moment of the probe as a consequence of exclusion of water molecules from the lipid bilayer. The quantification of membrane order is achieved by the Generalized Polarization (GP) values, which are defined as normalized intensity ratios of two emission channels. GP images are therefore not biased by probe concentrations and membrane ruffles. Furthermore, Laurdan reports membrane structure independently from the lipid and protein cargo of the membrane domains. We give examples where Laurdan microscopy was instrumental in quantifying the formation of condensed membrane domains and their cellular requirements. Moreover we discuss how microdomains identified by Laurdan microscopy are consistent with domains identified by other methodologies and put GP images in the context of current raft hypotheses.
Introduction
A central feature of cell membranes is lateral segregation of domains. A prominent example for such membrane regions of distinct chemical composition and physical properties are synapses, forming between nerve cells and between immune cells. Lateral compartmentalisation of membrane domains and thus segregation of biological functions associated with these domains is currently attracting much attention. In particular cholesterol- and sphingolipid-rich domains termed lipid rafts are envisaged as forming platforms for multiple cellular processes ranging from membrane sorting to signal transduction via cell surface receptors (Simons & Ikonen [Citation1997], Simons & Toomre [Citation2000]). Defining the properties of raft membrane domains has recently been a matter of intense research effort and discussion (Harder & van Meer [Citation2003], Kenworthy [Citation2005]). Here we review recent advances in imaging membrane domains using the fluorescent lipid dye Laurdan and 2-photon microscopy.
Resistance to extraction by detergents, most prominently Triton X100 at 4oC has been a defining criterion for rafts and raft-association of cellular proteins and lipids (Brown & London [Citation1998]). While the analysis of association to detergent resistant membranes (DRMs) has been a valuable entry point for the raft research area, the notion of equating DRMs with raft membrane domains of cells has been criticized (Munro [Citation2003]). From studies in model membranes (Heerklotz [Citation2002]) and isolated cellular membranes (Gaus et al. [Citation2005b]) it has become clear that the detergent treatment itself can induce the formation of lipid domains which do not exist in the membranes prior to detergent extraction. As a further approach, the distribution of generic chemical raft membrane markers, as defined by their DRM association, has been followed in live and fixed cells. For example, confocal fluorescence microscopy of T-lymphocytes showed the recruitment of the DRM-associated glycosphingolipid ganglioside GM1 to T-cell activation sites (Viola et al. [Citation1999], Tuosto et al. [Citation2001]), which was interpreted as recruitment of membrane rafts to these sites. However, further analysis suggested that the enhanced GM1 staining at T-cell activation regions is caused by membrane convolution and does not reflect concentration of GM1 in membrane domains involved in T-cell activation (Glebov & Nichols [Citation2004]). Several studies using standard fluorescence microscopy showed an even distribution of chemical raft markers throughout the cell membrane and gave no indication for clustering of these markers in plasma membrane domains (Harder et al. [Citation1998]). However, cholesterol-dependent clusters of GPI-anchored or acylated DRM-associated reporter proteins were observed by electron microscopy (Wilson et al. [Citation2004]) and FRET (fluorescent resonance energy transfer) analyses (Varma & Mayor [Citation1998], Zacharias et al. [Citation2002]). These clusters of GPI- anchored protein contained only a very small number of raft proteins while 60–80% of these reporter molecules were actually monomeric (Sharma et al. [Citation2004], Simons & Toomre [Citation2000]). In contrast, other studies using FRET have indicated a random distribution of GPI-linked raft reporters (Kenworthy & Edidin [Citation1998], Kenworthy et al. [Citation2000]). It remains to be elucidated whether the small number of raft reporters in clusters described by Sharma et al. is the cause for this discrepancy.
In resting cells, such clusters are likely to be too small and dynamic to serve as a platform for a biological function. Thus to form larger, signalling-enabling platforms protein-driven interactions may be required. For example, the formation of T cell receptor (TCR) signalling machinery within plasma membrane domains involves networks of intracellular protein-mediated interactions (Dykstra et al. [Citation2003]). Protein networks are formed on the surface of living cells in a non-physiological manner by cross-linking DRM markers with antibodies or cholera toxin B subunits (Harder et al. [Citation1998]). These patched clusters on the cell surface attract other cross-linked raft components via lipid interactions. Taken together these data suggest that lipid- and protein-mediated interactions cooperate to form biologically functional membrane domains. Here, unambiguous microscopy methods, such as Laurdan microscopy, may prove instrumental in analysing the formation, maintenance and function of lipid domains.
Visualization of membrane order – how does Laurdan work?
An important biophysical property of raft-like membranes was characterized in studies on model membranes. These artificial membranes, composed of sphingolipids, cholesterol and glycerophospholipids, displayed two coexisting fluid phases; the liquid-ordered (lo) and liquid-disordered (ld) membrane phase. This observation led to the model of cellular rafts as ordered membrane phases which float in a disordered environment of non-raft membrane (Brown & London [Citation2000]). Support for this notion came from studies showing that GPI-anchored proteins reconstituted into lo phase in model membranes resisted detergent extraction while being solubilized by detergent from ld membranes (Schroeder et al. [Citation1998]). Moreover, it was shown that GPI-linked raft markers partition into lo phases, while non-raft model proteins were excluded from these phases (Kahya et al. [Citation2005]). Therefore visualizing membrane microdomains based on their characteristic ordered membrane phase is an important novel method which can be used to study rafts. Order of membranes, however, can only be determined indirectly. The stiffness of a membrane, for example, influences the degree of Brownian rotational diffusion of a selectively excited fluorophore, which can be quantified by fluorescence polarization or fluorescence anisotropy.
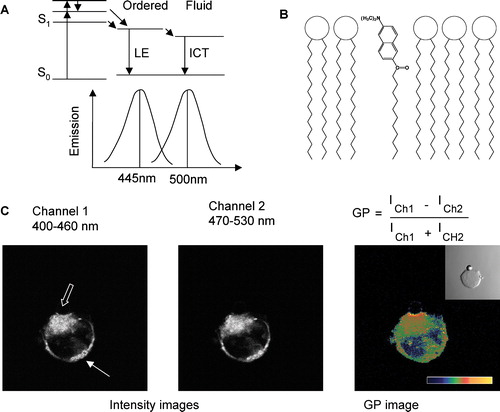
Membrane order can be assessed by the degree of packing order, as loosely packed membranes are more polar due to increased penetration of water molecules into the lipid bilayer. This change in polarity can be employed to measure the degree of condensation of membranes by utilizing fluorescent membrane probes whose emission spectra are solvent-polarity dependent and can report on membrane order. Most of these environmentally sensitive probes display an increase in charge separation when excited in polar solvents resulting in a larger dipole moment (Lakowicz [Citation1999]). Polarity-sensitive probes therefore have often more than one excited state; a locally excited state (LE) intrinsic to the fluophore and an internal charge transfer (ICT) state created by the larger dipole moment (see A). Since emission occurs from the lowest energy excited state (Kasha's rule), the polarity of the environment not only lowers the energy of the excited states due to general solvent effects (within the S1 states, A) but also dictates from which state the fluorescent light is emitted. These transitions from LE states in non-polar solvents to ICT states in polar solvents shift the emission maxima. In most cases, more polar solvents induce a red shift in emission maxima because ICT states tend to have lower energy levels compared to LE states (Lakowicz [Citation1999]). Since peak emissions are technically simpler to observe by microscopy than the polarization of emitted light, these probes are preferable for assessing membrane order.
Figure 1. (A) The Jablonski diagram of Laurdan illustrates adsorption, solvent relaxation to, and emission from two, different excited states; LE (locally excited) state in less polar environments and ICT (internal charge transfer) state in more polar environments. A schematic representation of the corresponding emission maxima of Laurdan in ordered and fluid phases is also shown. (B) Structure of Laurdan and its orientation in a phospholipid layer. (C) Intensity images of channel 1 (Ch1: 400–460 nm), channel 2 (Ch2: 470–500 nm) and the corresponding GP images of Laurdan-labeled T-cells activated with a bead coated with anti-CD3 antibodies (see phase-contrast image in insert in GP image). The GP image is pseudo-colored as indicated by the scale with GP from −1 to +1. The solid arrow points to an area in the cell with equal intensity in both channels resulting in a low GP value (green). The hollow arrow points to the T cell activation site, which has a higher Laurdan intensity in channel 1 resulting in a higher GP value (yellow).
Weber and Farris introduced the probe Prodan in 1979, which has both an electron-donor and electron-acceptor and displays large solvent-dependent fluorescence shifts (Weber & Farris [Citation1979]). Prodan and its derivative Laurdan both report the physical state of the lipid bilayer but differ in their location in membranes. Prodan appears to localize at the surface of membrane bilayers (Chong [Citation1988]) and is not evenly distributed within cellular plasma membranes. Its emission shifts appear sensitive to the linkage (ester or ether) within phospholipids (Sommer et al. [Citation1990]). In contrast, the lipophilic dye Laurdan aligns itself parallel with the hydrophobic tails of the phospholipids in membranes (B). Its emission spectra and location are independent of phospholipid head groups and linkage and Laurdan reports the packing order by the degree of water penetration (Bagatolli et al. [Citation1998], Bagatolli et al. [Citation1999]). Penetration of water into the bilayer, for example into more loosely packed membranes, results in polar water molecules adjacent to the probes and hence emission shifts to longer wavelengths. Importantly, Laurdan is non-fluorescent in aqueous media resulting in extremely low background emissions. Because of its hydrophobic tail, Laurdan travels as micelles through aqueous media but distributes quickly within membranes or between membranes where membrane bridges exist.
Due to its blue shift in emission if membranes undergo transition from fluid to solid, Laurdan lends itself to measurements in terms of ratios of emission intensities. Enrico Gratton and his group (reviewed in Bagatolli et al. [Citation2003]) established the use of the Generalised Polarization (GP) value, which is defined as:1 where a blue intensity (Iblue) and a red-shifted intensity (Ired) are recorded simultaneously. Thus, the GP value is calculated from the ratio of emission intensities. With a two-photon microscope and an excitation at 800 nm, two intensity images between 400–460 nm and 470–530 nm are recorded simultaneously and hence the definition of GP becomes:
2 GP values therefore range from –1 to +1 with –1 the most fluid values and +1 the most condensed ones. Since GP values are a ratio of two intensities, measurements are independent of local probe concentrations or surface area. These features are particularly important when Laurdan is used in cellular membranes, where membrane ruffles often lead to false reports of accumulation when single emission wavelengths are used.
To calibrate the relative sensitivity of the two intensity regions, standard solutions, such as Laurdan in DMSO at 22C with a known GP value of GPtheo=0.207, can be used. The GP values can then be corrected (GPcorr) for the microscopy being used by incorporating the G-factor:3 where
4 where GPexp is the experimentally determined GP value (Eq. 2) of the standard solution.
Visualization of liquid ordered domains – from model systems to cellular membranes
The fluorescence properties of Laurdan have been used to visualize lipid domains in artificial membranes with phase co-existence and in the determination of transition temperatures. Since Laurdan molecules align parallel to the phospholipids in a membrane, the dipole moment of Laurdan in free standing liposomes describe the circumference of the sphere defined by the vesicle (Parasassi et al. [Citation1997]). If polarized light is used for the excitation, Laurdan molecules in lipid vesicles in ordered/gel phase are photo-selected, i.e., only Laurdan molecules with transition dipoles parallel to the excitation polarization are strongly excited (Bagatolli et al. [Citation1997], Parasassi et al. [Citation1997]). In condensed membranes, the intensity images therefore reflect the alignment of the Laurdan molecules relative to the excitation beam. In fluid membranes, because of the greater flexibility of Laurdan's orientation, the photoselection is less pronounced resulting in a more even emission intensity (Bagatolli & Gratton [Citation2000b]). Hence, if circular polarized light is used for excitation, the photoselection effect can be used to discriminate between fluid and solid phase domains in regions of the lipid vesicles where Laurdan's dipole is not aligned to the excitation while GP images can be used to visualize differences in phases when Laurdan's dipole is aligned. Furthermore, if linear polarized light is used for excitation, because of the photoselection of high GP domains, lipid domains of equal or smaller size than the image pixel size can be detected (Bagatolli & Gratton [Citation1999], Parasassi et al. [Citation1997]) but only in a membrane system where Laurdan's orientation relative to the excitation is known. This is not the case with cellular membranes. Data obtained with Laurdan in liposomes agrees well with data obtained by other probes such as N-Rh-DPPE (Lissamine rhodamine B 1,2-dihexadecanoyl-sn-glycero-3-phosphoethanolamine), which is segregated from gel phases in membranes with co-existing phases (Bagatolli & Gratton [Citation2000a]) or other headgroup-labeled fluorescent phospholipid analogues (Dietrich et al. [Citation2001]).
The direct visualization of lipid phase equilibria by Laurdan two-photon excitation microscopy has been reported for liposomes composed of pure components (Bagatolli & Gratton [Citation1999]), binary (Bagatolli & Gratton [Citation2000a], Bagatolli & Gratton [Citation2000b]) or tertiary mixtures (Dietrich et al. [Citation2001]). Furthermore, the relationship between phase co-existence and head group composition in saturated phospholipid binary mixtures (Bagatolli & Gratton [Citation2000a]) as well as phase co-existence in lipid mixtures with different chain length or degree of saturation (Bagatolli & Gratton [Citation2000b]) have also been described. The transition temperatures reported for fluid to solid-fluid co-existence and from solid-fluid to solid co-existence are in good agreement with other methods such as NMR, ESR or time-resolved X-ray diffraction (Bagatolli & Gratton [Citation2000b]). In liposomes with fluid-solid phase coexistence, typically the fluid phase has a GP value between −0.05 and 0.25 while solid ordered phases occur between 0.25 and 0.55. Dietrich et al. extracted lipids from brush border membranes and reconstituted these lipids in model membranes to observe the formation of ‘raft’ domains in the order of 10 µm or more (Dietrich et al. [Citation2001]). This study demonstrated that Laurdan microscopy could be used to visualize the coexistence of two fluid domains and confirmed that selected lipids could laterally aggregate to form ordered domains or lipid rafts. The study further showed that the two liquid phases have a GP difference of ∼0.3 and that GP distribution of these liquid phases falls between the GP values of the gel phase and fluid (liquid-crystalline) phase of DPPC (1,2-dipalmitoyl-sn-glycero-3-phosphocholine). Like other studies, Dietrich et al. also confirmed that coexistence of liquid phases is dependent on the presence of cholesterol (Dietrich et al. [Citation2001]). Domain formation in reconstituted or purified lipid mixtures is affected by temperature. Pattern, shape and size of these domains are also critically influenced by the exact lipid composition, impurities (Dietrich et al. [Citation2001]), equilibration time and speed as well as reconstitution methods (Bagatolli et al. [Citation2000]).
Since Laurdan's fluorescent properties are independent of the chemical composition of membranes the method is ideally suited for imaging membrane structure in the presence of proteins. For example, Laurdan microscopy has been used to characterize lipoproteins (Brunelli et al. [Citation2000]), the hydrolysis of the 2-acyl group in phospholipids by phospholipases (Sanchez et al. [Citation2002]), the extraction of sterols by apoproteins (Arnulphi et al. [Citation2005], Tricerri et al. [Citation2002], Tricerri et al. [Citation2005]) and the binding of a mitochondrial kinase to membranes (Granjon et al. [Citation2001]). More recently, Laurdan microscopy has been applied to bacterial membranes (Vanounou et al. [Citation2002]), sperm cell membranes (Ambrosini et al. [Citation2001]), erythrocyte ghosts (Harris et al. [Citation2001]) and other mammalian cells (Gaus et al. [Citation2003], Kindzelskii et al. [Citation2004]). It is noteworthy that the photoselection described in lipid vesicles is negligible in cellular membrane presumably due to the convolutions and fluid state of cellular membranes. Hence GP values in cellular membranes are independent of probe orientation or membrane ruffles. Experiments in liposomes showed that curvature can influence GP measurements; a high curvature leads to increased water penetration and therefore lower GP values (Bagatolli & Gratton [Citation1999]). Hence in membrane morphologies such as filopodia or spikes, the GP values may be underestimated.
We (Gaus et al. [Citation2005a], Gaus et al. [Citation2003]), and others (Kindzelskii et al. [Citation2004]) have reported plasma membrane domains of different GP values in live and fixed mammalian cells, with regions of high GP frequently at membrane protrusions. In order to understand how the condensed membranes phases observed in these studies relate to the classic definition of membrane rafts, we distinguished two distinct regions of cellular membranes. We discriminated between regions with a mean GP of 0.10–0.25 corresponding to liquid-disordered domains and domains with a mean GP of 0.35–0.55 corresponding to liquid-ordered domains. We characterized the temperature and cholesterol dependency of the GP distribution, quantified the association of raft proteins with the high GP domains and non-raft proteins with the low GP domains and compared the surface coverage of the high GP domains to the yield of detergent resistant membranes (Gaus et al. [Citation2003]). We concluded that high GP domains in macrophages generally showed a preferential association with raft markers and were rafts as experimentally defined by other techniques and methodologies. However, in other cell types, such as T-cells we have observed discrepancies. For example, we found that staining of cholera toxin subunit B which labels GM1 colocalizes with some, but not all, ordered membrane domains and can further accumulate outside ordered domains (unpublished observation, T Zech, T Harder, K Gaus).
Strengths and limitations of the Laurdan microscopy in cellular membranes
GP images of fixed or live cells indicate the global membrane structure. We have previously plotted GP values of cells as a histogram to compare overall membrane structure before and after activation of T-cells (Gaus et al. [Citation2005a]), cholesterol depletion or enrichment in macrophages, cross-linking of membrane proteins in fibroblasts (Gaus et al. [Citation2003]) and detergent treatment of COS7 cells (unpublished observation, A Pol, K Gaus). These are powerful comparisons but require a large number of images. It is noteworthy that we find considerable variations in GP distributions in non-stimulated cells between cell lines and cell types suggesting a cellular diversity of lateral membrane organizations. Detaching endothelial cells from the substratum, for example, results in a loss of GP domains suggesting that this cell type possesses anchorage-dependent ordered membrane domains (unpublished observation, K. Gaus, MA Schwartz). Similarly, adherent, fully differentiated macrophages display higher GP values compared to the precursor monocytes (Gaus et al. [Citation2005b]). Furthermore, cell shape and confluency of the cell monolayer can influence the GP distribution. Taken together, our results indicate that the organization of the actin cytoskeleton is likely to influence membrane structure globally.
To gain insight into specific sites, such as the immunological synapse of T-cells, the GP values of these ‘regions of interests’ (ROI) have to be determined for each individual image. This method allowed us to demonstrate that membrane condensation takes place at the T-cell activation site (Gaus et al. [Citation2005a]). Further, we could demonstrate that membrane condensation in T-cells was critically dependent on the activity of Src kinases, the transmembrane protein LAT (linker for the activation of T-cells) and the actin cytoskeleton.
Laurdan microscopy can be combined with confocal immunofluorescence with red or infra-red fluorescent dyes or fusions with monomeric red fluorescent proteins (mRFPs). Hence the ROI can be defined by the confocal microscopy image to reveal the membrane structure in the immediate vicinity of protein or lipid of interest. This approach, for example, showed that the release of intracellular calcium results in a translocation of annexin VI from fluid to condensed membranes (unpublished observation, T Grewal, K Gaus). In such an analysis ‘raft accumulation’ is not determined by the fluorescence intensity of the confocal image or biochemically by DRM-association but quantifies the ‘overlap’ with ordered membrane domains. Hence falsely reported ‘accumulations’ with confocal images, for example at membrane ruffles below the resolution of the microscope, do not play a role in confocal-to-GP image comparisons.
Two-photon excitation (at 800 nm for Laurdan excitation) has the added advantages of a greater penetration depth allowing the imaging of tissue sections, lower toxicity of the longer wavelengths for live cell imaging and the significantly decreased photo-bleaching of Laurdan itself. In addition, two-photon excitation allows a simple recording of stacks of z-sections, which can be, after conversion to GP images, reconstructed to give a three-dimensional image of the membrane structure. Such 3D reconstruction, for example, clearly demonstrated the accumulation of condensed membrane domains at the periphery of immunological synapses at 20–25 min after ligation (Gaus et al. [Citation2005a]).
While the determination of membrane condensation using ratios of emission spectra avoids many problems of conventional confocal microscopy, it is likewise limited by the spatial resolution of the microscope (typically ∼200 nm). We imaged focal adhesions in endothelial cells and observed that focal adhesion markers, such as pFAK (phosphorylated focal adhesion kinase) associate with ordered membranes in an anchorage dependent manner (unpublished observation, K Gaus, MA Schwartz). Areas of high GP, which overlapped with pFAK were approximately 0.2–1.0 µm in diameter and therefore at the limit of the resolution of the microscope. Hence co-localization is difficult to visualize directly by merging confocal and GP images. However, a pixel-per-pixel comparison between confocal immunofluorescence and GP images revealed a statistically significant association of focal adhesions with ordered domains, which is lost upon detachment.
What does Laurdan microscopy and GP images tell us about the nature of lipid rafts?
There is increasing evidence that lipid raft size, abundance and distribution are critically dependent on the state of the cell. It has been proposed that in resting cells, lipid rafts in the plasma membrane are small and dynamic. Rafts assembled by the self-aggregation of lipids do most likely not exceed a few to tens of nanometers in diameter, as determined with fluorescence resonance energy transfer (FRET) measurements (Sharma et al. [Citation2004], Varma & Mayor [Citation1998]). Although GPI-anchored proteins in the outer leaflet and myristoylated and palmitoylated anchored proteins in the inner leaflet of the lipid bilayer indeed appear clustered in cholesterol-dependent domains (Sharma et al. [Citation2004], Zacharias et al. [Citation2002]), such domains are too mobile to be detected by Laurdan imaging and below the resolution of conventional light microscopy.
Kusumi and co-workers suggested that the plasma membrane is compartmentalized into 50–200 nm-sized zones with compartment boundaries made of the actin-based membrane skeleton (‘fences’) and transmembrane proteins anchored to the membrane skeleton (‘pickets’) (Kusumi et al. [Citation2004]). It has been further suggested that ligation or crosslinking induces clustered rafts (‘receptor-clustered rafts’) with micrometer diameters and residence times of up to several minutes. These larger, stabilized rafts have been experimentally observed with single particle trafficking (Kusumi et al. [Citation2004]) and light microscopy (Harder et al. [Citation1998]). Since increased lipid residency or limited diffusion directly translates into high GP values, Laurdan microscopy can be used to analyse the membrane order of raft clusters. It reported the coalescence of ordered domains in specific membrane morphologies, such as filopodia in macrophages (Gaus et al. [Citation2003]), lamellipodia in neutrophils (Kindzelskii et al. [Citation2004]) or immunological synapses in T lymphocytes (Gaus et al. [Citation2005a]). It is important to note that high GP domains do not represent an individual compartment but reports the overall plasma membrane structure in these regions and cannot discriminate between coalescence of small rafts and the de novo formation of large condensed domains. Laurdan microscopy can be used to elucidate which cellular processes trigger these large raft domains. Our data on T cell activation, for example, demonstrate that membrane condensation at the sites of TCR triggering depends on Src kinase activity and stabilization by the actin cytoskeleton (Gaus et al. [Citation2005a]). Our data support the notion that the protein-protein interactions drive the assembly of multi-molecular signalling complexes (Douglass & Vale [Citation2005], Harder & Kuhn [Citation2000]) and the formation of large and stable plasma membrane domains in a condensed lipid phase (Gaus et al. [Citation2005a]). Moreover, our data highlights the importance of the actin cytoskeleton in the formation of large condensed membrane domains; thus these domains resemble membrane ‘buoys’ rather than ‘rafts’.
To understand the functional importance of membrane condensation at specific membrane morphologies or activation sites, it will be important to monitor carefully the kinetics of domain assembly and correlate domain structure with domain composition. Large, stabilized membrane domains are likely to recruit cholesterol, glycosphingolipids and other raft-preferring molecules (Kusumi et al. [Citation2004]). Correlations between the dynamics of membrane condensation and recruitment of raft-favour proteins or lipids will give valuable insights into the mechanisms of activation-mediated membrane organization. Furthermore, the stabilizing effect of condensed membrane domains on protein complexes and signalling efficiency is virtually an unexplored area of research. It is evident that the cooperation of lipid order and protein function is critical for numerous cellular processes, in particular in signal transduction and cell polarization. Laurdan microscopy with its capability of reporting membrane structure in live cells can contribute to the understanding of lateral membrane organization.
We would like to thank Marion Brown for her help with the manuscript. KG acknowledges funding from the Australian Research Council and the Australian National Health and Medical Research Council. TH acknowledges support of his work by BBSRC and EPA Trust.
References
- Ambrosini A, Zolese G, Balercia G, Bertoli E, Arnaldi G, Mantero F. Laurdan fluorescence: a simple method to evaluate sperm plasma membrane alterations. Fertil Steril 2001; 76: 501–505
- Arnulphi C, Sanchez SA, Tricerri MA, Gratton E, Jonas A. Interaction of human apolipoprotein a-I with model membranes exhibiting lipid domains. Biophys J 2005; 89: 285–295
- Bagatolli LA, Gratton E. Two-photon fluorescence microscopy observation of shape changes at the phase transition in phospholipid giant unilamellar vesicles. Biophys J 1999; 77: 2090–2101
- Bagatolli LA, Gratton E. A correlation between lipid domain shape and binary phospholipid mixture composition in free standing bilayers: a two-photon fluorescence microscopy study. Biophys J 2000a; 79: 434–447
- Bagatolli LA, Gratton E. Two photon fluorescence microscopy of coexisting lipid domains in giant unilamellar vesicles of binary phospholipid mixtures. Biophys J 2000b; 78: 290–305
- Bagatolli LA, Gratton E, Fidelio GD. Water dynamics in glycosphingolipid aggregates studied by LAURDAN fluorescence. Biophys J 1998; 75: 331–341
- Bagatolli LA, Maggio B, Aguilar F, Sotomayor CP, Fidelio GD. Laurdan properties in glycosphingolipid-phospholipid mixtures: a comparative fluorescence and calorimetric study. Biochim Biophys Acta 1997; 1325: 80–90
- Bagatolli LA, Parasassi T, Fidelio GD, Gratton E. A model for the interaction of 6-lauroyl-2-(N,N-dimethylamino)naphthalene with lipid environments: implications for spectral properties. Photochem Photobiol 1999; 70: 557–564
- Bagatolli LA, Parasassi T, Gratton E. Giant phospholipid vesicles: comparison among the whole lipid sample characteristics using different preparation methods: a two photon fluorescence microscopy study. Chem Phys Lipids 2000; 105: 135–147
- Bagatolli LA, Sanchez SA, Hazlett T, Gratton E. Giant vesicles, Laurdan, and two-photon fluorescence microscopy: evidence of lipid lateral separation in bilayers. Methods Enzymol 2003; 360: 481–500
- Brown DA, London E. Structure and origin of ordered lipid domains in biological membranes. J Membr Biol 1998; 164: 103–114
- Brown DA, London E. Structure and function of sphingolipid- and cholesterol-rich membrane rafts. J Biol Chem 2000; 275: 17221–17224
- Brunelli R, Mei G, Krasnowska EK, Pierucci F, Zichella L, Ursini F, Parasassi T. Estradiol enhances the resistance of LDL to oxidation by stabilizing apoB-100 conformation. Biochemistry 2000; 39: 13897–13903
- Chong PL. Effects of hydrostatic pressure on the location of PRODAN in lipid bilayers and cellular membranes. Biochemistry 1988; 27: 399–404
- Dietrich C, Bagatolli LA, Volovyk ZN, Thompson NL, Levi M, Jacobson K, Gratton E. Lipid rafts reconstituted in model membranes. Biophys J 2001; 80: 1417–1428
- Douglass AD, Vale RD. Single-molecule microscopy reveals plasma membrane microdomains created by protein-protein networks that exclude or trap signaling molecules in T cells. Cell 2005; 121: 937–950
- Dykstra M, Cherukuri A, Sohn HW, Tzeng SJ, Pierce SK. Location is everything: lipid rafts and immune cell signaling. Annu Rev Immunol 2003; 21: 457–481
- Gaus, K, Chklovskaia, E, Fazekas de St Groth, B, Jessup, W, Harder, T. 2005a. Condensation of the plasma membrane at the site of T-lymphocyte activation. J Cell Biol, 171:121–131.
- Gaus K, Gratton E, Kable EP, Jones AS, Gelissen I, Kritharides L, Jessup W. Visualizing lipid structure and raft domains in living cells with two-photon microscopy. Proc Natl Acad Sci USA 2003; 100: 15554–15559
- Gaus K, Rodriguez M, Ruberu KR, Gelissen I, Sloane TM, Kritharides L, Jessup W. Domain-specific lipid distribution in macrophage plasma membranes. J Lipid Res 2005b; 46: 1526–1538
- Glebov OO, Nichols BJ. Lipid raft proteins have a random distribution during localized activation of the T-cell receptor. Nat Cell Biol 2004; 6: 238–243
- Granjon T, Vacheron MJ, Vial C, Buchet R. Mitochondrial creatine kinase binding to phospholipids decreases fluidity of membranes and promotes new lipid-induced beta structures as monitored by red edge excitation shift, laurdan fluorescence, and FTIR. Biochemistry 2001; 40: 6016–6026
- Harder T, Kuhn M. Selective accumulation of raft-associated membrane protein LAT in T cell receptor signaling assemblies. J Cell Biol 2000; 151: 199–208
- Harder T, Scheiffele P, Verkade P, Simons K. Lipid domain structure of the plasma membrane revealed by patching of membrane components. J Cell Biol 1998; 141: 929–942
- Harder T, van Meer G. Lipid-based membrane domains: physics meets immunology. Traffic 2003; 4: 812–820
- Harris FM, Smith SK, Bell JD. Physical properties of erythrocyte ghosts that determine susceptibility to secretory phospholipase A2. J Biol Chem 2001; 276: 22722–22731
- Heerklotz H. Triton promotes domain formation in lipid raft mixtures. Biophys J 2002; 83: 2693–2701
- Kahya N, Brown DA, Schwille P. Raft partitioning and dynamic behavior of human placental alkaline phosphatase in giant unilamellar vesicles. Biochemistry 2005; 44: 7479–7489
- Kenworthy AK. Where do we go from here? Meeting Report on the Biophysical Society Discussion on ‘Probing Membrane Microdomains’, 28–31 October 2004, Asilomar, CA, USA. Traffic 2005; 6: 518–523
- Kenworthy AK, Edidin M. Distribution of a glycosylphosphatidylinositol-anchored protein at the apical surface of MDCK cells examined at a resolution of <100 A using imaging fluorescence resonance energy transfer. J Cell Biol 1998; 142: 69–84
- Kenworthy AK, Petranova N, Edidin M. High-resolution FRET microscopy of cholera toxin B-subunit and GPI-anchored proteins in cell plasma membranes. Mol Biol Cell 2000; 11: 1645–1655
- Kindzelskii AL, Sitrin RG, Petty HR. Cutting edge: optical microspectrophotometry supports the existence of gel phase lipid rafts at the lamellipodium of neutrophils: apparent role in calcium signaling. J Immunol 2004; 172: 4681–4685
- Kusumi A, Koyama-Honda I, Suzuki K. Molecular dynamics and interactions for creation of stimulation-induced stabilized rafts from small unstable steady-state rafts. Traffic 2004; 5: 213–230
- Lakowicz JR. Principles of fluorescence spectroscopy. Plenum Publishers, New York 1999
- Munro S. Lipid rafts: elusive or illusive?. Cell 2003; 115: 377–388
- Parasassi T, Gratton E, Yu WM, Wilson P, Levi M. Two-photon fluorescence microscopy of Laurdan generalized polarization domains in model and natural membranes. Biophys J 1997; 72: 2413–2429
- Sanchez SA, Bagatolli LA, Gratton E, Hazlett TL. A two-photon view of an enzyme at work: Crotalus atrox venom PLA2 interaction with single-lipid and mixed-lipid giant unilamellar vesicles. Biophys J 2002; 82: 2232–2243
- Schroeder RJ, Ahmed SN, Zhu Y, London E, Brown DA. Cholesterol and sphingolipid enhance the Triton X-100 insolubility of glycosylphosphatidylinositol-anchored proteins by promoting the formation of detergent-insoluble ordered membrane domains. J Biol Chem 1998; 273: 1150–1157
- Sharma P, Varma R, Sarasij RC, Ira Gousset K, Krishnamoorthy G, Rao M, Mayor S. Nanoscale organization of multiple GPI-anchored proteins in living cell membranes. Cell 2004; 116: 577–589
- Simons K, Ikonen E. Functional rafts in cell membranes. Nature 1997; 387: 569–572
- Simons K, Toomre D. Lipid rafts and signal transduction. Nat Rev Mol Cell Biol 2000; 1: 31–39
- Sommer A, Paltauf F, Hermetter A. Dipolar solvent relaxation on a nanosecond time scale in ether phospholipid membranes as determined by multifrequency phase and modulation fluorometry. Biochemistry 1990; 29: 11134–11140
- Tricerri MA, Sanchez SA, Arnulphi C, Durbin DM, Gratton E, Jonas A. Interaction of apolipoprotein A-I in three different conformations with palmitoyl oleoyl phosphatidylcholine vesicles. J Lipid Res 2002; 43: 187–197
- Tricerri MA, Toledo JD, Sanchez SA, Hazlett TL, Gratton E, Jonas A, Garda HA. Visualization and analysis of apolipoprotein A-I interaction with binary phospholipid bilayers. J Lipid Res 2005; 46: 669–678
- Tuosto L, Parolini I, Schroder S, Sargiacomo M, Lanzavecchia A, Viola A. Organization of plasma membrane functional rafts upon T cell activation. Eur J Immunol 2001; 31: 345–349
- Vanounou S, Pines D, Pines E, Parola AH, Fishov I. Coexistence of domains with distinct order and polarity in fluid bacterial membranes. Photochem Photobiol 2002; 76: 1–11
- Varma R, Mayor S. GPI-anchored proteins are organized in submicron domains at the cell surface. Nature 1998; 394: 798–801
- Viola A, Schroeder S, Sakakibara Y, Lanzavecchia A. T lymphocyte costimulation mediated by reorganization of membrane microdomains. Science 1999; 283: 680–682
- Weber G, Farris FJ. Synthesis and spectral properties of a hydrophobic fluorescent probe: 6-propionyl-2-(dimethylamino)naphthalene. Biochemistry 1979; 18: 3075–3078
- Wilson BS, Steinberg SL, Liederman K, Pfeiffer JR, Surviladze Z, Zhang J, Samelson LE, Yang LH, Kotula PG, Oliver JM. Markers for detergent-resistant lipid rafts occupy distinct and dynamic domains in native membranes. Mol Biol Cell 2004; 15: 2580–2592
- Zacharias DA, Violin JD, Newton AC, Tsien RY. Partitioning of lipid-modified monomeric GFPs into membrane microdomains of live cells. Science 2002; 296: 913–916