Abstract
Cystic fibrosis (CF), the most common genetic disease among Caucasians, is caused by mutations in the gene encoding CFTR (cystic fibrosis transmembrane conductance regulator). The most frequent mutation, ΔF508, results in protein misfolding and, as a consequence, prevents CFTR from reaching its final location at the cell surface. CFTR is expressed in various cell types including red blood cells. The functional role of CFTR in erythrocytes is still unclear. Since the number of CFTR copies in a single erythrocyte of healthy donors and CF patients with a homozygous ΔF508 mutation is unknown, we counted CFTR, localized in erythrocyte plasma membrane, at the single molecule level. A novel experimental approach combining atomic force microscopy with quantum-dot-labeled anti-CFTR antibodies, used as topographic surface markers, was employed to detect individual CFTR molecules. Analysis of erythrocyte plasma membranes taken from healthy donors and CF patients with a homozygous ΔF508 mutation reveals mean (SEM) values of 698 (12.8) (n=542) and 172 (3.8) (n=538) CFTR molecules per red blood cell, respectively. We conclude that erythrocytes reflect the CFTR status of the organism and that quantification of CFTR in a blood sample could be useful in the diagnosis of CFTR related diseases.
Introduction
CFTR is a cAMP-regulated chloride (Cl-) channel (Riordan et al. [Citation1989]) that plays an important role in salt and fluid movement across epithelia (Sheppard & Welsh [Citation1999]). The most predominant mutation, ΔF508, results in defective protein trafficking (Ward et al. [Citation1995]), which manifests in organ pathology (Wine [Citation2003]). For appropriate function CFTR molecules must be correctly incorporated into the cell membrane at sufficient numbers. Knowledge of the number of CFTR molecules per cell is gaining increasing interest since ΔF508 CFTR-rescuing strategies (Pedemonte et al. [Citation2005]) and gene therapy approaches in CF patients (Flotte et al. [Citation2005]) could use this information most effectively. Although considerable attempts have been made to quantify CFTR in cells, conclusions on numbers of CFTR molecules localized in plasma membrane have been indirectly drawn (Penque et al. [Citation2000], Ramalho et al. [Citation2002], Wang et al. [Citation2000]). Atomic force microscopy (AFM) (Binnig et al. [Citation1986]) has the potential to provide information directly (Stroh et al. [Citation2004]), since it provides molecular spatial resolution (Barrera et al. [Citation2005], Hansma et al. [Citation2004]). Recent studies indicate that CFTR is not only found in epithelia but also in human red blood cells (RBC) (Sprague et al. [Citation1998], Sterling et al. [Citation2004], Verloo et al. [Citation2004], Stumpf et al. [Citation2006]). The results of Western blot analysis of RBC membranes (Sterling et al. [Citation2004]) and findings on CFTR dependent hemolysis (Stumpf et al. [Citation2006]) encouraged us to test whether RBC could serve as relevant target cells for CF diagnosis and therapy control. We addressed this question by using single CFTR detection in RBC plasma membrane of healthy donors and CF patients.
We applied a new method for the inside-out plasma membrane isolation of RBC on glass for gaining access to the intracellular portion of CFTR, mainly by two reasons: (i) Specific antibodies are available that are directed against cytoplasmic domains of CFTR, and (ii) Attachment of RBC plasma membrane patches to a solid glass surface overcomes technical AFM limitations that arise from the softness and complex shape of living cells.
Methods
Plasma membrane preparation
RBC attached to poly-L-lysine coated glass were sheared open with a jet stream of isotonic phosphate buffered saline (PBS with 0.2 mM EGTA) (Swihart et al. [Citation2001]). This preparation allows access to the cytoplasmic surface of the membrane where about 80% of the mass of the CFTR protein is protruding into the cell interior accessible to antibodies. The inside-out oriented RBC membrane patches, spread on the glass surface were gently shaken in very low salt buffer (0.3 mM phosphate buffer, 0.2 mM EGTA) at 37°C for 20 min in order to remove hemoglobin and remnant cytoskeletal proteins.
Immunostaining
We fixed the membrane patches by using 4% paraformaldehyde in PBS for 35 min at room temperature. Samples were rinsed three times with blocking solution (3% of bovine serum albumin in PBS) and then incubated in this solution for another 60 min. A highly specific mouse monoclonal antibody against a C-terminal epitope of CFTR (Mendes et al. [Citation2004]) (diluted in blocking solution to 8 µg/ml, Mab 25031 (clone 24-1) R&D Systems Inc., Minneapolis, MN) was added to the membranes and incubated overnight at 4°C. The samples were rinsed five times followed by an incubation step for 1 h at room temperature with anti-mouse-antibody, labeled with nanocrystalline fluorophores, so-called quantum dots (Qdots; Quantum Dot Corp., Hayward, CA). Unbound antibodies were removed by rinsing the samples four times with PBS and, finally, the membrane patches were fixed with 0.5% glutaraldehyde in PBS for 40 min. Immunostaining was visualized using fluorescence microscopy (excitation wave length = 488 nm, emission wavelength = 565 nm). Experiments in which the primary antibody was omitted reveal a negligible unspecific binding of the secondary antibody. Autofluorescence of glutaraldehyde allows the localization of RBC membranes. After localizing the membranes we bleached the autofluorescence by a four-second light (488 nm) pulse, a procedure that does not affect the Qdot-associated fluorescence due to its extraordinary photostability.
Atomic force microscopy
AFM was performed in contact mode using a Nanoscope III Multimode-AFM (Veeco Metrology, Santa Barbara, CA) unless specified. V-shaped oxide sharpened cantilevers with spring constants of 0.06 N/m (Digital Instruments) were used for scanning in air. Images (512×512 pixels) were captured with scan sizes between 1 and 25 µm2 at a scan rate of up to 12 Hz (12 scan lines/s). Images were processed using the Nanoscope software v5.30r2 (Veeco, Santa Babara, CA). Particle counting and 3D presentation were performed with the software SPIP (Scanning probe image processor, Image Metrology, Lyngby, Denmark).
Adhesion forces were obtained by force curve analysis as described previously (Shahin et al. [Citation2006]). In principle, a force curve is a plot of the force sensed by the AFM tip due to the interaction with the sample as a function of tip-sample separation. A Nanoscope III Multimode-AFM was used to collect the force curves. When the AFM tip is retracting from the sample surface, adhesive attraction forces maintain the AFM tip in place causing a ‘downward’ (negative) cantilever deflection. Further retraction finally disrupts this interaction and adherence force can be directly measured from the upward shift of the cantilever.
Results
Membrane preparation and immunostaining
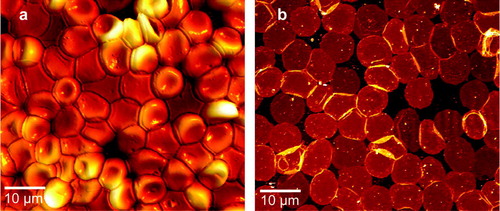
AFM was applied to visualize RBC before (intact RBC) and after (RBC membrane patches) application of shear stress (a, 1b). Membrane patches attached to glass exhibit flat surfaces with circular shapes and diameters of 8.31 (0.106) µm (n=58). For immunostaining we used the Mab 25031 (clone 24-1) (R&D Systems Inc., Minneapolis, MN) monoclonal antibody against the CFTR C-terminus of CFTR.
Figure 1. AFM Images demonstrating the membrane isolation procedure (a) before exposure to shear stress, revealing intact RBC with a height of ∼2 µm adsorbed to glass and (b) after application of the jet stream, resulting in flat inside-out oriented membranes with circular shapes and diameters of ∼8 µm. Heights of the isolated plasma membranes including the protruding membrane proteins were between 10 and 15 nm.
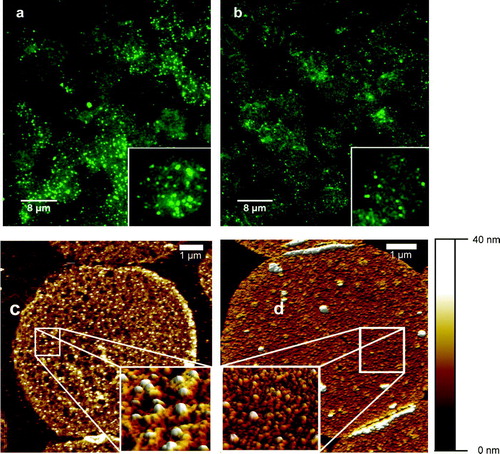
To detect CFTR, we took advantage of the optical properties of Qdots (Stroh et al. [Citation2005]), using them as stable fluorophores. Fluorescence microscopy of the site-specific Qdot-labeled CFTR clearly showed the presence of CFTR in human RBC membranes (a). The weak non-specific autofluorescence of the membranes, due to glutaraldehyde fixation, enabled us to visualize individual RBC membranes. Evidently, membranes obtained from CF patients (b) showed drastically reduced fluorescence. This indicates that ΔF508-CFTR is misprocessed also in RBC, where only a small amount of CFTR reaches the cell surface. The number of individual fluorescence spots localized on the cell membrane is 80.2 (10.23) (n=455) for non-CF and 23.2 (0.64) (n=481) (mean (SEM). This cannot be taken as a realistic estimate for the number of CFTR molecules within a given area since due to the diffraction limitation of fluorescence microscopy two closely positioned Qdots (e.g., ∼200 nm distance) would be detected as one bright spot. Therefore, in order to achieve single molecule detection, our next step was to apply high-resolution AFM to the Qdot-labeled membranes.
Figure 2. Immunostaining of CFTR in isolated RBC membrane patches with Qdot-labeled antibodies. The upper panel represents fluorescence images of non-CF (a) and CF (b) RBC membrane patches. Each inset shows a single membrane with clearly distinguishable bright fluorescence events. The lower panel shows AFM images of non-CF (c) and CF (d) RBC membrane patches. High-resolution zoom-in scans, shown in (c) (1×1 µm) and (d) (1.3×1.3 µm) identify the Qdot as high structures (∼15 nm, color code: white) with specific shapes. It is evident that the number of Qdot-labeled CFTR molecules is much higher in non-CF RBC than in CF RBC.
AFM imaging and particle counting
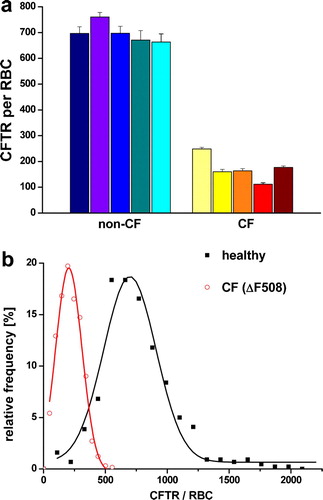
Due to their properties as crystalline particles with defined size, together with the ability to specifically target the protein of interest, the Qdots were used as AFM markers for CFTR localization. Lateral resolution of AFM applied to isolated plasma membranes is sufficient to distinguish structures as proteins (Schillers et al. [Citation2001]), 6 nm gold particles (Schillers et al. [Citation2004]) and Qdots. AFM images showed RBC plasma membranes with densely packed proteins. Single Qdots, positioned on top of the protein layer, were clearly distinguishable (c, 2d). They appeared as uniform structures with a height of ∼15 nm, which is in good correlation with the manufacturer's specification (Quantum Dot Corp., Hayward/CA). Inspection of RBC membranes obtained from CF patients revealed that CFTR molecules are present in much lower density as compared to the CFTR density in RBC membranes obtained from healthy donors (c, 2d). We analysed more than 1000 RBC membranes, obtained from five healthy donors and five CF patients with a homozygous ΔF508 mutation. The number of CFTR per RBC membrane patch was determined and extrapolated to an area of 130 µm2 (equals single erythrocyte plasma membrane area). The mean (SEM) number of CFTR molecules per erythrocyte is 698 (12.8) (n=542) for healthy donors whereas erythrocytes from CF patients contain only 172 (3.8) (n=538) CFTR molecules (a). Further analysis of the data exhibited density histograms with Gaussian distributions for both data sets, CFTR density of healthy donors and CF patients, but indicating a clear shift of the peak value towards smaller densities in the CF group (b). The Gaussian fit of the histogram representing the non-CF RBC showed a peak value of 698 CFTR molecules per erythrocyte (n=542). In contrast, in CF patients the peak value was only 204 CFTR molecules per erythrocyte (n=538).
Adhesion force measurements
Shape and size of Qdots are sometimes similar to membrane proteins or protein complexes, at least in images obtained by AFM. Although Qdots can be usually identified by their regular shape and their superficial localization on the RBC membranes, we looked for another method to clearly distinguish between a membrane protein or a protein complex and a single Qdot. We took advantage from the fact that the AFM is a tactile instrument and thus cannot only visualize surfaces but also can measure adhesion forces between AFM tip and sample surface. This parameter provides information on the intrinsic material properties of the underlying structure (Shahin et al. [Citation2005]). While scanning in air, adhesion between AFM tip and sample largely depends upon hydrophilic interactions. Qdots, due to their specific composition, are less hydrated and therefore less ‘sticky’ for the AFM tip as compared to proteins protruding from the membrane. Adhesion forces were obtained from force-distance measurements as the tip was brought into contact with the sample surface and then pulled off. RBC membrane proteins showed a mean adhesion force of about 19 nN (a), whereas Qdots exhibited an adhesion force of about 4 nN (b). This difference in adhesion force was large enough to clearly distinguish between endogenous membrane proteins and superimposed Qdots.
Figure 3. Adhesion force measurements to distinguish between proteins and Qdots. Force-distance measurements performed on a protein (inset a) and on a Qdot (inset b). The measured adhesion force (indicated by the arrows) between the tip and the protein was 19±0.9 nN (n=50), while the Qdot exhibited an adhesion force of 4±0.3 nN (n=50). Determining the adhesion forces made it possible to distinguish structures with similar heights and shapes.
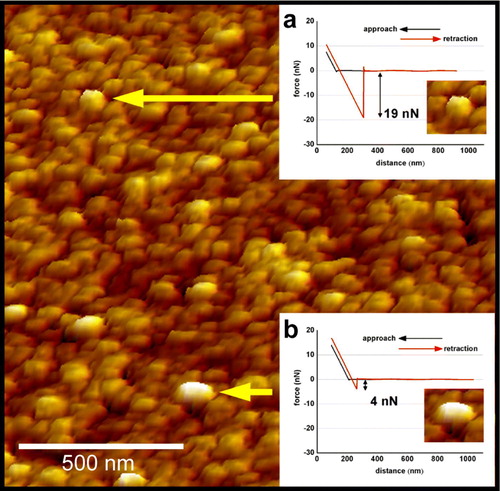
Figure 4. (a) Single molecule counting of Qdot-labeled CFTR molecules. Each column represents one individual showing the mean (±SEM) of 100–120 RBC membrane patches. (b) Summarized histograms revealing Gaussian distribution for the non-CF population (black curve) with a peak value of 698 CFTR molecules per RBC (n=542) and for CF-patients (grey curve and red curve on-line) with a peak value of 204 CFTR molecules per RBC (n=538). Since the isolated membrane patches represent only approximately 40% of the RBC membrane, the results were extrapolated to the total RBC surface area of 130 µm2.
Discussion
The ΔF508 mutation of CFTR results in transport defects of epithelial cells and generates a broad spectrum of organ dysfunctions. Evaluating the fluorescence shows clearly a reduced amount of CFTR in RBC plasma membrane of CF patients compared to that of healthy donors. Counting the fluorescence spots shows a reduction to ∼30% (from 80–23) but the absolute number of CFTR is most likely underestimated due to the limited resolution of optical microscopy. With AFM we found that about 700 CFTR proteins are localized in RBC plasma membrane of healthy donors while in CF patients the number of CFTR molecules per erythrocyte decreases to ∼30% (about 200 CFTR/RBC). Therefore, a fluorescence spot should contain around 10 QDots corresponding to 10 CFTR molecules. Although AFM is capable to resolve even CFTR dimers in native plasma membrane (Schillers et al. [Citation2004]), in the present work we did not address this question.
Although CFTR function has been well described in many cell types and tissues, specific CFTR function in RBC is unknown. There are no major hematological disorders reported for patients with cystic fibrosis except some mild hemolytic anemia. This symptom is most likely due to reduced antioxidative defence (Dominguez et al. [Citation1998]) in CF patients which leads to elevated lipid peroxidation of RBC membranes (Collins et al. [Citation1999]).
It has been discussed recently that in erythrocytes CFTR facilitates a deformation-triggered ATP release while RBC sneak through capillaries (Sprague et al. [Citation1998]). This extracellular ATP should, as a normal physiological response, activate nitric oxid synthesis in neighbouring endothelial cells via purinergic receptors finally followed by vessel dilation. Indeed, it was shown that the pulmonary vascular resistance increases in isolated rabbit lungs perfused with RBC obtained from CF patients (Liang et al. [Citation2005]). Such results strengthen the view that reduced deformation-triggered ATP release leads to an increase in vascular smooth muscle tone and thus, at first sight, seem to be in agreement with the observation that CF patients usually develop pulmonary hypertension. However, pulmonary hypertension is more likely explained as the consequence of chronic inflammatory processes in the respiratory tract while acute changes in either pulmonary or systemic blood pressure have not been described as typical symptoms in the CF patient. Apparently, lack of CFTR does not necessarily affect specific organ function similar as e.g. seen in kidney. There, CFTR is abundantly expressed (Morales et al. [Citation1996]) and plays a role in chloride secretion in distal tubules (Wilson [Citation1999]). In polycystic kidney disease, CFTR causes abnormal fluid secretion into cysts (Wilson [Citation1999]) and CFTR inhibitors retard cyst growth (Li et al. [Citation2004]). Nevertheless, CF patients, lacking CFTR, show no renal phenotype. This apparent lack of ‘importance’ in kidney leads to the assumption that the lack of CFTR is fully compensated by other Cl- channels expressed in renal tissue (Barriere et al. [Citation2004]). A similar scenario could happen also in erythrocytes. Under physiological conditions the normal human erythrocyte membrane exhibits a high permeability for chloride (Bennekou [Citation1984]). A variety of different chloride transport systems including ion channels have been described in RBC membranes (Raftos et al. [Citation1996]) and these, similar as in kidney, may compensate for the reduced number of CFTR.
Sterling (Sterling et al. [Citation2004]) found no difference in CFTR between non-CF and CF using western blot analysis of RBC membranes. He argued that the lack of endoplasmic reticulum and subcellular organelles involved in protein recycling in the mature erythrocyte could have stabilized even the abnormal ΔF508 CFTR in plasma membrane. Our results do not confirm this assumption because we found plasma membrane located CFTR clearly diminished to less than 30% in CF patients. This apparent discrepancy may have technical reasons: A possible advantage of our experimental approach could have been the use of isolated native membranes free of cytoskeleton and membrane associated organelles. AFM allows a direct quality control of the used preparation which is hardly accomplished with a standard biochemical approach. Possibly ΔF508 CFTR in RBC is located intracellularly in a submembrane storage compartment, closely associated with the inner face of the plasma membrane. Then, it is likely that biochemical membrane preparations fail to separate plasma membrane located CFTR from other CFTR sources.
The broad frequency distribution of CFTR in RBC membranes of healthy donors reflects considerable heterogeneity in CFTR density in the single individual as most evident in the immunofluorescence measurements. We assume that the broad CFTR frequency spectrum could reflect the age distribution of circulating RBC. Indeed, it was shown that during erythrogenesis plasma membrane transporters rarify over time (Mairbaurl et al. [Citation2000]). Possibly, CFTR diminishes also during maturation. Assuming that each Qdot, detected by AFM, represents a single CFTR molecule, we determine a CFTR density of ∼5.4 CFTR per µm2 for non-CF RBC and of ∼1.6 CFTR per µm2 for CF RBC.
Disclosure of the absolute number of CFTR located in plasma membrane was possible only by a combination of Qdots with AFM. Qdot labeling allowed us to visualize CFTR sites by fluorescence microscopy while AFM allowed us to count the absolute number of Qdots per area of membrane through physical sensing. This combination allowed for the first time the identification of CFTR in the natural environment of the native RBC membrane at a single-molecule level. The clear difference of CFTR density in RBC membranes between healthy donors and CF patients could lead to new strategies in the diagnosis of CFTR related diseases. Most likely, the number of CFTR molecules that finally reach the plasma membrane is crucial for normal function. Therefore, it is tempting to speculate that the severity of CFTR-related diseases could be directly predicted from the number of CFTR molecules in plasma membrane, possibly at an early age, and thus blood could become a valuable assay system for cystic fibrosis.
This paper was first published online on prEview on 18 May 2006.
The study was supported by the Deutsche Forschungsgemeinschaft (SFB 629 A6 and DFG Re 1284/2-1) and by EU grant Tips4Cells. We thank Wayne Barlow and Dennis Briscoe (Wescor Inc., Logan /UT) for continuous interest in our work.
Related Research Data
References
- Barrera NP, Herbert P, Henderson RM, Martin IL, Edwardson JM. Atomic force microscopy reveals the stoichiometry and subunit arrangement of 5-HT3 receptors. Proc Natl Acad Sci USA 2005; 102: 12595–12600
- Barriere H, Tauc M, Poujeol P. Use of knock-out mouse models for the study of renal ion channels. J Membr Biol 2004; 198: 113–124
- Bennekou P. K + -valinomycin and chloride conductance of the human red cell membrane. Influence of the membrane protonophore carbonylcyanide m-chlorophenylhydrazone. Biochim Biophys Acta 1984; 776: 1–9
- Binnig G, Quate CF, Gerber C. Atomic force microscope. Phys Rev Lett 1986; 56: 930–933
- Collins CE, Quaggiotto P, Wood L, O'Loughlin EV, Henry RL, Garg ML. Elevated plasma levels of F2 alpha isoprostane in cystic fibrosis. Lipids 1999; 34: 551–556
- Dominguez C, Gartner S, Linan S, Cobos N, Moreno A. Enhanced oxidative damage in cystic fibrosis patients. Biofactors 1998; 8: 149–153
- Flotte TR, Schwiebert EM, Zeitlin PL, Carter BJ, Guggino WB. Correlation between DNA transfer and cystic fibrosis airway epithelial cell correction after recombinant adeno-associated virus serotype 2 gene therapy. Hum Gene Ther 2005; 16: 921–928
- Hansma HG, Kasuya K, Oroudjev E. Atomic force microscopy imaging and pulling of nucleic acids. Curr Opin Struct Biol 2004; 14: 380–385
- Li H, Findlay IA, Sheppard DN. The relationship between cell proliferation, Cl- secretion, and renal cyst growth: a study using CFTR inhibitors. Kidney Int 2004; 66: 1926–1938
- Liang G, Stephenson AH, Lonigro AJ, Sprague RS. Erythrocytes of humans with cystic fibrosis fail to stimulate nitric oxide synthesis in isolated rabbit lungs. Am J Physiol Heart Circ Physiol 2005; 288: H1580–H1585
- Mairbaurl H, Schulz S, Hoffman JF. Cation transport and cell volume changes in maturing rat reticulocytes. Am J Physiol Cell Physiol 2000; 279: C1621–C1630
- Mendes F, Farinha CM, Roxo-Rosa M, Fanen P, Edelman A, Dormer R, McPherson M, Davidson H, Puchelle E, De JH, Heda GD, Gentzsch M, Lukacs G, Penque D, Amaral MD. Antibodies for CFTR studies. J Cyst Fibros 2004; 3(Suppl. 2)69–72
- Morales MM, Carroll TP, Morita T, Schwiebert EM, Devuyst O, Wilson PD, Lopes AG, Stanton BA, Dietz HC, Cutting GR, Guggino WB. Both the wild type and a functional isoform of CFTR are expressed in kidney. Am J Physiol 1996; 270: F1038–F1048
- Pedemonte N, Lukacs GL, Du K, Caci E, Zegarra-Moran O, Galietta LJ, Verkman AS. Small-molecule correctors of defective DeltaF508-CFTR cellular processing identified by high-throughput screening. J Clin Invest 2005; 115: 2564–2571
- Penque D, Mendes F, Beck S, Farinha C, Pacheco P, Nogueira P, Lavinha J, Malho R, Amaral MD. Cystic fibrosis F508del patients have apically localized CFTR in a reduced number of airway cells. Lab Invest 2000; 80: 857–868
- Raftos JE, Bookchin RM, Lew VL. Distribution of chloride permeabilities in normal human red cells. J Physiol 1996; 491(Pt 3)773–777
- Ramalho AS, Beck S, Meyer M, Penque D, Cutting GR, Amaral MD. Five percent of normal cystic fibrosis transmembrane conductance regulator mRNA ameliorates the severity of pulmonary disease in cystic fibrosis. Am J Respir Cell Mol Biol 2002; 27: 619–627
- Riordan JR, Rommens JM, Kerem B, Alon N, Rozmahel R, Grzelczak Z, Zielenski J, Lok S, Plavsic N, Chou JL. Identification of the cystic fibrosis gene: cloning and characterization of complementary DNA [published erratum appears in Science 1989 Sep 29;245(4925):1437]. Science 1989; 245: 1066–1073
- Schillers H, Danker T, Madeja M, Oberleithner H. Plasma membrane protein clusters appear in CFTR-expressing Xenopus laevis oocytes after cAMP stimulation. J Membr Biol 2001; 180: 205–212
- Schillers H, Shahin V, Albermann L, Schafer C, Oberleithner H. Imaging CFTR: A tail to tail dimer with a central pore. Cell Physiol Biochem 2004; 14: 1–10
- Shahin V, Hafezi W, Oberleithner H, Ludwig Y, Windoffer B, Schillers H, Kuhn JE. The genome of HSV-1 translocates through the nuclear pore as a condensed rod-like structure. J Cell Sci 2006; 119: 23–30
- Shahin V, Ludwig Y, Schafer C, Nikova D, Oberleithner H. Glucocorticoids remodel nuclear envelope structure and permeability. J Cell Sci 2005; 118: 2881–2889
- Sheppard DN, Welsh MJ. Structure and function of the CFTR chloride channel. Physiol Rev 1999; 79: S23–S45
- Sprague RS, Ellsworth ML, Stephenson AH, Kleinhenz ME, Lonigro AJ. Deformation-induced ATP release from red blood cells requires CFTR activity. Am J Physiol 1998; 275: H1726–H1732
- Sterling KM, Jr, Shah S, Kim RJ, Johnston NI, Salikhova AY, Abraham EH. Cystic fibrosis transmembrane conductance regulator in human and mouse red blood cell membranes and its interaction with ecto-apyrase. J Cell Biochem 2004; 91: 1174–1182
- Stroh C, Wang H, Bash R, Ashcroft B, Nelson J, Gruber H, Lohr D, Lindsay SM, Hinterdorfer P. Single-molecule recognition imaging microscopy. Proc Natl Acad Sci USA 2004; 101: 12503–12507
- Stroh M, Zimmer JP, Duda DG, Levchenko TS, Cohen KS, Brown EB, Scadden DT, Torchilin VP, Bawendi MG, Fukumura D, Jain RK. Quantum dots spectrally distinguish multiple species within the tumor milieu in vivo. Nat Med 2005; 11: 678–682
- Stumpf A, Wenners-Epping K, Walte M, Lange T, Koch HG, Haeberle J, Duebbers A, Falk S, Kiesel L, Nikova D, Bruns R, Bertram H, Oberleithner H, Schillers H. 2006. Physiological concept for a blood based CFTR test. Cell Physiol Biochem 17((1–2)):29–36. E-pub 7 February.
- Swihart AH, Mikrut JM, Ketterson JB, Macdonald RC. Atomic force microscopy of the erythrocyte membrane skeleton. J Microsc 2001; 204: 212–225
- Verloo P, Kocken CH, Van der WA, Tilly BC, Hogema BM, Sinaasappel M, Thomas AW, De Jonge HR. Plasmodium falciparum-activated chloride channels are defective in erythrocytes from cystic fibrosis patients. J Biol Chem 2004; 279: 10316–10322
- Wang F, Zeltwanger S, Hu S, Hwang TC. Deletion of phenylalanine 508 causes attenuated phosphorylation-dependent activation of CFTR chloride channels. J Physiol 2000; 524(Pt. 3)637–648
- Ward CL, Omura S, Kopito RR. Degradation of CFTR by the ubiquitin-proteasome pathway. Cell 1995; 83: 121–127
- Wilson PD. Cystic fibrosis transmembrane conductance regulator in the kidney: Clues to its role?. Exp Nephrol 1999; 7: 284–289
- Wine JJ. Rules of conduct for the cystic fibrosis anion channel. Nat Med 2003; 9: 827–828