Abstract
NalP is an autotransporter secretory protein found in the outer membrane of Neisseria meningitidis. The crystal structure of the NalP translocator domain revealed a transmembrane β-barrel containing a central α-helix. The role of this α-helix, and of the conformational dynamics of the β-barrel pore have been studied via atomistic molecular dynamics simulations. Three simulations, each of 10 ns duration, of NalP embedded within a solvated DMPC bilayer were performed. The helix was removed from the barrel interior in one simulation. The conformational stability of the protein is similar to that of other outer membrane proteins, e.g., OmpA, in comparable simulations. The transmembrane β-barrel is stable even in the absence of the α-helix. Removal of the helix results in an influx of water into the pore region, suggesting the helix acts as a ‘plug’. Water molecules entering the resultant pore form hydrogen bonds with the barrel lining that compensate for the loss of helix-barrel hydrogen bonds. The dimensions of the pore fluctuate over the course of the simulation revealing it to be flexible, but only wide enough to allow transport of the passenger domain in an unfolded or extended conformation. The simulations help us to understand the role of the central helix in plugging the pore and in maintaining the width of the barrel, and show that the NalP monomer is sufficient for the transport of the passenger domain in an unfolded or extended conformation.
Introduction
The cell envelope of Gram negative bacteria is composed of an inner and outer membrane separated by the peptidoglycan-containing periplasm. The proteins of the inner membrane are composed largely of bundles of transmembrane (TM) α-helices, whilst the outer membrane proteins (OMPs) have a β-barrel architecture Citation[1], Citation[2]. Secretion of proteins into the extracellular medium involves transport across two membranes. Several different secretory pathways have evolved in Gram negative bacteria Citation[3–5]. These can be one-step mechanisms, in which the proteins are transported from the cytoplasm into the extracellular medium in a single step, e.g., the type I Citation[6] and type III mechanisms. Other pathways require two steps to complete the transport of proteins across the cell envelope, with transport across the inner membrane in the first step and across the outer membrane in the second step. Two-step pathways require complex machinery to mediate these steps. For example, at least 12 different proteins are required for protein secretion via the type II system Citation[7].
The autotransporter or type V pathway is a relatively simple protein secretion mechanism Citation[8]. All proteins secreted via this mechanism share a common structure, namely: (a) an N-terminal amino signal sequence for transport across the inner membrane; (b) a secreted functional protein, or ‘passenger’ domain; and (c) a C-terminal translocator domain, which forms a pore in the outer membrane. Recently the crystal structure of the translocator domain of the autotransporter NalP (PDB code 1UYN) from Neisseria meningitidis was determined Citation[9]. The structure is a 12-stranded β-barrel with an α-helix which runs through the central pore of the β-barrel (A). The β-barrel has been shown to function as a pore both in vitro and in vivo. Removal of the α-helix results in enhanced pore activity, suggesting the helix may play a role in regulating access to the pore.
Figure 1. (A) Structure of NalP, showing the N-terminal α-helix (blue) and the transmembrane β-barrel (green). (B) Snapshot of simulation system NalP1 showing the protein embedded in a DMPC bilayer with the phosphorus atoms in red. Water molecules have been omitted for clarity. (C) Snapshot of the system at the end of simulation NalP1.
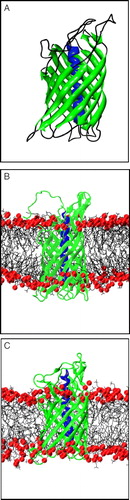
The NalP structure is the first crystal structure of the translocator domain of an autotransporter, and also the first structure of an OMP with an α-helix located within the β-barrel. There have been some suggestions that the structure may be an artefact of the refolding method used for expression of the protein Citation[10]. It is therefore of interest to explore the conformational dynamics of this structure. Molecular dynamics (MD) simulations enable one to study the dynamics of membrane proteins in a lipid bilayer environment Citation[11], Citation[12], and also to the behaviour of complex lipopolysaccharide membranes as models of outer membrane lipids Citation[13]. For example, such simulations have been used to study the translocation abilities of the archaeal translocon SecYEβ Citation[14]. Thus, MD simulations provide an opportunity to compare the dynamics of NalP in the presence and absence of the central helix, providing insights into the role of the helix, and enabling us to compare the conformational stability and dynamics of the translocator domain with that of other OMPs. To this end, in this paper we report the results of three MD simulations of the NalP translocator domain embedded in a DMPC bilayer (B).
Methods
Simulation system
The NalP crystal structure, (1UYN, resolution 2.6 Å) is missing certain residues (943–945 and 1022–1038). These two loops were reconstructed using Modeller 4.10 Citation[15], Citation[16] and the resulting models evaluated using Procheck Citation[17]. Ionizable side-chains within the transmembrane domain were modelled as in their neutral state based on pKA calculations. The simulation setup protocol was similar to that used in previous studies Citation[18], Citation[19]. The NalP orientation in the DMPC bilayer optimized an empirical energy function for interaction of sidechains with a hydrophobic slab of thickness 30 Å (Deol & Sansom, unpublished). This procedure resulted in the helix axis being parallel to the bilayer normal. The NalP models were embedded in a pre-equilibrated DMPC bilayer. The solvent-accessible molecular surface of NalP was used as a template to remove lipids and perform a short steered MD simulation of the solvated protein, using the procedure described in detail by Faraldo-Gomez et al. Citation[20]. This generated a cavity in the DMPC bilayer into which the protein was inserted. Water and counter ions were then added. Ions were added by replacing randomly chosen water molecules. The equilibration stage of energy minimisation and 0.4 ns of protein restrained dynamics was followed by a 10 ns unrestrained MD run.
Simulation protocol
All simulations were performed using the GROMACS 3.14 simulation package (www.gromacs.org) Citation[21] with an extended united atom version of the GROMOS96 force field Citation[22]. All energy minimizations used <1000 steps of steepest descents to relax any steric conflicts generated during setup. During restrained runs all protein non-hydrogen atoms were harmonically restrained with a force constant of 1000 kJ mol−1 nm−2. Long-range electrostatic interactions were treated using the particle mesh Ewald (PME) method Citation[23], Citation[24] with a 1 nm cutoff for the real space calculation. A 1 nm cutoff was used for the van der Waals interactions. All simulations were performed in the constant number of particles, pressure and temperature (NPT) ensemble. The temperature of the protein, lipids, water and ions were coupled separately using the Berendsen thermostat Citation[25] at 310 K with a coupling constant τT=0.1 ps. The pressure was coupled isotropically using the Berendsen barostat at 1 bar with coupling constant τP=1 ps. The timestep for integration was 2 fs. The LINCS algorithm was used to restrain bond lengths Citation[26].
General analysis
Analyses were performed using Gromacs routines and locally written scripts. Secondary structure analyses used DSSP Citation[27]. Pore-like regions within the barrel interior were analysed and visualized using HOLE Citation[28]. Molecular graphics images were generated using VMD Citation[29] and Rasmol Citation[30] as implemented within Rastop (http://www.geneinfinity.org/rastop).
Results
Summary of simulations
Three simulations were performed, each of duration 10 ns (see ). In both NalP1 and NalP2 the intact domain (i.e., including the central α-helix) was used. These systems differed only in that we included crystallographic waters in NalP1, whilst these were omitted from NalP2. To investigate the function of the central helix simulation NalP3 was performed in which this helix was removed from the protein. Crystallographic waters were also removed from the barrel interior.
Table I. Summary of simulations.
Structural drift and fluctuations
Comparison of the structural drift of the protein in the three simulations from their respective starting structures provides information regarding their relative conformational stability on the timescale (10 ns) of the simulations. The structural drift can be evaluated by calculating the root mean square deviation, RMSD, of the Cα atoms from the initial (t=0) structure as a function of time (see ). As can be seen for e.g. simulation NalP1 (A), the all-residue Cα RMSD rose to a plateau of ∼0.46 nm at 2 ns. For the β-barrel Cα atoms the plateau is at ∼0.27 nm. This is somewhat higher than for the β-barrel Cα RMSD in comparable simulations based on the crystal structure of OmpA (∼0.07 nm; Citation[18]) and of OmpT (∼0.1 nm; Citation[31]). The most stable structural element was the central α-helix. This had a final RMSD of ∼0.2 nm. The RMSD for simulation NalP1 is comparable to that for simulation NalP2, suggesting that the presence or absence of crystallographic water within the barrel prior to simulation does not greatly influence the conformational drift. We analysed the centre of mass of the α-helix relative to the β-barrel for both the NalP1 and NalP2 simulations (data not shown). This revealed very little translational movement of the helix during the simulations. The RMSDs for simulation NalP3 (B) however, showed some differences from those for NalP1 and NalP2 suggesting that the removal of the helix does influence the overall conformational stability. The all atom Cα reached a plateau of ∼0.43 nm at 2 ns, which was lower than for NalP1 and NalP2. The lower all atom Cα RMSD arises from the lower RMSD of the loops in NalP3. In contrast, the RMSD of the β-barrel residues (plateau of ∼0.29 nm) of NalP3 was slightly higher, suggesting that removal of the central helix leads to some minor relaxation of the barrel.
Figure 2. Conformation drift of NalP, measured as Cα root mean square deviation (RMSD) from the starting structure. RMSDs vs. time are shown for simulations: (A) NalP1 and (B) NalP3.
The residue-by-residue fluctuations of the simulated structures from the average structure provide a measure of the relative flexibility of different regions of the protein. The time–averaged root mean square fluctuations (RMSFs) of Cα atoms () showed similar trends for both of the models, with the greatest flexibility in the large extracellular loop regions. This is in agreement with simulation studies of OmpA and other OMPs Citation[18], Citation[31], Citation[32]. RMSF values were slightly lower for NalP1 and NalP2 than for NalP3, indicating greater conformational flexibility of the barrel once the helix is removed. Analysis of secondary structure vs. time revealed the overall folds to be stable in all simulations. This provides further evidence, that whilst removal of the helix does have some subtle effects on the barrel, it does not affect its overall stability on the timescale of the simulation. Therefore, on the basis of both the RMSD and RMSF analyses it would appear that the barrel is stable even when the helix is removed.
Figure 3. Fluctuations (measured as the root mean square fluctuation, RMSF, of each Cα atom) as a function of residue number (where residue 1 of the simulation corresponds to residue 786 of the X-ray structure) for simulations NalP1 (black) and NalP3 (grey).
A measure of convergence of the simulations was provided by time block analysis of the mean square fluctuations (MSFs) (data not shown; see Citation[18] for a more detailed description of this method). The results suggest that the simulations have not fully converged (as might be anticipated Citation[33]), but that comparisons between simulations would enable comparison of relative flexibility. Such comparisons of the flexibility of NalP in simulations NalP1 and NalP3, suggested somewhat greater (∼1.3 fold) flexibility when the α-helix was absent.
Pore properties
As discussed above, the mechanism of protein secretion via the autotransporter pathway remains uncertain. Two suggestions for the mechanism of protein secretion via this pathway have been made. In one proposal, the passenger domain is secreted through the monomeric β-barrel of the translocator domain, while in the second model the passenger domain is secreted through a pore located centrally in an oligomeric ring-like structure consisting of six or more β-barrels Citation[34]. In the case of NalP, an understanding of the role played by the central helix would shed some light on the secretion mechanism. For example, it has been reported that there is an increase in the ionic conductance induced in lipid bilayers by NalP when the α-helix is removed Citation[9], suggesting the helix may act as a molecular plug, effectively gating the pore formed by the β-barrel. It was therefore of interest to determine the dimensions of the interior pore and examine any effect of removing the helix.
Pore radius profiles were averaged over all three 10 ns simulations. For simulations NalP1 and NalP2, the helix was deleted after the simulation but prior to calculating the pore profile. This enabled comparison with simulation NalP3 from which the helix was removed prior to the simulation. The pore radius profiles for both simulations NalP1 and NalP2 were very similar (that for NalP1 is shown in ), once again indicating that the initial presence or absence of crystallographic waters made little difference to the subsequent pore dynamics.
Figure 4. (A) Pore radius profiles for the barrel (with the helix removed before radius evaluation for simulation NalP1) of NalP, averaged over the duration of each simulation for NalP1 (black line, ‘intact’) and NalP3 (grey line, ‘no helix’). The horizontal broken line represents the radius of a water molecule. The vertical broken lines represent the approximate extent of the lipid bilayer. (B) Selected trajectories for individual waters along the z axis (i.e., the bilayer normal) for simulation NalP2. Three water molecules are seen to enter the pore region from the periplasmic side (z negative). The horizontal broken lines represent the extent of the lipid bilayer.
Analysis of the fluctuations about the mean pore radius profiles reveals a degree of flexibility in the pore in simulation NalP3, and to a lesser extent in NalP1. The pore dimensions of NalP1 show relatively small fluctuations (∼0.05 nm), which probably correspond to small sidechain motions. Much larger fluctuations are evident in the pore dimensions for simulation NalP3. These largely correspond to motion of residues 29–32 which connect the α-helix to the start of the β-barrel. These motions are not observed in the simulations of NalP1 as this region is directly attached to the α-helix and therefore restricted in its mobility.
As expected, a continuous pore with a radius of >0.15 nm (the approximate radius of a water molecule) runs through the entire length of the β-barrel in structures from all three simulations (having removed the α-helix in NalP1 and NalP2). Assuming an average radius of ∼0.45 nm for a peptide in an extended conformation, and given the average pore radius of NalP of 0.46–0.48 nm (from simulations NalP1 and NalP2), this suggests that the passenger domain of NalP can be readily transported through the barrel if it adopts an extended conformation. The pore is narrower (by 0.05 nm on average in the TM region) in NalP3 and more variable in its dimensions. A degree of narrowing of the pore is evident at the periplasmic and extracellular mouths of the barrel. Movement of the large extracellular loops results in residues forming H-bonds across the pore, thereby creating a barrier to the entry of water molecules. Loop 5 (residues 1013–1038) and Loop 2 fold into the pore, forming a H-bond between Tyr1017 and Glu873. Indeed, Loop 5 is particularly flexible, forming multiple H-bonds across the mouth of the barrel. On the periplasmic side, the narrowing of the pore is largely a result of the enhanced motion of residues 814–816 in the absence of the helix. In particular, H-bonds between Asn815 and Glu1052 and Arg820 lead to narrowing of the pore on the periplasmic side. In NalP1 and NalP2, residues 814–816 are restricted in their mobility by the presence of the α-helix. Thus they are unable to form H-bonds across the periplasmic mouth. The α-helix and four hydrophobic residues (Ala-Ala-Thr-Val) attached to the extracellular end of the α-helix also reduce the flexibility of the extracellular loops. This results in a slightly wider pore in the presence of the α-helix. This suggests that the α-helix may play a role in maintaining the width of the barrel.
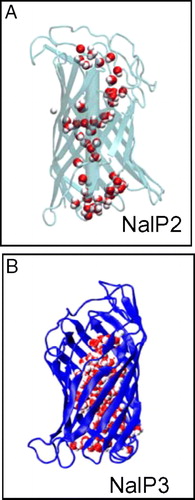
We observed ∼6 and ∼3 water molecules entering the pore region from the periplasmic side in simulations NalP1 and NalP2 respectively. Selected water trajectories for NalP2 are shown in B. However, none was observed entering or exiting the pore from the extracellular side. In the NalP crystal structure, 23 water molecules were present within the β-barrel alongside the helix. In simulation NalP1 there were on average 29 water molecules in this region. It is interesting to note that only ∼3 waters reside within the β-barrel in NalP2, suggesting the presence of water molecules in this region prior to simulation aids the entry of additional waters into the pore region during the simulation. As noted by Oomen et al., charged residues are clustered predominantly on one side of the α-helix Citation[9]. In simulation NalP1, after ∼5 ns an H-bonded column of water is observed between this side of the helix and the wall of the β-barrel. The column extends from the perisplasmic mouth to the extracellular mouth of the β-barrel. There are on average 6 hydrogen bonds between these water molecules. Analysis of the trajectories of the water molecules (data not shown) revealed them to be quite mobile- they formed transient (lifetime ∼50–100 ps) H-bonds with the helix and barrel residues. Two conductances have been reported from measurements of ionic currents flowing through single NalP pores in the presence of 1M KCl: 0.15 nS and 1.3 nS Citation[9]. It has been suggested that the lower conductance (0.15 nS) may arise from ions leaking through the pore alongside the α-helix. The column of water molecules within the β-barrel extends continuously from the periplasmic to the extracellular mouth of the β-barrel on a 10 ns timescale (although they do not enter/leave the pore region from the extracellular side). The presence of the water molecules within the β-barrel and mobility appear to agree with the suggestion of ions leaking alongside the α-helix resulting in the observed 0.15 nS conductance. In contrast, ∼200 waters were observed entering the pore region (from both sides) in simulation NalP3 (i.e. when the helix was removed, B). Whilst most of these remain within the pore throughout the simulation, 4 water molecules are observed to leave the pore, 2 from either side of the bilayer. We have calculated 3D maps of the average of water within the NalP barrel (data not shown). Such analysis reveals a central core of high water density in the pore region in NalP3. For NalP1 and NalP2 the corresponding analysis reveals substantially lower water density in this region. For NalP3 the highest density of water molecules is in the centre of the pore, and the density decreases radially away from the centre towards the pore lining.
Figure 5. Water molecules (red/white) within the barrel of simulations. (A) NalP2 and (B) NalP3. In each case the figure corresponds to the final (10 ns) structure from the simulation. The water molecules are in red/white, the barrel in blue, and the helix in black.
The higher NalP ionic conductance of 1.3 nS was suggested to correspond to a pore radius of ∼0.42 nm, and therefore is most likely to have arisen from an open channel with the helix displaced from the pore. We have calculated a conductance of 1.3 nS from our simulation based on a pore radius of 0.46 nm (using the method described in Citation[35]), which is in good agreement with the estimate of Oomen et al. Citation[9]. (Note that this calculation assumes bulk resistivity for 1 M KCl within the pore, and does not include the correction term suggested by Smart et al. Citation[36]).
While the pore region is somewhat narrower when the helix is removed, the barrel does remain stable throughout simulation NalP3. It is of interest to examine the properties of water within the pore, and in particular to ask whether the pore is sufficiently polar to enable H-bonding of water molecules to the pore lining.
To investigate this we have compared the number of H-bonds between the barrel and the helix (in simulations NalP1 and NalP2) with the number of H-bonds between the barrel and pore waters in simulation NalP3 from which the helix is absent. For, e.g., NalP2, there are on average 17 H-bonds between the barrel and the helix (see A). When the helix is removed in NalP3, after an initial equilibration period, the number of hydrogen bonds between the barrel and pore- water molecules reaches a plateau of ∼40 H-bonds after ∼5 ns of simulation (see B). Analysis of the barrel residues involved in H-bonding with the helix revealed these to be, as expected, mostly polar residues although a number of aromatic residues (tryptophans and tyrosines) also formed H-bonds to the helix. The strongest H-bonds (i.e., those with the longest lifetimes) were formed by Gln834, Lys900 and Gln932. It is interesting to note that these same residues also form strong H-bonds to water molecules in NalP3. Indeed, the residues involved in H-bonding to the helix in NalP1 and NalP2 are generally the same ones that form H-bonds to water molecules in NalP3 (although more barrel residues form H-bonds to water than to the helix). Thus the loss of hydrogen bonds between the helix and the pore are compensated by the formation of hydrogen bonds between water molecules and the pore-lining residues.
Figure 6. H-bonds within the pore. (A) The number of H-bonds vs. time for simulation NalP2, showing barrel-helix (pale grey), helix-water (dark grey), and barrel-water (black) H-bonds. (B) Barrel-water H-bonds vs. time for simulation NalP3.
In the context of possible autotransport mechanisms, the formation of multiple H-bonds between that lining of the pore and water molecules confirms that the NalP β-barrel forms a polar transbilayer pore. The presence of numerous polar and charged sidechains projecting into the lining of the pore provides multiple, conformationally flexible, H-bonding partners available for interaction with an extended conformation polypeptide and/or water molecules. These would be expected to facilitate passage of a polypeptide through the pore formed by the NalP β-barrel.
Discussion
Our results indicate that the crystal structure of the transport domain of NalP is conformationally stable in a phosphatidylcholine bilayer on a 10 ns timescale. For example, the RMSD of NalP in the above simulations is similar to those reported for other outer membrane proteins Citation[11]. The α-helix inside the β-barrel of the NalP TM domain seems to keep the pore in a plugged (gated) state, allowing only a small number of water molecules to ‘leak’ through into the barrel interior. No waters were seen to pass from one side of the bilayer to the other through the NalP β-barrel in the presence of the helix, at least on a 10 ns timescale. Removing the α-helix from the NalP transmembrane domain allows the pore to fill with water. However, this does not seem to destabilize the β-barrel structure, although a small increase in barrel flexibility may occur. The water molecules entering the unplugged barrel form H-bonds with the polar sidechains that form the pore-lining. Thus our simulations are in agreement with recent experimental studies that propose a ‘plug’ role for the α-helix. The nature of protein secretion via the autotransporter pathway remains the subject of some debate Citation[8]. There are two general models: a multimer model, in which translocation occurs through a central pore formed by a ring-like multimer of translocator domains; and a monomer model in which translocation occurs through the β-barrel pore of a single translocator domain. In the multimer model, association of six or more NalP monomers is suggested to form an assembly containing a central pore. However, inspection of the NalP crystal structure reveals that the membrane-exposed surface is hydrophobic, and the simulations reported here indicate that a monomer is stable within the bilayer. Furthermore, we have performed preliminary simulation studies of the possibility of formation of a hexameric assembly of NalP monomers, using a coarse-grained simulation approach Citation[37] that, for example, reproduces self-assembly of glycophorin A transmembrane helix dimers. These studies failed to reveal any propensity for NalP to oligomerize in a bilayer, suggesting that the multimer model for translocation is unlikely. In contrast, extraction of the central α-helix from the NalP transmembrane domain results in a stable pore which permits free movement of water molecules across a lipid bilayer, supporting the monomer model. The dimensions of this pore are consistent with translocation of the passenger domain in an unfolded (i.e., extended) conformation. However, in the absence of oligomerization, it is difficult to envisage how translocation of even an incompletely folded domain could occur through the NalP barrel.
It is useful to reflect upon some methodological limitations of the current simulations. As formerly demonstrated in an earlier study Citation[33], a timescale of 10 ns samples membrane protein motions incompletely. However, in our experience it is sufficient to compare, e.g., the relative flexibility of a β-barrel protein in related simulations, and to explore permeation of water molecules. A further limitation is the use of a simple DMPC lipid bilayer. There have been some studies of LPS membranes Citation[13], Citation[38–40], although such models have yet to be used in conjunction with outer membrane proteins. In future studies it will be of interest to extend simulations to a wider range of outer membrane proteins, and to include more complex (and realistic) models of outer membrane lipids. In this way it should be possible to lay the foundations for a virtual outer membrane, providing further insights into the mechanistic complexities of transport across the outer membrane.
This work was funded by grants from the BBSRC, and the Wellcome Trust. Our thanks to our colleagues, in particular Peter Bond and Timothy Carpenter, for their helpful and insightful comments.
Related Research Data
References
- Koebnik R, Locher KP, Van Gelder P. Structure and function of bacterial outer membrane proteins: barrels in a nutshell. Mol Microbiol 2000; 37: 239–253
- Molloy MP, Herbert BR, Slade MB, Rabilloud T, Nouwens AS, Williams KL, Gooley AA. Proteomic analysis of the Escherichia coli outer membrane. Eur J Biochem 2000; 267: 2871–2881
- Sandkvist M. Biology of type II secretion. Molec Microbiol 2001; 40: 271–283
- Koster M, Bitter W, Tommassen J. Protein secretion mechanisms in Gram-negative bacteria. Int J Med Microbiol 2000; 290: 325–331
- Journet L, Hughes KT, Cornelis GR. Type III secretion: a secretory pathway serving both motility and virulence (review). Mol Membr Biol 2005; 22: 41–50
- Buchanan SK. Type I secretion and multidrug efflux: transport through the TolC channel-tunnel. Trends Biochem Sci 2001; 26: 3–6
- Cianciotto NP. Type II secretion: a protein secretion system for all seasons. Trends Microbiol 2005; 13: 581–588
- Henderson IR, Navarro-Garcia F, Desvaux M, Fernandez RC, Ala'Aldeen D. Type V protein secretion pathway: the autotransporter story. Microbiol Mol Biol Rev 2004; 68: 692–744
- Oomen CJ, van Ulsen P, van Gelder P, Feijen M, Tommassen J, Gros P. Structure of the translocator domain of a bacterial autotransporter. EMBO J 2004; 23: 1257–1266
- Parsons HK, Vitovski S, Sayers JR. Immunoglobulin A1 proteases: a structure-function update. Biochem Soc Transac 2004; 32: 1130–1132
- Bond PJ, Sansom MSP. The simulation approach to bacterial outer membrane proteins. Mol Memb Biol 2004; 21: 151–162
- Ash WL, Zlomislic MR, Oloo EO, Tieleman DP. Computer simulations of membrane proteins. Biochim Biophys Acta 2004; 1666: 158–189
- Lins RD, Straatsma TP. Computer simulation of the rough lipopolysaccharide membrane of Pseudomonas aeruginosa. Biophys J 2001; 81: 1037–1046
- Gumbart J, Schulten K. Molecular dynamics studies of the archael translocon. Biophys J 2006; 90: 2356–2367
- Sali A, Blundell TL. Comparative protein modeling by satisfaction of spatial restraints. J Mol Biol 1993; 234: 779–815
- Fiser A, Kinh Gian Do R, Sali A. Modeling of loops in protein structures. Prot Sci 2000; 9: 1753–1773
- Laskowski RA, Macarthur MW, Moss DS, Thornton JM. Procheck – a program to check the stereochemical quality of protein structures. J Appl Cryst 1993; 26: 283–291
- Bond PJ, Sansom MSP. Membrane protein dynamics vs. environment: simulations of OmpA in a micelle and in a bilayer. J Mol Biol 2003; 329: 1035–1053
- Khalid S, Bond PJ, Deol SS, Sansom MSP. Modelling and simulations of a bacterial outer membrane protein: OprF from Pseudomonas aeruginosa. Proteins: Struct Funct Bioinf 2006; 63: 6–15
- Faraldo-Gómez JD, Smith GR, Sansom MSP. Setup and optimisation of membrane protein simulations. Eur Biophys J 2002; 31: 217–227
- Lindahl E, Hess B, van der Spoel D. GROMACS 3.0: a package for molecular simulation and trajectory analysis. J Molec Model 2001; 7: 306–317
- van Gunsteren WF, Kruger P, Billeter SR, Mark AE, Eising AA, Scott WRP, Huneberger PH, Tironi IG. Biomolecular Simulation: The GROMOS96 Manual and User Guide. Biomos & Hochschulverlag AG an der ETH Zurich, Groningen 1996
- Darden T, York D, Pedersen L. Particle mesh Ewald-an N.log(N) method for Ewald sums in large systems. J Chem Phys 1993; 98: 10089–10092
- Essmann U, Perera L, Berkowitz ML, Darden T, Lee H, Pedersen LG. A smooth particle mesh Ewald method. J Chem Phys 1995; 103: 8577–8593
- Berendsen HJC, Postma JPM, van Gunsteren WF, DiNola A, Haak JR. Molecular dynamics with coupling to an external bath. J Chem Phys 1984; 81: 3684–3690
- Hess B, Bekker H, Berendsen HJC, Fraaije JGEM. LINCS: A linear constraint solver for molecular simulations. J Comp Chem 1997; 18: 1463–1472
- Kabsch W, Sander C. Dictionary of protein secondary structure: pattern-recognition of hydrogen-bonded and geometrical features. Biopolymers 1983; 22: 2577–2637
- Smart OS, Neduvelil JG, Wang X, Wallace BA, Sansom MSP. Hole: A program for the analysis of the pore dimensions of ion channel structural models. J Mol Graph 1996; 14: 354–360
- Humphrey W, Dalke A, Schulten K. VMD-Visual Molecular Dynamics. J Molec Graph 1996; 14: 33–38
- Sayle RA, Milner-White EJ. RasMol: Biomolecular graphics for all. Trends Biochem Sci 1995; 20: 374–376
- Baaden M, Sansom MSP. OmpT: molecular dynamics simulations of an outer membrane enzyme. Biophys J 2004; 87: 2942–2953
- Faraldo-Gómez JD, Smith GR, Sansom MSP. Molecular dynamics simulations of the bacterial outer membrane protein FhuA: a comparative study of the ferrichrome-free and bound states. Biophys J 2003; 85: 1–15
- Faraldo-Gómez JD, Forrest LR, Baaden M, Bond PJ, Domene C, Patargias G, Cuthbertson J, Sansom MSP. Conformational sampling and dynamics of membrane proteins from 10-nanosecond computer simulations. Proteins: Struct Func Bioinf 2004; 57: 783–791
- Veiga E, Sugawara E, Nikaido H, de Lorenzo V, Fernández LA. Export of autotransported proteins proceeds through an oligomeric ring shaped by C-terminal domains. EMBO J 2002; 21: 2122–2131
- Hille B. Ionic channels of excitable membranes, 3rd ed. Sunderland, MA: Sinauer Associates Inc., 2001.
- Smart OS, Breed J, Smith GR, Sansom MSP. A novel method for structure-based prediction of ion channel conductance properties. Biophys J 1997; 72: 1109–1126
- Bond PJ, Sansom MSP. Insertion and assembly of membrane proteins via simulation. J Amer Chem Soc 2006; 128: 2697–2704
- Katowsky M, Sabisch A, Gutberlet T, Bradaczek H. Molecular modelling of bacterial deep rough mutant lipopolysaccharide of Escherichia coli. Eur J Bioch 1991; 197: 707–716
- Shroll RM, Straatsma TP. Molecular structure of the outer bacterial membrane of Pseudomonas aeruginosa via classical simulation. Biopolymers 2002; 65: 395–407
- Shroll RM, Straatsma TP. Molecular basis for microbial adhesion to geochemical surfaces: Computer simulation of Pseudomonas aeruginosa adhesion to goethite. Biophys J 2003; 84: 1765–1772