Abstract
Highly dynamic mitochondrial morphology is a prerequisite for fusion and fission. Mitochondrial fusion may represent a rescue mechanism for impaired mitochondria by exchanging constituents (proteins, lipids and mitochondrial DNA) and thus maintaining functionality. Here we followed for the first time the dynamics of a protein complex of the respiratory chain during fusion and fission. HeLa cells with differently labelled respiratory Complex I were fused and the dynamics of Complex I were investigated. The mitochondrial proteins spread throughout the whole mitochondrial population within 3 to 6 h after induction of cell fusion. Mitochondria of fused cells displayed a patchy substructure where the differently labelled proteins occupied separate and distinct spaces. This patchy appearance was already – although less pronounced – observed within single mitochondria before fusion, indicating a specific localization of Complex I with restricted diffusion within the inner membrane. These findings substantiate the view of a homogenous mitochondrial population due to constantly rearranging mitochondria, but also indicate the existence of distinct inner mitochondrial sub-compartments for respiratory chain complexes.
| Acronyms | ||
| CHX | = | Cycloheximide |
| CI | = | Complex I of the respiratory chain |
| CI-GFP | = | Complex I labelled at its 30 kDa subunit with eGFP (see MM) |
| CI-RFP | = | Complex I labelled at its 30 kDa subunit with DsRed2 (see MM) |
| PEG | = | Polyethylenglycol |
| hFis1 | = | human Fis protein |
| Tom7 | = | subunit 7 of TOM complex |
| CLSM | = | confocal laser scanning microscopy |
| OXPHOS | = | oxidative phosphorylation |
Introduction
Mitochondria are best known as the power stations of the cell. They contain the enzymes of the oxidative phosphorylation (OXPHOS), the major energy source in animal cells, as well as main metabolic reaction cycles. Besides, they take part in many cellular processes including apoptosis (Desagher & Martinou [Citation2000]) and ageing (Sastre et al. [Citation2003]). Mitochondria display variable shapes from small spheres to long tubules, but also branched interconnected networks exist (Bereiter-Hahn [Citation1990]). The dynamic mitochondrial morphology is maintained by the two opposing events of fusion and fission (Bereiter-Hahn & Voth [Citation1994], Rube & van der Bliek [Citation2004]), processes that are found in various cell types from vertebrates, worms, flies and plants to yeast (Westermann [Citation2002], Yaffe [Citation2003]; Arimura et al. [Citation2004], Arimura & Tsutsumi [Citation2005], Okamoto & Shaw [Citation2005]). Fusion and fission activities are normally equalized, thus maintaining a mitochondrial morphology typical for each cell type (Shaw & Nunnari [Citation2002], Jendrach et al. [Citation2005]). Before cytokinesis and also under stress, fragmentation of mitochondria occurs, resulting in small rounded mitochondria (Lyamzaev et al. [Citation2004]). Furthermore fragmentation of mitochondria is also a significant phenotype of apoptotic cells (Perfettini et al. [Citation2005], Scorrano [Citation2005]).
During the last few years many important findings have enlightened the molecular mechanisms of fusion and fission, but the question about the physiological significance of this energy-consuming feature remains. In cell fusion assays, mitochondrial fusion occurs rapidly and is completed within 24 h (Mattenberger et al. [Citation2003]). Chen and co-workers (Chen et al. [Citation2003]) argue that the rate of fusion and fission is much higher than required for maintaining the mitochondrial morphology only. One possible explanation is that fusion and fission of mitochondria ensure physiological and genetic homogeneity within the mitochondrial population (Chida & Ueda [Citation1986]). Complementation of mtDNA mutations by exchange of mtDNA or transcripts in vitro and in vivo emphasize that mitochondrial fusion could act as a rescue mechanism for damaged mitochondria and counteract mtDNA-linked diseases (Enriquez et al. [Citation2000], Nakada et al. [Citation2001], Ono et al. [Citation2001], Sato et al. [Citation2004], Sato & Wilson [Citation2004]). Recently, the significance of massive mitochondrial fusion for a continuous transmission of the (mt)genome during dedifferentiation was demonstrated for plants (Sheahan et al. [Citation2005]).
The complexes of the respiratory chain are the main producers as well as the primary targets of reactive oxygen species (ROS) (Paradies et al. [Citation2002], Choksi et al. [Citation2004], Suh et al. [Citation2004]). Hypothetically, exchange and rearrangement of inner membrane proteins due to mitochondrial fusion and fission could restore functional integrity and therefore provide a rescue mechanism for ROS-damaged proteins (Bejma & Ji [Citation1999], Sastre et al. [Citation2003], Turrens [Citation2003], Therade-Matharan et al. [Citation2004], Zhu et al. [Citation2004], Dhar-Mascareno et al. [Citation2005]). For matrix and outer membrane proteins fast and thorough mixing after mitochondrial fusion has been reported (Ishihara et al. [Citation2003], Chen et al. [Citation2005]). However, proteins of the inner membrane, and the respiratory chain in particular, were not investigated in detail until now (Sesaki et al. [Citation2003]). It is notable that the architecture of the inner membrane with cristae invaginations is far more sophisticated than the outer membrane structure (Mannella et al. [Citation2001]), and recent observations implicate that the outer and inner membrane fuse separately (Meeusen et al. [Citation2004], Malka et al. [Citation2005]). Also the proposed organization of the respiratory chain in a large respiratory complex network complicates the arrangements and possible mobility within the inner membrane (Schagger et al. [Citation2004]).
Thus, we followed the dynamics of the respiratory chain complexes. By fusing cells with differently tagged respiratory Complex I (30 kDa subunit of Complex I) we showed that this respiratory complex of the inner mitochondrial membrane is indeed exchanged quickly and efficiently between fusing mitochondria. The resulting mitochondria, however, display a patchy and heterogeneous pattern, which gives new insights into the dynamics of respiratory chain complexes in the inner mitochondrial membrane.
Materials and methods
Constructs
CI-GFP
The 30 kDa subunit of human respiratory chain Complex I was a gift from Prof. Brandt (Institute of Biochemistry, Medical School, Frankfurt/Main, Germany). The ORF was amplified by PCR with primers CGGAATTCATGGCGGCGGCG and GGGGTACCCTTGGGCATCAGGCTTCTTG and cloned into the EcoRI and KpnI sites of the vector pEGFP-N3 (Clontech) in frame with the EGFP coding sequence, the resulting construct is referred to as CI-GFP.
CI-RFP
The ORF of the 30 kDa subunit was amplified by PCR with primers CGGAATTCATGGCGGCGGCG and GGGGTACCTGCTTGGCATCAGGCTTCTTG, followed by cloning into the BglII and KpnI sites of the vector pDsRed2-N1 (Clontech) resulting in the construct CI-RFP.
CI-mRFP
DsRed2 in CI-RFP was substituted with monomeric DsRed from the vector pDsRed-Monomer-C1 (Clontech).
GFP-TOM7
This was a gift from Michael Ryan, Department of Biochemistry, La Trobe University Victoria/ Australia.
RFP-Fis
This was constructed by amplifying the ORF of hFis1 with primers GAAGATCTGAGGCCGTGCTGAAC and CGGAATTCTCAGGATTTGGACTTG with cDNA of human endothelial cells (HUVEC) as template. Vector pDsRed2-C1 (Clontech) was digested with BglII and EcoRI and the PCR product was cloned into these sites.
GFP-Fis
For cloning of GFP-Fis, the human Fis1 ORF was cut out off plasmid RFP-Fis and cloned into the BglII and EcoRI sites of pEGFP-C1 (Clontech).
Cell culture and transfection
HeLa cells were cultured in Minimal Essential Medium with Earle's salts (GIBCO-BRL) containing 10% (v/v) foetal calf serum and 1% MEM non essential amino acids (Sigma) at 37°C of 5% CO2 and 95% air. Primary XTH2 were isolated from the heart of the tadpole (stage 50) of Xenopus laevis. Cells were kept in Steinberg's Salt Solution and FCS (1:1) at 22°C and an atmosphere of 100% air. Stable cell lines expressing CI-RFP and CI-EGFP were generated and kept in MEM with 800 µM G418 (Gibco).
Electrophoresis and immunological detection
1-D BN-PAGE, and 2-D SDS-PAGE was performed as described but using digitonin (twice the docecylmaltoside standard amount) to preserve respiratory chain supercomplexes (Schagger et al. [Citation1994], Schagger et al. [Citation2004]). Following BN-PAGE gel, strips were placed on a glass plate, wetted with 1% SDS/ 2% mercaptoethanol for one hour, then transferred to a plastic tube, sealed and heated for 30 min in boiling water. The gel strip was then placed on the top of a 10% acrylamide Tricine-SDS-Gel. 2-D SDS-gels were silver stained or blotted onto PVDF membrane for detection with mouse monoclonal antibody C-I-30 (Mitosciences #MS112).
Polyethyleneglycol (PEG)-mediated cell fusion
For the cell fusion assay, stable transfected cells with different fluorescent proteins were co-plated at a 1:1 ratio onto 13-mm round coverslips. Next day cell fusion was induced by 1 min treatment with 50% (v/v) solution of PEG 1450 in MEM, followed by extensive washes in PBS and subsequent culture in MEM supplemented with 10% FCS. 30 min after PEG treatment, coverslips with cells were installed under the microscope. Cycloheximide (CHX) was added to a final concentration of 5×10⁻⁶ M, when indicated.
Microscopy
Mitochondria were visualized using a Leica TCD4 confocal microscope (Leica) or a confocal Zeiss Axiovert 200 microscope Meta 510 (Carl Zeiss) for time series. Images were processed using Imaris (Bitplane) and ImageJ (NIH). For GFP/RFP two-channel screening, the FITC-Cy3 configuration with a DC 488/543; BP 507-530 and LP-580 was used. In principle, the dynamics of fusion are not easy to follow because of the low intensity (due to a volume in the range of the resolution power of a light microscope and of fluorescence bleaching). In addition, movement of mitochondria in z-direction might obscure the visibility of mingling processes. Phototoxicity also may induce swelling of mitochondria and thus impair normal behaviour of the different compartments. Therefore picture series have to be taken using the lowest possible illumination and image processing by deconvolution is required to get sharp contours. Chromatic correction of the objective lenses has to be extremely good as was experimentally proven for the Plan-Apochromat 63x (NA 1.4) used for our investigations.
Electron microscopy
Sample preparation and electron microscopy was performed as described earlier (Jendrach et al. [Citation2005]).
Results
Fluorescence-labelled Complex I is correctly assembled and localized in living cells
For monitoring the dynamics of an inner mitochondrial membrane protein during fusion and fission, the 30 kDa subunit of human respiratory Complex I (NADH:ubichinone oxidoreductase) was labelled with the fluorescent proteins GFP or RFP, resulting in CI-GFP and CI-RFP, respectively. The 30 kDa subunit is one of the few subunits of Complex I that can be tagged without inhibiting assembly of the complex (Zickermann et al. [Citation2003]). After stable transfection of HeLa cells with CI-GFP and CI-RFP respectively, the fluorescent fusion proteins were localized in mitochondria as verified by co-staining with the mitochondria-specific dye MitoTracker (A, A–C). WESTERN blotting on total cell lysates showed that the fusion proteins were correctly expressed and not degraded or cleaved (B). The intra-mitochondrial localization of CI-RFP is clearly different from the localization of the outer membrane protein Tom7, labelled with GFP (C). This is well visible in round-shaped mitochondria (C, arrow), where the green fluorescent outer membrane surrounds a red inner segment. In long tubular mitochondria, however, resolution often is not sufficient enough to dissolve the inner and outer membrane from each other (C, arrowhead).
Figure 1. Respiratory chain Complex I of mitochondria is successfully labelled by its 30 kDa subunit (CI-GFP). (A) Localization of CI-GFP in mitochondria. HeLa cells were stable transfected with CI-GFP resulting in fluorescence labelled mitochondria (AA). The same set of cells was stained MitroTracker Red CMXRos (Molecular Probes) (AB). (AC) Merging of images AA and AB. The fluorescent signals are fully co-distributed, revealing a mitochondrial localization of CI-GFP. Bar: 8 µm. (B) Intact expression of the fusion proteins CI-GFP and GFP-hFis in transfected cell lines. Total cell lysate of HeLa cells transfected with CI-GFP, GFP-hFis and GFP was analysed by Western blot with anti-GFP (Clontech). CI-GFP shows an expected size of 52 kDa (lane 1), hFis-GFP has 40 kDa (lane 2) and GFP has 24 kDa according to the calculated mass (lane 3). No free GFP is detected in lane 1 and 2. (C) CI-RFP localizes differently from the outer membrane protein GFP-Tom7 in mitochondria in cells co-transfected with CI-RFP and GFP-Tom7. Bar: 1 µm. (D) Assembly of CI-GFP and CI-RFP within Complex I of the respiratory chain. 2D-Blue native PAGE was performed using the mild detergent digitonin. In the first dimension complexes and supercomplexes S0–S1 were separated (DA). Silverstaining of the second dimension, where supercomplexes were separated into subunits by Tricine-SDS-PAGE (DB). Western blot of the separated Complex I subunits with anti-CI30kDa showed the signals of CI-GFP and CI-RFP respectively (D–E), which were not detected in non-transfected cells. * = unidentified protein.
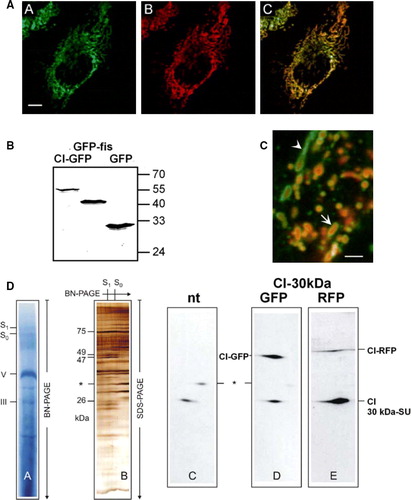
CI-GFP and CI-RFP were successfully assembled into Complex I as proven by 2D-gel electrophoresis (D).
Complex I isolated from transfected cells showed the additional bands according to the size of the CI-GFP and CI-RFP fusion proteins (D, D–E). The signal strength in the WESTERN blot after BN-PAGE separation directly allows the estimation that the ratio of labelled to non-labelled assembled subunit 30kDa is around 3:1 for CI-GFP and less then 1:1 for CI-RFP (D, D and E, respectively). Thus, the recombinant proteins in Complex I do not extremely exceed normal expression levels. On the functional level this was confirmed by FRAP experiments of mitochondria with a matrix-targeted fluorescent protein, two outer membrane proteins (GFP-hFis and GFP-TOM7) and CI-GFP respectively. Recovery of CI-GFP was significantly slower than recovery of the matrix-targeted protein or the outer membrane proteins, pointing to different motilities of these proteins (unpublished results).
Mitochondrial morphology was not influenced by incorporation of CI-GFP or CI-RFP since mitochondria of stable transfected cells maintained their tubular appearance (A). Furthermore, electron microscopy of mitochondria from transfected and non-transfected Hela cells indicated no morphological changes on the submitochondrial level due to overexpression of CI-GFP (data not shown). Cell viability was also not severely impaired: stable transfected HeLa cells displayed only a moderate prolongation of their cell cycle.
Labelled Complex I is exchanged during mitochondrial fusion
To determine whether and how the labelled Complex I is redistributed after fusion of mitochondria, cells expressing CI-GFP and CI-RFP, respectively, were fused by PEG treatment and cellular and subsequent mitochondrial fusion was monitored by two-channel fluorescence screening.
Already 40–50 min after PEG-treatment, mitochondria of fused cells had undergone fusion at the area of their former interface (A), and exhibited now both red and green labelled Complex I (B). During the next hours, these chimeric mitochondria are found throughout fused cells. In some cells, already 1–3 h after cell-fusion a homogenous appearance of the entire mitochondrial population with complete mixing of differently labelled inner membrane proteins was observed (C–D). After 4–6 h the complete mitochondrial population of 90% of fused cells was composed of chimeric mitochondria.
Figure 2. Fusion of mitochondria leads to a homogenous mitochondrial population with patterned chimeric mitochondria. Stable CI-GFP resp. CI-RFP transfected HeLa cells were fused by PEG (see Material and Methods). Subsequent incubation was performed in the presence of 5×10⁻⁶ M cycloheximide (CHX) apart from 2F. Starting from 30 min after PEG treatment, cells were mounted under the confocal laser scanning microscopy (CLSM) and two-colour screening was performed to analyse cellular and mitochondrial fusion. (A) Fusion of differently labelled mitochondria at the fusion interface of two cells 50 min after PEG-treatment. Merging mitochondria are already visible. Bar = 5 µm. (B) More detailed view of fused mitochondria at the fusion interface of two cells 50 min after PEG-treatment. Bar = 1.5 µm. Some hybrid mitochondria display a green-red chequered pattern. (C) 100 min after PEG-treatment all mitochondria of these fused cells had exchanged proteins by mitochondrial fusion. Note the patchy appearance of the mitochondria. Bar = 5 µm. (D) Insert: image C, magnified; the individual mitochondria are clearly red-green chequered. Bar = 1.5 µm. (E) 24 h after PEG-initiated cell fusion the appearance of the hybrid mitochondria is still patchy. Areas of merged green and red fluorescence yield yellow patches. Bar = 1.5 µm. (F) A completed cell fusion 24 h after PEG treatment, but without CHX. Chimeric mitochondria still display a distinct patchy appearance. Bar = 5 µm.: n: nuclei from cells participating in fusion.
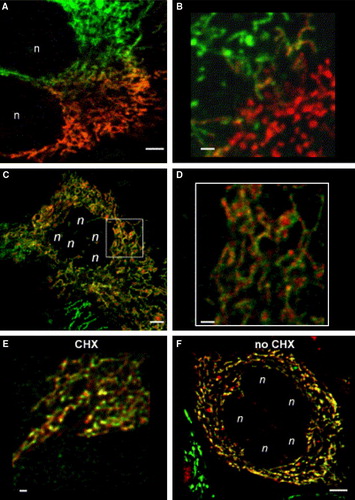
Insertion of freshly synthesized CI-GFP and CI-RFP might mimic mixing of proteins in fused mitochondria. To exclude this putative artefact, cytoplasmic protein synthesis was blocked by addition of 5×10⁻⁶ M cycloheximide (CHX) after cell fusion. Thus, all fluorescent signals within the mitochondria must have derived from protein synthesis before mitochondrial fusion took place. Still, the patchy appearance of mitochondria in CHX treated cells is very pronounced 1 day after cell fusion (E). Without inhibition of protein de novo synthesis, the mitochondrial population looks more homogenous with larger yellow areas after one day, but red and green patches still can be seen (F).
Complex I is localized in patches
The images in clearly depict a rather speckled appearance of fused mitochondria with distinct patches of green and red fluorescence, implicating an arrangement of Complex I in certain loci of the inner membrane. All the images shown in have been subjected to deconvolution, a procedure which may lead to misleading results (Pawley [Citation1995]). To confirm the existence of Complex I in certain mitochondrial loci/compartments, line scans have been taken along the length of single mitochondria in fused cells, and intensity distributions of the different fluorescent proteins have been plotted from raw images only ().
Figure 3. Line plots of fluorescence distribution of Complex I labelled at its subunit 30 kDa in single mitochondria. The fluorescence distribution within single mitochondria varies for both labelled complexes after fusion of differently labelled cells (100 min after cell fusion) but remains separated for at least 1 d, suggesting restriction of motility of Complex I within the inner mitochondrial membrane. (A) Fluorescence distribution of CI-GFP and CI-RFP along the longitudinal axis of a single hybrid mitochondrion 100 min after cell fusion depicted as a line plot. (B) Line plot of the fluorescence signals longitudinal along a single mitochondrion 2 days after co-transfection of cells with CI-GFP and CI-RFP. (C) Fluorescence distribution of labelled Complex I in a single hybrid mitochondrion 1 day after cell fusion with incubation in the presence of protein de novo synthesis inhibitor CHX. (D) Fluorescence distribution of labelled Complex I in a single hybrid mitochondrion 1 day after cell fusion, incubation in the absence of CHX. (E) Fluorescence of CI-mRFP (monomeric) in mitochondria of transfected cells: Line plot of the fluorescence signal longitudinal along a single mitochondrion. (F) Fluorescence of CI-GFP in a single mitochondrion after transfection and staining with MitoTracker Red. Due to the refraction limits of the microscope the real dimensions of the fluorescent structures are no longer revealed, only their position is provided. (G) Fluorescence intensity distribution along a single tubular mitochondrion after transfection with GFP-Tom7, an outer mitochondrial membrane protein. (H) Fluorescence distribution of GFP-hFis1, along a single, tubular mitochondrion. Raw data with no further processing.
A shows the fluorescence intensity distribution of CI-GFP and C-RFP in a single mitochondrion 100 min after fusion of differently transfected cells. Most areas of the mitochondrion with a high GFP fluorescence intensity display a low RFP intensity and vice versa, resulting in an alternating pattern. Thus, intensity curves of raw images confirm the patchy appearance of mitochondria after fusion. The speckled appearance of the fused mitochondria does also not result from optical mismatching of the microscopic imaging procedure as could be exemplified with line scans of mitochondria from cells 48 h after co-transfection with CI-GFP and CI-RFP (B). In these mitochondria the two fluorescence signals exhibited also different fluorescence intensities but their intensity curves are rather synchronous. The different smoothness of the curves derives from the instrumental settings (gain and pinhole) during monitoring due to different brightness levels. A calculation of cross-correlation would lead to erroneous results though.
Line scans of fused mitochondria in CHX-treated cells 1d after fusion confirmed the persistence of patches with different fluorescent intensities (C). Without inhibition of protein synthesis, co-distributed areas with red and green were increased after one day (D, compare F), but also regions with clearly separated fluorescence peaks can be found. Still, conventional confocal microscopy does not allow resolution of different signals throughout a single mitochondrion in z-direction and differently labelled substructures arranged in a stack are not distinguished, contributing a false overlay of signals at a certain z-position. Thus, the extent of different patches is probably higher than presented by this method.
A possible explanation for the patchy appearance and diverse fluorescence intensities could be an agglomeration of labelled proteins due to the tendency of GFP to dimerise (Yang et al. [Citation1996], Zacharias et al. [Citation2002]) and of RFP (DsRed2) to form tetramers (information of the manufacturer). Still, the size of Complex I with almost 1000 kDa (Walker [Citation1992]), would not favour a di- or polymerization because of sterical hindrance. To check the effect of the fluorescent marker protein on the distribution pattern, mitochondria with CI-mRFF, a monomeric variant of red fluorescent protein fused to CI-30 kDa subunit were analysed (E). CI-mRFP, however, displays the same fluorescence distribution along a single mitochondrion like CI-GFP or CI-RFP. This clearly reveals that the inhomogeneous distribution is a consistent feature of Complex I localization, irrespective of the fluorescent protein.
The apparent pattern shows some regularity between 0.5–1 µM in length. Scanning with high magnification and zoom shows that the fluorescence distribution of Complex I differs clearly from that of MitoTrackerRed, a mitochondrial matrix targeted fluorescent dye (F).
For comparison, two outer membrane proteins, GFP-Tom7 and GFP-hFis1, were expressed in HeLa cells. Both proteins show a rather homogenous distribution in the outer mitochondrial membrane, judged by the evaluation of fluorescence intensity distribution along single mitochondria (G and H). In addition, the appearance of GFP-Tom7/CI-RFP chimeric mitochondria after fusion (C), where even the tubular mitochondria do not display the patchy pattern (C, arrowhead) differs clearly from those with CI-RFP/CI-GFP (D).
This underlines our hypothesis that the patchy appearance of Complex I distribution is a feature deriving from the submitochondrial localization of this inner membrane protein complex.
Cristae-arrangements in recently fused mitochondria
Complex III and I of the respiratory chain are found to be organized in supercomplexes and Complex IV can bind weakly to this respirasome (Schagger [Citation2002], Schagger et al. [Citation2004]). A recent model suggests that two Complex IV dimers, one Complex III dimer and one Complex I monomer form the smallest entity of a respirasome (Wittig et al. Citation[submitted]). Since Complex IV, and also III and V are predominantly found in cristae (Perotti et al. [Citation1983], Gilkerson et al. [Citation2003]), it is intriguing that this also holds true for the entire respirasome including Complex I. This physical separation would argue for a restricted diffusion of Complex I through the cristae-junctions, as suggested for Complex III and V (Gilkerson et al. [Citation2003]), and could explain the patchwork pattern and its dynamics as an arrangement of cristae (Bereiter-Hahn [Citation1976], Bereiter-Hahn [Citation1978], Perotti et al. [Citation1983], Scorrano et al. [Citation2002]) (‘certain loci’), bearing differently labelled Complex I. Conventional commercially available fluorescence microscopy to this day is not able to resolve these substructures (Hell et al. [Citation2004], Westphal & Hell [Citation2005]) and dynamics can not by monitored by electron microscopy. To circumvent this problem, and to check, whether cristae transfer during mitochondrial fusion, as our hypothesis suggests, might happen, we have chosen the method of correlative electron microscopy, a combination of light and electron microscopy. For this purpose well spread primary XTH-2 cells with a flat morphology were used. Mitochondria in these cells were observed in the light microscope (phase contrast) for a certain time, the dynamics of a single mitochondrion are shown in the 4 min sequence in .
Figure 4. Ultrastructure of a mitochondrion with known history of generation. (A) Time series (s) of a rearrangement of the mitochondrial tip of a mitochondrion (arrow at t = 0 s), and fusion of two mitochondria in a primary XTH2 cell (arrowhead, A t= fix 248 s), observed by light microscopy (phase contrast). At about 248 s, the cell has been fixed and the mitochondrion was retrieved in the electron microscope. Two consecutive sections are shown (B and C). Bar: 1 µm. (D) Schematic drawing of cristae arrangements within the mitochondrion previously observed by light microscopy. The branch on the lower part derived from the fusion with a different mitochondrion having emerged from the depth. (E) Magnification of the last LM image of series A before fixation and EM analysis.
A mitochondrion is fusing with another one, coming out of the depth of the cell, which therefore has not been well in focus prior to the fusion (arrowhead in , 248 s). Close to the fusion site, a branch has been formed which is not well visible in phase contrast microscopy. At about 248 s the cell has been fixed and the section was retrieved in the electron microscope. The rough course of the cristae had been reconstructed from three consecutive sections, two of them are shown in (B and C). The newly fused mitochondrion exhibits clearly a totally different cristae pattern from the former mitochondrion at the fusion site. At least for some time, it seems that the cristae arrangement in a fused mitochondrion is persistent, giving way to the patchwork appearance of fused mitochondria.
Discussion
The meaning behind mitochondrial dynamics is still speculative. One hypothesis suggests that constant fusion and fission provides a rescue mechanism for impaired mitochondria. Several studies support that – at least on the mtDNA level – complementation of defect respiratory mutants occurs (Enriquez et al. [Citation2000], Nakada et al. [Citation2001], Ono et al. [Citation2001]). However, these processes have a time frame of several days, thus it is rather a long-term mechanism, whereby protein de novo synthesis and cell division are involved in addition. An immediate or short-term rescue mechanism, e.g., to repair ROS-damaged mitochondria, should rather rely on the exchange of proteins between mitochondria due to ongoing fusion and fission. Fast equilibration of outer membrane and matrix proteins after cell and mitochondrial fusion has been shown before (Ishihara et al. [Citation2003], Chen et al. [Citation2005], Malka et al. [Citation2005]), and rapid inner membrane re-organizations have been reported (Bereiter-Hahn [Citation1978]). Mixing of inner membrane protein compounds, especially the complexes of the respiratory chain, was not investigated, though.
Here we addressed whether and how respiratory chain complexes can be exchanged in fusing mitochondria. We monitored the behaviour of respiratory Complex I labelled by its 30 kDa subunit. After fusing cells with differently labelled Complex I, all mitochondria in the syncytium showed a chimeric pattern within 2–5 h due to ongoing fusion and fission. This time frame of a complete exchange of mitochondrial material corresponds to what was known from previous work, where the mobility of fluorescent mitochondrial matrix proteins and their distribution after cell fusion were investigated (Ishihara et al. [Citation2003]). This fast equilibration documents impressively the capability of mitochondrial dynamics to ensure homogenous distribution of mitochondrial proteins (including inner membrane proteins) in the whole mitochondrial population of one cell. Since almost all mitochondria after this time interval possess both types of Complex I, we hypothesize that mitochondria with a damaged respiratory chain under these conditions would not accumulate. Our data rather suggest that mitochondria homogenize due to fusion and fission, supporting the idea of a short-term rescue function of mitochondrial dynamics. This would counteract a possible segregation of healthy and defect mitochondria and is especially interesting with respect to the process of ageing. The mitochondrial theory of ageing suggests that accumulation of defective mitochondria is the central mechanism for the ageing process (Linnane et al. [Citation1989], Kowald et al. [Citation2005]). In postmitotic cells (Jendrach et al. [Citation2005]), fusion and fission rates are strongly reduced and this could indeed contribute to an increased heterogeneity within the mitochondrial population due to reduced exchange of mitochondrial components.
Despite the here observed homogenization of the mitochondrial population, single chimeric mitochondria displayed a rather heterogeneous, patterned distribution of Complex I. Red and green patches coexisted for at least 24 h. Since the sensitivity of the microscopes used is not sufficient to detect and distinguish single labelled molecules, the distinct patterns represent larger assemblies. The arrangement of respiratory chain complexes in discrete domains within membranes is known for bacteria, but their dynamic behaviour includes fast diffusion and equilibration (Johnson et al. [Citation2004]). Second, the inner membrane of mitochondria is distinct from that of bacteria: it is not a homogeneous, two-dimensional lipid layer but a complex three-dimensional architecture with cristae-invaginations, cristae-junctions and an inner membrane boundary. Since the cristae space is thought to be the site of oxidative phosphorylation (Gilkerson et al. [Citation2003]), and cristae are separated from the inner membrane boundary by cristae junctions, the complete equilibration of respiratory chain complexes due to constant fusion and fission of mitochondria is doubtable (Frey et al. [Citation2002]). Furthermore, respiratory complexes are obviously arranged in supercomplexes – according to the respirasome theory developed by Schagger and co-workers (Schagger et al. [Citation2004]) – and this might further restrict their mobility and complete mixing.
Thus, we suggest as a working hypothesis that Complex I is predominantly localized in cristae like Complex III and Complex V (Gilkerson et al. [Citation2003]). The observed fluorescence pattern after fusion can be explained by a cristae-arrangement, where single cristae bear Complex I with the same label, but different cristae in chimeric mitochondria have differently labelled Complex I. The fluorescent pattern observed in the line scans () would therefore reflect the pattern of those differently labelled cristae. Since HeLa cells possess sparse and little cristae (Malka et al. [Citation2005]) (and our own observations), this pattern is clearly visible. In contrast, line plot analysis of Complex I fluorescence in HUVEC mitochondria showed a far more homogenous distribution of the fluorescent signal along the longitudinal axis due to the high number of cristae in mitochondria of these cells (results not shown).
We thus favour the idea that the patches of separated colours represent single or a few cristae bearing differently labelled Complex I. Patches that appeared yellow might result either from superimposition of closely adjacent cristae of different mitochondrial origin (i), differently labelled cristae on top of each other, which could not be resolved by conventional confocal microscopy (ii), or indeed fused cristae having mixed their protein constituents (iii). Cristae dynamics in the form of remodelling is known to happen at least in apoptosis (Reed & Green [Citation2002], Scorrano [Citation2005]) and also our retrieval studies of fused mitochondria with EM support the model that entire cristae or cristae packages are transmitted and re-arranged during mitochondrial fusion. A restricted diffusion between the cristae space and the inner boundary membrane might contribute to the long-lasting patchiness. This patchwork distribution we found here still might be unique for Complex I, but data from literature support the idea of an inhomogeneous distribution of the respiratory chain complexes within mitochondria in general.
Summing up, our work on mitochondrial dynamics of Complex I showed that, indeed, the whole mitochondrial population of a cell mixes within a few hours, but exchange of proteins between different inner membrane substructures (possibly cristae or respirasomes) is a very slow process if it occurs at all.
The first stages of this work were supported by a grant from DFG Be423/23-2. Later support was received from EU Integrated Project MiMage CT 2004-512020. The cDNA for C1-30kDa was kindly provided by U. Brandt. The cDNA for EGFP-Tom7 was a kind gift from M. Ryan. We thank Monika Voeth for excellent technical assistance.
Related Research Data
References
- Arimura S, Tsutsumi N. [Plant mitochondrial fission and fusion]. Tanpakushitsu Kakusan Koso 2005; 50: 1875–1878
- Arimura S, Yamamoto J, Aida GP, Nakazono M, Tsutsumi N. Frequent fusion and fission of plant mitochondria with unequal nucleoid distribution. Proc Natl Acad Sci USA 2004; 101: 7805–7808
- Bejma J, Ji LL. Aging and acute exercise enhance free radical generation in rat skeletal muscle. J Appl Physiol 1999; 87: 465–470
- Bereiter-Hahn J. Beziehungen von Feinstruktur und mitochondrialer Formgebung. Cytobiologie 1976; 12: 429–439
- Bereiter-Hahn J. Intracellular motility of mitochondria: Role of the inner compartment in migration and shape changes of mitochonria in XTH-cells. J Cell Sci 1978; 30: 99–115
- Bereiter-Hahn J. Behavior of mitochondria in the living cell. Int Rev Cytol 1990; 122: 1–63
- Bereiter-Hahn J, Voth M. Dynamics of mitochondria in living cells: shape changes, dislocations, fusion, and fission of mitochondria. Microsc Res Tech 1994; 27: 198–219
- Chen H, Chomyn A, Chan DC. Disruption of fusion results in mitochondrial heterogeneity and dysfunction. J Biol Chem 2005; 280: 26185–26192
- Chen H, Detmer SA, Ewald AJ, Griffin EE, Fraser SE, Chan DC. Mitofusins Mfn1 and Mfn2 coordinately regulate mitochondrial fusion and are essential for embryonic development. J Cell Biol 2003; 160: 189–200
- Chida Y, Ueda K. Mitochondrial number and form change during autospore formation in chlorococcum-infusionum (Schrank) Meneghini (Chlorococcales, Chlorophyta). Phycologia 1986; 25: 503–509
- Choksi KB, Boylston WH, Rabek JP, Widger WR, Papaconstantinou J. Oxidatively damaged proteins of heart mitochondrial electron transport complexes. Biochim Biophys Acta 2004; 1688: 95–101
- Desagher S, Martinou JC. Mitochondria as the central control point of apoptosis. Trends Cell Biol 2000; 10: 369–377
- Dhar-Mascareno M, Carcamo JM, Golde DW. Hypoxia-reoxygenation-induced mitochondrial damage and apoptosis in human endothelial cells are inhibited by vitamin C. Free Radic Biol Med 2005; 38: 1311–1322
- Enriquez JA, Cabezas-Herrera J, Bayona-Bafaluy MP, Attardi G. Very rare complementation between mitochondria carrying different mitochondrial DNA mutations points to intrinsic genetic autonomy of the organelles in cultured human cells. J Biol Chem 2000; 275: 11207–11215
- Frey TG, Renken CW, Perkins GA. Insight into mitochondrial structure and function from electron tomography. Biochim Biophys Acta 2002; 1555: 196–203
- Gilkerson RW, Selker JM, Capaldi RA. The crystal membrane of mitochondria is the principal site of oxidative phosphorylation. FEBS Lett 2003; 546: 355–358
- Hell SW, Dyba M, Jakobs S. Concepts for nanoscale resolution in fluorescence microscopy. Curr Opin Neurobiol 2004; 14: 599–609
- Ishihara N, Jofuku A, Eura Y, Mihara K. Regulation of mitochondrial morphology by membrane potential, and DRP1-dependent division and FZO1-dependent fusion reaction in mammalian cells. Biochem Biophys Res Commun 2003; 301: 891–898
- Jendrach M, Pohl S, Voth M, Kowald A, Hammerstein P, Bereiter-Hahn J. Morpho-dynamic changes of mitochondria during ageing of human endothelial cells. Mech Ageing Dev 2005; 126: 813–821
- Johnson AS, van Horck S, Lewis PJ. Dynamic localization of membrane proteins in Bacillus subtilis. Microbiology 2004; 150: 2815–2824
- Kowald A, Jendrach M, Pohl S, Bereiter-Hahn J, Hammerstein P. On the relevance of mitochondrial fusions for the accumulation of mitochondrial deletion mutants: A modelling study. Aging Cell 2005; 4: 273–283
- Linnane AW, Marzuki S, Ozawa T, Tanaka M. Mitochondrial DNA mutations as an important contributor to ageing and degenerative diseases. Lancet 1989; 1: 642–645
- Lyamzaev KG, Pletjushkina OY, Saprunova VB, Bakeeva LE, Chernyak BV, Skulachev VP. Selective elimination of mitochondria from living cells induced by inhibitors of bioenergetic functions. Biochem Soc Trans 2004; 32: 1070–1071
- Malka F, Guillery O, Cifuentes-Diaz C, Guillou E, Belenguer P, Lombes A, Rojo M. Separate fusion of outer and inner mitochondrial membranes. EMBO Rep 2005; 6: 853–859
- Mannella CA, Pfeiffer DR, Bradshaw PC, Moraru II, Slepchenko B, Loew LM, Hsieh CE, Buttle K, Marko M. Topology of the mitochondrial inner membrane: dynamics and bioenergetic implications. IUBMB Life 2001; 52: 93–100
- Mattenberger Y, James DI, Martinou JC. Fusion of mitochondria in mammalian cells is dependent on the mitochondrial inner membrane potential and independent of microtubules or actin. FEBS Lett 2003; 538: 53–59
- Meeusen S, McCaffery JM, Nunnari J. Mitochondrial fusion intermediates revealed in vitro. Science 2004; 305: 1747–1752
- Nakada K, Inoue K, Ono T, Isobe K, Ogura A, Goto YI, Nonaka I, Hayashi JI. Inter-mitochondrial complementation: Mitochondria-specific system preventing mice from expression of disease phenotypes by mutant mtDNA. Nat Med 2001; 7: 934–940
- Okamoto K, Shaw JM. Mitochondrial morphology and dynamics in yeast and multicellular eukaryotes. Annu Rev Genet 2005; 39: 503–536
- Ono T, Isobe K, Nakada K, Hayashi JI. Human cells are protected from mitochondrial dysfunction by complementation of DNA products in fused mitochondria. Nat Genet 2001; 28: 272–275
- Paradies G, Petrosillo G, Pistolese M, Ruggiero FM. Reactive oxygen species affect mitochondrial electron transport complex I activity through oxidative cardiolipin damage. Gene 2002; 286: 135–141
- Pawley JB. Handbook of biological confocal microscopy. Plenum Press, New York 1995; 632
- Perfettini JL, Roumier T, Kroemer G. Mitochondrial fusion and fission in the control of apoptosis. Trends Cell Biol 2005; 15: 179–183
- Perotti ME, Anderson WA, Swift H. Quantitative cytochemistry of the diaminobenzidine cytochrome oxidase reaction product in mitochondria of cardiac muscle and pancreas. J Histochem Cytochem 1983; 31: 351–365
- Reed JC, Green DR. Remodeling for demolition: changes in mitochondrial ultrastructure during apoptosis. Mol Cell 2002; 9: 1–3
- Rube DA, van der Bliek AM. Mitochondrial morphology is dynamic and varied. Mol Cell Biochem 2004; 256–257: 331–339
- Sastre J, Pallardo FV, Vina J. The role of mitochondrial oxidative stress in aging. Free Radic Biol Med 2003; 35: 1–8
- Sato A, Nakada K, Shitara H, Yonekawa H, Hayashi J. In vivo interaction between mitochondria carrying mtDNAs from different mouse species. Genetics 2004; 167: 1855–1861
- Sato S, Wilson RJ. The use of DsRED in single- and dual-color fluorescence labeling of mitochondrial and plastid organelles in Plasmodium falciparum. Mol Biochem Parasitol 2004; 134: 175–179
- Schagger H. Respiratory chain supercomplexes of mitochondria and bacteria. Biochim Biophys Acta 2002; 1555: 154–159
- Schagger H, Cramer WA, von Jagow G. Analysis of molecular masses and oligomeric states of protein complexes by blue native electrophoresis and isolation of membrane protein complexes by two-dimensional native electrophoresis. Anal Biochem 1994; 217: 220–230
- Schagger H, de Coo R, Bauer MF, Hofmann S, Godinot C, Brandt U. Significance of respirasomes for the assembly/stability of human respiratory chain complex I. J Biol Chem 2004; 279: 36349–36353
- Scorrano L. Proteins that fuse and fragment mitochondria in apoptosis: con-fissing a deadly con-fusion?. J Bioenerg Biomembr 2005; 37: 165–170
- Scorrano L, Ashiya M, Buttle K, Weiler S, Oakes SA, Mannella CA, Korsmeyer SJ. A distinct pathway remodels mitochondrial cristae and mobilizes cytochrome c during apoptosis. Dev Cell 2002; 2: 55–67
- Sesaki H, Southard SM, Yaffe MP, Jensen RE. Mgm1p, a dynamin-related GTPase, is essential for fusion of the mitochondrial outer membrane. Mol Biol Cell 2003; 14: 2342–2356
- Shaw JM, Nunnari J. Mitochondrial dynamics and division in budding yeast. Trends Cell Biol 2002; 12: 178–184
- Sheahan MB, McCurdy DW, Rose RJ. Mitochondria as a connected population: ensuring continuity of the mitochondrial genome during plant cell dedifferentiation through massive mitochondrial fusion. Plant J 2005; 44: 744–755
- Suh SK, Hood BL, Kim BJ, Conrads TP, Veenstra TD, Song BJ. Identification of oxidized mitochondrial proteins in alcohol-exposed human hepatoma cells and mouse liver. Proteomics 2004; 4: 3401–3412
- Therade-Matharan S, Laemmel E, Duranteau J, Vicaut E. Reoxygenation after hypoxia and glucose depletion causes reactive oxygen species production by mitochondria in HUVEC. Am J Physiol Regul Integr Comp Physiol 2004; 287: R1037–1043
- Turrens JF. Mitochondrial formation of reactive oxygen species. J Physiol 2003; 552: 335–344
- Walker JE. The NADH:ubiquinone oxidoreductase (complex I) of respiratory chains. Q Rev Biophys 1992; 25: 253–324
- Westermann B. Merging mitochondria matters: cellular role and molecular machinery of mitochondrial fusion. EMBO Rep 2002; 3: 527–531
- Westphal V, Hell SW. Nanoscale resolution in the focal plane of an optical microscope. Phys Rev Lett 2005; 94: 143903
- Wittig I, Carroazo R, Santorelli FM, Schugger H. 2006. Supercomplexes and subcomplexes of mitochondrial oxidative phosphorylation. BBA (In press).
- Yaffe MP. The cutting edge of mitochondrial fusion. Nat Cell Biol 2003; 5: 497–499
- Yang F, Moss LG, Phillips GN, Jr. The molecular structure of green fluorescent protein. Nat Biotechnol 1996; 14: 1246–1251
- Zacharias DA, Violin JD, Newton AC, Tsien RY. Partitioning of lipid-modified monomeric GFPs into membrane microdomains of live cells. Science 2002; 296: 913–916
- Zhu X, Raina AK, Lee HG, Casadesus G, Smith MA, Perry G. Oxidative stress signalling in Alzheimer's disease. Brain Res 2004; 1000: 32–39
- Zickermann V, Bostina M, Hunte C, Ruiz T, Radermacher M, Brandt U. Functional implications from an unexpected position of the 49-kDa subunit of NADH:ubiquinone oxidoreductase. J Biol Chem 2003; 278: 29072–29078