Abstract
Pep-1 is a cell-penetrating peptide (CPP) with the ability to translocate across biological membranes and introduce active proteins inside cells. The uptake mechanism used by this CPP is, as yet, unknown in detail. Previous results show that such a mechanism is endocytosis-independent and suggests that physical-chemical interactions between the peptide and lipid bilayers govern the translocation mechanism. Formation of a transmembrane pore has been proposed but this issue has always remained controversial. In this work the secondary structure of pep-1 in the absence/presence of lipidic bilayers was determined by CD and ATR-FTIR spectroscopies and the occurrence of pore formation was evaluated through electrophysiological measurements with planar lipid membranes and by confocal microscopy using giant unilamellar vesicles. Despite pep-1 hydrophobic domain tendency for amphipathic α-helix conformation in the presence of lipidic bilayers, there was no evidence for membrane pores in the presence of pep-1. Furthermore, alterations in membrane permeability only occurred for high peptide/lipid ratios, which induced the complete membrane disintegration. Such observations indicate that electrostatic interactions are of first importance in the pep-1-membrane interactions and show that pores are not formed. A peptide-lipid structure is probably formed during peptide partition, which favours peptide translocation.
Introduction
Whilst the introduction of hydrophilic molecules into mammalian cells is controlled by the lipid membrane barrier, the use of cell-penetrating-peptides (CPPs) has become a good strategy to overcome the membrane impermeability. A CPP is a short, basic and water-soluble, peptide able to translocate through cell membranes, with high efficiency and low toxicity, in a way independent on receptors Citation[1], Citation[2].
Despite their potential for drug delivery, the mechanism used by CPPs to translocate across the cell membrane, without damaging it, is still a mystery. A single general mechanism for all does not seem reasonable and more than one mechanism for each individual peptide is a possibility Citation[2–4]. Nonetheless, the existence of the basic amino acid residues in all the peptides suggests that the electrostatic interaction with phospholipid bilayers is a common step in the mechanism of action of CPPs.
Many CPPs including penetratin, TAT and oligoarginines are internalized by an endocytotic pathway (so-called ‘energy-dependent’ mechanism) Citation[2–4]. However, the strong correlation of uptake with lipid-binding affinity, the direct observation of translocation in model membranes, and the importance of electrostatic interactions, suggests that a translocation mechanism involving only direct physical interactions with lipids can operate for some peptides Citation[1].
Pep-1 (Ac-KETWWETWWTEWSQPKKKRKV-cysteamine) is a chimeric CPP with a primary amphipathicity, which can be divided into three domains: (i) a so-called hydrophobic domain (KETWWETWWTEW), responsible for hydrophobic interactions with proteins and for an interaction with the cell membrane; (ii) a hydrophilic Lys-rich domain derived from the nuclear localization signal (NLS) of simian virus 40 (SV-40) large T antigen (KKKRKV), required to improve solubility and intracellular distribution of the peptide, and (iii) a spacer domain (SQP) which improves the flexibility and the integrity of the other two domains. This CPP has advantages relative to the others because it does not need covalent link with the cargo Citation[5]; physical assemblies between peptide and macromolecules, stabilized by hydrophobic and electrostatic interactions, are formed Citation[6].
Our previous works demonstrated that pep-1 is able to translocate in vitro or in vivo by a physical-mediated mechanism promoted by transmembrane potential Citation[6], Citation[7], with no evidences for any alternative ‘energy-dependent’ process Citation[6]. The high efficiency of the peptide to be translocated by an ‘energy-independent’ process seems to be related to its primary amphipathicity, which is responsible for the high affinity for lipidic membranes Citation[8]. Furthermore, it has been shown that the C-terminal cysteamine group is relevant for membrane affinity and translocation efficiency Citation[8–10].
A variety of models have been suggested to describe an ‘energy-independent’ pathway for the translocation of CPPs (recently reviewed in references Citation[1], Citation[11]) and a possible mechanism is pore formation. In our previous studies, with model membranes, no evidence for pore formation was detected in the presence of pep-1 Citation[7] and this result was confirmed by Weller et al. Citation[10]. However, this issue remains very controversial as electrophysiological studies using oocyte membrane Citation[12] suggest that a transmembrane pore-like structure could be formed, mediated by pep-1 conformational changes.
The main aim of the present work is to find out if pore formation occurs and is a relevant mechanism for pep-1 translocation. Attenuated total reflection-Fourier transform infrared (ATR-FTIR) spectroscopy was performed in order to identify the peptide conformation and its orientation when inserted in the membrane Citation[13]. The pore formation hypothesis was tested by electrophysiological measurement in Planar Lipid Membranes (PLMs) Citation[14] and by confocal microscopy using Giant Unilamellar Vesicles GUVs Citation[15].
Material and methods
Reagents
Pep-1 with purity >95% was produced by custom synthesis by GenScript Corporation (Piscataway, New Jersey). Synthetic lipids 1-Palmitoyl-2-Oleoyl-sn-Glycero-3-Phosphocholine (POPC), 1-Palmitoyl-2-Oleoyl-sn-Glycero-3-(Phospho-rac-(1-glycerol)) (POPG), 1,2-Dipalmitoyl-sn-Glycero-3-phosphocholine (DPPC), 1,2-Diphytanoyl-sn-Glycero-3-phosphocholine (DPhPC) and 1,2-Dipalmitoyl-sn-Glycero-3-Phosphoethalonamine-N-(Lissamine Rhodamine B Sulfonyl) (N-Rh-PE), were obtained from Avanti polar lipids (Alabaster, Alabama). Cholesterol (Chol) and Thioflavin T (ThT) were from Sigma-Aldrich (St. Louis, Missouri). Alexa Fluor633 C5-maleimide (Mr∼1300), Alexa Fluor546- Dextran (Mr∼10000) Alexa Fluor488-Dextran (Mr∼3000) and 1,1'-dioctadecyl-3,3,3',3'-tetramethylindocerbocyanine perchlorate (DiIC18) were purchased from Molecular Probes (Eugene, Oregon).
The samples were prepared in 10 mM HEPES buffer with 150mM NaCl and pH 7.4, unless stated otherwise.
Circular Dichroism (CD) measurements
CD spectra were recorded for 68.8 µM pep-1 in aqueous solution or in the presence of lipid. 1 mM of POPC or POPC:Chol (2:1 molar) large unilamellar vesicles (LUVs), prepared by the extrusion method Citation[16], were used for these studies (peptide/lipid molar ratio = 0.069). Samples with negatively-charged lipids (e.g., POPG down to 20%) were not possible to prepare due to aggregation of vesicles induced by pep-1 at these peptide/lipid ratios (see Citation[8]), which are mandatory to perform spectra with good S/N ratios. Samples were prepared in 10 mM phosphate buffer with 75 mM NaF, pH 7.5. The CD measurements were made on a Jasco J-810 Circular Dichroism Spectropolarimeter equipped with a Julabo F25-HE Temperature Unit Control in a quartz cell with an optical path of 0.1 cm at 20°C. Wavelengths from 260 to 185 nm were recorded with a 0.1 nm step and a 20 nm/min speed. Spectra were collected and averaged over 3 scans and corrected for background contributions. Molar absorptivity was calculated considering ε = 1.8×10⁴ M−1cm−1 (data not shown). Computer fittings using the Jasco software package JWSSE-480 with the CD reference dataset of Yang Citation[17] were performed to estimate the contributions of spectral components from different secondary structures.
ATR-FTIR spectroscopy
Attenuated total reflection infrared (ATR-FTIR) spectra were obtained on a Bruker Equinox 55 FTIR spectrophotometer (Ettlingen, Germany) equipped with a MCT detector (broad band 12000-420 cm−1, liquid N2 cooled, 24 h hold time) at a resolution of 2cm−1. The spectrometer was continuously purged with dry air (Whatman 75–62, Haverhill, MA, USA). The internal reflection element was a 52×20×2 mm trapezoidal germanium ATR plate (ACM, Villiers St Frédéric, France) with an aperture angle of 45° yielding 25 internal reflections. A total of 128 scans (800–4000cm−1) were averaged for each spectrum with a resolution of 2cm−1. The spectrophotometer was continuously purged. Background of the internal reflection element was collected and subtracted to the samples. Peptide samples in the absence/presence of lipid were prepared with 10 mM HEPES buffer pH 7.4 and spread on the Ge plate under a stream of N2 to evaporate the solvent (see Citation[18] for further information).
Secondary structure of the pep-1, in absence and in the presence of membranes with various lipidic compositions: POPC, POPC:Chol (2:1 molar) and DPPC, was evaluated (negatively-charged phospholipids could not be used due to precipitation caused by pep-1, as stated above). After liposome formation, pep-1 was added to the solution to obtain a final peptide concentration of 20% (w/w) and mixed in vortex; the lipidic concentration was maintained at 2 mg/mL (∼2.6 mM, depending on the exact lipid molar mass) and the peptide concentration at 0.4 mg/mL (0.138 mM, peptide/lipid molar ratio = 0.053). A film with 8 µg peptide + 40 µg lipid was prepared by spreading the peptide/lipid solution on the Ge plate. The kinetic of peptide deuteration was evaluated; non-deutered and deutered samples were compared.
The determination of protein secondary structures was performed using a curve-fitting procedure, where the amide I band was decomposed into the various component bands which can be assigned to the different types of secondary structure. First the band positions were determined by deconvolution using a Lorentzian deconvolution function (FWHH = 30), a Gaussian apodization function (FWHH = 15) and a 2cm−1 resolution enhancement. The amide I was fitted with bands placed at the positions found and the integrated absorbance of the component bands was calculated. The components bands were assigned to secondary structures comparing the results with data presented in different references Citation[19–23].
Orientation of the secondary structure
ATR-FTIR Spectroscopy provides information on the orientation of peptides inserted in lipid bilayers Citation[18], Citation[23]. Peptide spectra were recorded with parallel and perpendicular polarized incident light at the same conditions as non-polarized spectra (see above). With polarized light it is possible to determine the dichroic spectra (see Supplementary Figure S.2 in the Online version for results obtained with pep-1) and the dichroic ratio (RATR) which provides information about the orientation of the peptide inserted in lipidic bilayers.
The integrated areas corresponding to the α-helix components from the two polarized spectra were determined and the ratio of the integrated areas is the dichroic ratio of α-helix, . Dichroic ratios were used to determine the tilt angle with the membrane normal (see Citation[13] for further information). The angle between helix axis and the amide I transition dipole moment is 33.3° Citation[24]. Riso was used to compute the film thickness and the values of the electric field components at 1650cm−1 as described previously Citation[18]. For these calculations refractive indexes of 4.0 and 1.44 were used for the Ge plate and the sample film, respectively.
Electrophysiological studies
PLMs were formed according to the Montal and Mueller method Citation[25]. Briefly, a thin teflon film (25 µm) with a hole (130–160 µm) was clamped between two compartments (referred as cis and trans chambers) filled with HEPES buffer (the level of solution was kept below the hole) 5 µl of a lipid solution (20 mg/ml in n-hexane) were spread in each compartment and the solvent was left to evaporate (10 min). Raising the level of the buffer solution above the aperture, first in one side and then in the other, induced the formation of the bilayer in the teflon hole. The two chambers were connected (through Ag/AgCl electrodes and a 1 M KCl agar bridge) to a BLM-120 amplifier (biologic). The cis chamber was connected to the active input of the BLM-120 amplifier and trans chamber was held at ground. The electrical potential was defined as cis with respect to trans. The formation of bilayer was followed by membrane capacitance, see Citation[26]. Only membranes with a resistance > 100GΩ were used to perform the measurements. Pep-1 was added to the cis side of the chamber and the ion current was recorded for increasing potential differences (alternating from negative to positive potential). The electric signal was low pass filtered at 100 Hz, sampled at 44.1 kHz and stored on CD using a DRA 200 analog to digital converted (biologic). DPhPC was used to perform PLMs because it is known to form stable bilayers Citation[27], this lipid exhibits no detectable phase transition over a large temperature range (−120°C to +120°C) Citation[28] and the presence of methyl groups along acyl chains results in considerable disorder chain Citation[29], so a fluid-like phase is expected at room temperature. DPhPC was preferred over POPC because POPC did not form bilayers. Both lipids form fluid phase bilayers at room temperature. The charge effect was tested by the presence of 10% and 20% (mol/mol) of POPG in the bilayers. Different peptide concentrations were added at cis chamber. Asymmetrical membranes were also tested with 20% POPG in the trans side and pure DPhPC in the cis side. Titrations with peptide were realized in the trans side or in the cis side or alternating (one addition in the trans side and other in the cis side). Controls without peptide were carried on.
Leakage experiments with GUVs
Membrane leakage induced by pep-1 was evaluated in GUVs using the method previously described by Ambroggio et al. Citation[15], Citation[30]. Briefly, for GUVs production 4 µl of lipid stock solution (0.2 mg/ml) in chloroform were spread on each Pt wire under a stream of N2, residual organic solvent was removed in a vacuum chamber overnight. Sucrose solution with three dyes, (2 µM Alexa Fluor633 C5-maleimide (Mr∼1300), 2 µM Alexa Fluor546- Dextran (Mr∼10000) and 2 µM Alexa Fluor488-Dextran (Mr∼3000)) with an overall osmolarity of 150 mOsM, was equilibrated at a temperature above lipid phase transition and added to the chamber (500 µl final volume) covering the Pt electrodes. The Pt wires were connected to a function generator and a low frequency AC field (sinusoidal wave function with a frequency of 10 Hz and amplitude of 1.5V) was applied for 120 min to form GUVs. Vesicle solutions were carefully removed from the chamber and placed into a sephadex G-100 column equilibrated with a gluocose iso-osmolar solution Citation[15]. With this procedure the fluorescent dyes located out of the vesicles are removed and vesicles with homogeneous size (about 10–15 µm) are obtained. GUVs solution suspended in glucose (250 µL) were added to an eight well plastic chamber (Lab-tek Brand Products) and left to precipitate overnight. The density difference between glucose and sucrose causes the precipitation of the vesicles, which facilitates observation in the inverted confocal fluorescence microscope. An iso-osmolar solution of pep-1 was added to the chamber and the fluorescence intensity of the different dyes was followed for a period of time of up to 30min; different peptide concentrations were studied in the presence of GUVs prepared with POPC or POPC:POPG (4:1 molar). The membrane integrity was evaluated repeating these experiments with GUVs labelled with a membrane dye (0.5% DiIC18/lipid mol/mol) and with 2 µM Alexa Fluor633 C5-maleimide internalized. An inverted scanning confocal fluorescence microscope (Zeiss -LSM 510 META, Carl Zeiss, Jena, Germany) was used to perform the experiments. The excitation wavelengths were 543 nm (HeNe laser, 1 mW; for DiIC18 or Alexa Fluor546- Dextran), 488nm (Ar laser, 30 mW; for Alexa Fluor488-Dextran) and 633 nm (HeNe laser, 5 mW; for Alexa Fluor633 C5-maleimide). The objective used for the experiments was a Zeiss C-Apochromat 40×1.20 W corr (water immersion, NA = 1,2). The fluorescent images were simultaneously collected using the fluorescence microscope's META detection device (Polychromatic 32-channel detector) by selecting the proper emission wavelength range for the different fluorescent probes. The time-dependence of the fluorescent intensities of the different dyes during the course of the experiment were quantitatively recorded and treated by the standard Zeiss LSM 510 META software package (with the inclusion of the multiple time series software option).
Lipid quantification in GUVs solution was carried out to enable the determination of the peptide/lipid ratio. POPC GUVs doped with 5% N-Rh-PE were prepared using the same procedure above described and the Rh fluorescence emission intensity (λexcitation=570 nm and λemission=590nm) was followed before and after the washing step in the Sephadex G100 column. The calibration curve was set with multilamellar vesicles dispersions in sucrose or glucose with a well-known lipidic concentration. Blanks were discounted. Considering the total lipid added to the Pt wire, the final lipid concentration in the chamber is ∼ 4µM; after GUV formation the average lipid concentration determined was 1.03±0.49 µM (8 samples) before washing step and 0.71±0.22 µM (4 samples) after vesicle washing.
Results and discussion
Pep-1 has a high affinity for zwiterionic membranes, which is enhanced in the presence of negatively-charged phospholipids Citation[8]. The peptide has an amphipathic nature, the hydrophobic domain, containing five Trp residues, inserts in the membrane with a shallow position Citation[8], Citation[10], but not accessible to the aqueous environment Citation[8]. The hydrophilic domain, with five basic residues, does not insert in the hydrophobic core of the membrane Citation[9]. This highly charged domain is probably responsible for the first contact of the peptide with the membrane due to electrostatic attraction between the polar phospholipids headgroup and the positive charges of pep-1 Citation[9]. The dehydration induced by the hydrophilic domain at membrane surface and the insertion of hydrophobic domain promote membrane destabilization. As a consequence of membrane destabilization induced by pep-1, aggregation and fusion events with LUVs were detected Citation[7]. These perturbations in the membrane occurred without evidence for pore formation. Citation[7], Citation[10]. Fusion events without leakage were also observed for other CPPs such as R7W, TATP59W and TATLysP59W Citation[31]. Moreover, membrane integrity in HeLa cells is only disrupted in the presence of high peptide concentration (concentration much higher than the one required for the translocation to occur) Citation[10].
At variance, Deshayes et al. proposed a barrel-stave-like mechanism of pore formation Citation[12]. Such a hypothesis is based on the observation that pep-1 undergoes conformational changes after insertion in the lipidic bilayer (hydrophobic domain change from unordered to α-helix structure) and due to changes in the membrane conductance in voltage-clamped oocytes, when a transmembrane potential is applied. Moreover, it is suggested that the helical axis of pep-1 is inserted with a perpendicular orientation to the membrane plane; this proposal was putative.
Secondary structure determination
In the present work a study of the peptide secondary structure was carried out in the absence and presence of lipidic membranes at physiological pH. To evaluate the conformational state of pep-1, its secondary structure was studied by both CD spectroscopy and ATR-FTIR spectroscopy in the presence and absence of lipidic bilayers. It is normally accepted that CD spectroscopy is a powerful technique to identify the presence of random coil and α-helix contributions Citation[17], Citation[32], Citation[33] where IR is more sensitive to β-sheets structures Citation[34].
In CD measurements a good computer fitting with concomitant quantification of different spectral components contributions was obtained in the spectra carried out on aqueous solution with 68.8 µM pep-1 (A). Contributions of α-helix and random coil were identified.
Figure 1. The 68.8 µM pep-1 Far-UV CD spectra obtained, Mean Residue Elipticity (MRE) is presented, (A) in aqueous solution, (B) in the presence of 1 mM POPC LUVs or (C) in the presence of 1 mM POPC:Chol (2:1 molar). Solid lines represent original spectra; dotted lines fitted spectra and dashed lines the residual. The samples were prepared in 10 mM phosphate buffer (pH 7.5) containing 75 mM NaF.
LUVs are an adequate model of biological membranes with no significant curvature effects as the ones present in SUVs (small unilamellar vesicles) Citation[35]. The secondary structure of 68.8 µM pep-1 in the presence of 1mM POPC or POPC:Chol (2:1 molar) vesicles (B and C) has a higher contribution of α-helix than in aqueous environment.
ATR-FTIR spectroscopy enables to further extend the information on peptide secondary structure because this technique is more robust than CD spectroscopy to identify the presence of β-structures. Amide I mode (∼1700 − 1600cm−1) is the most sensitive to the protein secondary structure Citation[23].
The membrane phase effect was evaluated with different lipids at room temperature, instead of heating/cooling one lipidic system, to avoid artefacts/denaturation in the pep-1. At room temperature POPC forms fluid phase bilayers, POPC:Chol (2:1 molar) forms liquid-ordered phases and DPPC forms gel phase bilayers.
A broad band was obtained in the absence and presence of the lipidic systems (A), suggesting that there are contributions of different conformations. Comparison of deconvoluted spectra (B) reveals that the same secondary structures but with different percentages are present in the different conditions tested.
Figure 2. ATR-FTIR amide I band of 8 µg of pep-1 in aqueous solution (solid line) or in the presence of 40 µg of lipid in multilayers with different compositions: POPC (alternated dashes and dots), POPC:Chol (2:1 molar) (long dashes) and DPPC (short dashes). (A) Non-deutered form, (B) Deconvoluted spectra of the non-deutered form. (C) Recorded after 1 h of deuteration. (D) Deconvoluted spectra of deutered form. All the spectra were normalized. The samples were prepared in 10 mM HEPES with 150 mM NaCl (pH 7.4).
Spectra of deutered samples (1 h of deuteration; see 1H/2H exchange kinetic in Supplementary material Online, Figure S.1) were used to improve the assignment of band components and for a better quantification of secondary structure. In the non-deutered form the random coil and α-helix conformation absorb at the same wave number range. At variance, the band of the deutered form of the random coil is usually shifted to lower wave numbers. Therefore, the deutered form facilitates the identification and quantification of the two classes of structures. Moreover, the amide I in non-deutered form can also have contribution of the water hydration Citation[23] and of amino acid side chains Citation[20], which further hampers detailed data analysis.
The spectra of pep-1 or pep-1-lipid mixtures dried on the Ge plate were compared after 1 h of deuteration (C). Deconvolution (D) shows 3 peaks (1691, 1674 and 1622 cm−1), and a large shoulder between 1657–1640 cm−1.
By comparison with deconvoluted spectra obtained in non-deutered and deutered forms (B,D) it is possible to say that there is a contribution of intermolecular β-structure (1692 and 1625cm−1 in 1H, which are shifted to 1674 and 1622cm−1 in 2H) Citation[21], Citation[23]. The existence of intermolecular β-structure instead of intramolecular β-sheet is identified by the low frequency signal at 1625cm−1 in 1H, and 1622cm−1 in 2H; in the case of intramolecular β-sheet a longer wave number was expected for the low frequency component (1636–1630cm−1 instead of 1625cm−1) Citation[23]. The existence of a contribution at ∼1674cm−1 in 1H suggests the existence of β-turns Citation[23]. In 2H a peak with this wavenumber has a contribution of β-turn Citation[19] and also with the high frequency component of intermolecular β-sheet. Absorbances between 1657cm−1 and 1640cm−1 in 2H are characteristic for α-helix and random coil Citation[23]. Results obtained with CD spectroscopy confirm the existence of these two contributions.
For the quantification of each contribution a five-band fitting was preformed in deutered spectra, as follows: (i) 1705–1685cm−1, (ii) 1680–1669cm−1, (iii) 1660–1648cm−1, (iv) 1648–1640cm−1, (v) 1630–1620cm−1. Band assignment and relative weights are present in .
Table I. Pep-1 secondary structure evaluated by ATR-FTIR spectroscopy in the absence/presence of different lipidic multibilayers at 20°C and pH7.4*.
In the presence of lipids, the contribution of β-sheet (bands with maximum at 1674 cm−1 and 1621 cm−1) decreases, while α-helix (1657 cm−1) and random coil contributions (1640 cm−1) increase. The contribution at ∼1690 cm−1 is weak for all the conditions and may result from a small fraction of peptide quantity in non-deutered form in β-sheet conformation (see and ).
In ATR-FTIR measurements, an increase in intermolecular β-sheet signal, with the peptide quantity spread in the Ge plate, was verified (data not shown). It was previously published that pep-1 has a tendency to aggregate in aqueous solution Citation[8]; in order to verify that the β-structure signal is due to intermolecular interactions resulting from peptide aggregation with β-sheet conformation, a titration of the ThT dye with a pep-1 stock solution was realized (see Supplementary material online). An increase in ThT fluorescence intensity emission (with excitation at 450 nm) with peptide concentration (see Figure S.3 in Supplementary material online) confirms that pep-1 has a tendency to aggregate with β-sheet conformation.
While analysing ATR-FTIR results one should bear in mind that samples are semi-dehydrated. When the sample is semi-dehydrated for multibilayer deposition, the fraction of pep-1 not inserted in the membranes precipitates in the aggregated form and contributes in this form to the ATR-FTIR spectrum. Comparison of spectra in shows that the signal at 1621 cm−1 (intermolecular β-structure component) decreases in the order H2O = DPPC > POPC:Chol > POPC. The percentage of peptide precipitated decreases when the membrane becomes more fluid (membrane fluidity follows the order: DPPC < POPC:Chol < POPC) which is related to the ability of the peptide to insert in the membrane Citation[8]. Therefore, the relative percentage for the contribution of the different secondary structures is affected by the contribution of aggregates in solution. To evaluate if there is alteration in the α-helix content of the fraction of peptides inserted in the lipidic matrix it is a better approach to compare the contribution of α-helix components in relation to random coil component. For instance in the absence of lipid α-helix/random coil contribution = 3.8%/32.7% = 0.12. When DPPC is present, 7.7%/35.4% = 0.22, and for POPC = 14.6%/44.2% = 0.33 (see ). These results show that in the presence of lipidic bilayers there is an increase in α-helix contribution relative to random coil, and this contribution is enhanced by membrane fluidity (see and ).
CD and ATR-FTIR measurements were carried out with different peptide and lipidic concentrations but the peptide/lipid ratios were nearly the same (0.069 and 0.054, respectively). With CD measurements it was possible to identify the presence of random coil and α-helix contributions; this facilitated the band assignment in amide I ATR-FTIR spectra. A fraction of peptide, either in the absence or in the presence of vesicles, is aggregated when the peptide/lipid suspensions is spread over the Ge Plate (identified by the presence of intermolecular β-sheet). An α-helix conformation of the other fractions is favoured when the pep-1 is inserted in the membrane (see , and ). Considering the primary structure of pep-1, the hydrophobic domain has a bigger tendency to acquire an amphipathic α-helix conformation, in agreement with NMR results proposed by others Citation[10], Citation[12], while the hydrophilic domain is expected to be in the random coil conformation. The presence of Pro residue in the spacer domain, between hydrophilic and hydrophobic domains, is responsible for the separation of α-helix and random coil conformations, inducing the flexibility necessary for the integrity of these two domains.
Orientation of the pep-1 when partitioned in lipidic membranes
Polarized ATR-FTIR is a powerful technique to obtain information about peptide orientation in a lipid bilayer Citation[18]. Calculation of the α-helix mean tilt angle, with membrane normal, was performed. This required the evaluation of (see Material and methods section). Barrel-stave-like pore formation, such as the one proposed for antimicrobial peptides Citation[36] and pep-1 Citation[12], demand the α-helix domain of peptide to span across lipid membrane with an amphipathic helix and acquire an orientation parallel to the membrane normal (0°) Citation[36]. In POPC vesicles and POPC:Chol (2:1 molar) the mean tilt angle of helix contribution with respect to the normal to the membrane is 46.5° and 44.5°, respectively. These values are close to the average value expected for a randomly oriented structure (54.7°) Citation[37]. So, peptide populations with no preferred orientation cannot be discarded. A perpendicular orientation relative to the bilayer surface for peptide hydrophobic domain was not expected from the previous quenching experiments Citation[8]. These findings are not consistent with a barrel-stave-like organization.
In DPPC an angle closer to membrane normal (20°) was found for the α-helix domain. This result supports the idea that peptide is constricted to gel line defects in these rigid membranes Citation[8].
Membrane disruption caused by pep-1
When planar bilayers, PLMs, are used it is possible to have access to both sides of the membrane and the ion flux can be determined by electrical measurements. The electrical capacity of bilayers prepared by the Montal and Mueller method matches that of biological membranes Citation[25].
DPhPC, which form stable and neutral bilayers at room temperature, was used. Pep-1 was added to the cis chamber and the ionic current was recorded for increasing potential differences alternating from negative to positive potential (from 0 to±100mV). Different peptide concentrations were added (0–3 µM). For low peptide concentration (0.5 µM) there was no effect; increasing peptide concentration (∼2 µM), ion current fluctuations were detected in the presence of transmembrane potential (A). The current-voltage relationship (B) shows that these current fluctuations are amplified with the transmembrane potential; however, the shape of fluctuations is completely disordered. When the transmembrane potential was increased to values higher than±100 mV, or the peptide concentration was increased (∼3 µM), the membrane was destroyed.
Figure 3. Electrical measurements in the DPhPC planar bilayers prepared in buffer with 10 mM HEPES (pH 7.4) and 150 mM NaCl. Pep-1 was added to the cis compartment. (A) Current fluctuations in the presence of 2 µM pep-1 at the membrane voltage was clamped at +70 mV. (B) Current-voltage relationship in the absence (filled circle) or in the presence of 0.86 µM pep-1 (open circle) or 2.58 µM pep-1 (filled triangle). Current signals were averaged over 10 s.
In the presence of a transmembrane potential, an increase in peptide concentration in the membrane due to electrostatic attraction is expected. Therefore, the membrane becomes more loosely packed, which results in transient membrane permeability instabilities in the presence of the electric field (B). In the presence of a barrel-stave pore a single-channel conductance was expected, which is characterized by reproducible multiple discrete conducting states Citation[36]. A barrel-stave model cannot account for the results performed with DPhPC PLMs because the conductance induced by the pep-1 is continuously variable rather than discrete Citation[36] (A).
The charge effect in the membrane was tested in DPhPC bilayers with 10% or 20% of POPG and also with asymmetrical membranes. These membranes were less stable. By the addition of peptide to bilayers an intermediary step with current fluctuations did not occur. The membrane became leaky at low pep-1 concentration (∼1 µM) (data not shown). This is probably due to high electrostatic attraction of pep-1 to negatively-charged membranes Citation[8].
The hypothesis of pore formation whether barrel-stave-like or not was further tested by fluorescence microscopy with GUVs loaded with three fluorescent dyes differing in their molecular sizes (Alexa Fluor633 C5-maleimide (Mr∼1300), Alexa Fluor488-Dextran (Mr∼3000) and Alexa Fluor546-Dextran (Mr∼10000)). This experimental setup enables direct observation of any change in the membrane permeability during time course observations Citation[15], Citation[30]. Moreover, in the case of pore formation it is also possible to have information on pore size due to sequential escape of the dyes from the GUVs. The membrane integrity was evaluated with DiIC18 to probe the membrane bilayer structure Citation[30]; this dye was incorporated in GUVs loaded with Alexa Fluor633 C5-maleimide (Mr∼1300)
GUVs prepared with POPC or POPC:POPG (4:1 molar) with a final lipid concentration of ∼0.7 µM were studied in the presence of different peptide concentrations. POPC:POPG vesicles in the presence of peptide concentrations bellow ∼0.7 µM did not undergo noticeable effect in the membrane shape, permeability or integrity; none of the probes escape from the GUVs, during the time window of the experiment (∼30 min). With higher peptide concentration (>0.7 µM) GUVs were completely destroyed with the simultaneous leakage of the three dyes (), which resulted in deformed lipid aggregates (see also Movies 1 and 2 in the Supplementary material Online).
Figure 4. Pep-1 (0.9 µM) interaction with POPC:POPG (4:1 molar) GUVs (0.7 µM) by confocal microscopy. Time course of the normalized fluorescence intensity, of the three internalized vesicles: Alexa Fluor546- Dextran (Mr∼10000) (open triangle), Alexa Fluor488-Dextran (Mr∼3000) (filled circle) and Alexa Fluor633 C5-maleimide (Mr∼1300) (filled square). Fluorescence intensity was determined in each micrograph using the standard Zeiss LSM 510 META software package (with the inclusion of the multiple time series software option) to quantify the average fluorescence intensity over time. Background was corrected and fluorescence intensities were normalized to zero time.
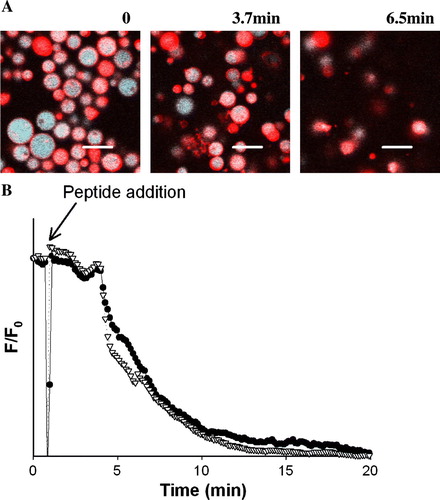
confirms membrane destruction caused by pep-1 in these conditions, where the leakage of Alexa Fluor633 C5-maleimide (Mr∼1300) and the membrane disintegration (followed with DiIC18) occurred concomitantly. These results prove that the peptide does not induce pore formation. Instead, it induces disintegration of the vesicles with a detergent-like mechanism (see Movies 1 and 2 in the Supplementary material Online). It is worth stressing that the approximate lipid concentration in GUVs solution is ∼0.7 µM which is approximately the peptide concentration required for the membrane disruption. With lower peptide concentrations there was no effect on the membrane permeability.
Figure 5. Direct visualization of membrane integrity, of POPC:POPG (4:1 molar) GUVs (0.7 µM) in the presence of pep-1 (0.9 µM), by confocal microscopy. (A) GUVs before and after peptide addition (3.7 and 6.5 min). Pictures show the merge fluorescence of the DiIC18 and Alexa Fluor633 C5-maleimide (Mr∼1300) (red and blue, respectively in online version). Scale bar, 15 µm. (B) Time course of the normalized fluorescence intensity of the two dyes during the experiment: DiIC18 (open triangle), and Alexa Fluor633 C5-maleimide (Mr∼1300) (filled circle). Fluorescence intensity was determined as stated in . Part A of this Figure is reproduced in colour in Molecular Membrane Biology online.
Similar results were obtained with POPC vesicles, but a higher peptide concentration was required for vesicle destruction, about 2–4 µM. This is expected because pep-1 has higher affinity for negatively-charged vesicles Citation[8].
The lag time between peptide addition and vesicles destruction is dependent not only on peptide affinity for membranes but also on the peptide concentration and its diffusion in the chamber (continuous stirring was not possible in these conditions) Citation[15].
Taken together, the results obtained in GUVs and in PLMs suggest that pep-1 at low peptide/lipid (P/L) ratios does not cause significant alterations in membrane properties and does not induced serious perturbations in permeability. For high bulk P/L ratio the membrane is disrupted with a detergent-like mechanism. The P/L ratio required to cause this effect is dependent on the membrane composition, which governs the local peptide concentration in the membrane.
‘Carpet’-model disintegration vs. barrel-stave pore formation
Aurein and Citropin, antibiotic peptides, disrupt membranes in a similar way to pep-1 and a ‘carpet’ model mechanism was proposed Citation[15]. In this model, electrostatic interactions drive the peptide binding onto the surface of the membrane and cover it in a ‘carpet’-like manner. Membrane permeation only occurs above a certain critical local peptide concentration, resulting in disintegration of the membrane. A previous step before the collapse of the membrane packing may include the formation of transient holes in the bilayer Citation[38]. The formation of such holes enables the passage of low molecular weight molecules prior to complete lyses Citation[38]. These small transient holes explain the ion current fluctuations detected in DPhPC PLMs and also the results obtained by Deshayes et al. Citation[12]. Nevertheless, such holes do not make the membrane permeable for molecules with a molecular weight ≥1300 Da (See Figures and and also Movies 1 and 2 in the Supplementary material online), so this mechanism cannot explain the translocation of proteins as big as β-Galactosidase (116 KDa), which, as verified previously, can be translocated by pep-1 in HeLa cells Citation[6], Citation[9].
The adequacy of a ‘carpet’ model-like mechanism to explain membrane disruption and absence of the pore formation (barrel-stave or other) are further supported by the fact that the hydrophobic domain length in α-helix conformation mismatches the membrane depth. Considering 1.5 Å per residue for an ideal α-helical structure Citation[15], 19.5 Å length is expected for the peptide domain inserted in the membrane while 40 Å is the thickness for fluid lipid bilayers Citation[39]. In barrel-stave pore the peptide interaction with the target membrane is driven predominantly by hydrophobic interactions and the peptides should bind to phospholipid membranes irrespective of their charge Citation[38], with a transmembrane domain that spans across the membrane Citation[36]. These events are favoured in the absence of Trp residues in the peptide Citation[40]. Pep-1 however does not fulfil any of such requirements for pore formation.
Membrane destruction is an extreme event that only occurs at very high pep-1 concentration. Therefore ‘carpet’-like mechanism may explain the cytotoxicity of pep-1, but does not explain its translocating activity at lower concentrations Citation[5], Citation[6], Citation[10].
Conclusions
Pep-1 translocates and transports proteins across membranes even with relatively low peptide concentrations Citation[5], Citation[6], Citation[10]. With concentrations required for peptide translocation pep-1 shows a high affinity for membranes Citation[8] and is able to induce membrane destabilization Citation[7] without evidence of pore formation Citation[7], Citation[10]. Translocation occurs both in vitroCitation[7] and in vivoCitation[6] by a mechanism mediated by the transmembrane potential. Such a mechanism is governed by electrostatic interaction between the peptide and the membrane and the peptide ability to destabilize membranes seems to play an important role.
For high peptide concentration more pronounced membrane damage occurs, which induces toxicity in cells Citation[5], Citation[10]. Membrane disintegration occurs for high P/L ratios and is dependent on the peptide affinity for membranes. A ‘carpet’-model mechanism is suggested by all sets of data but only in extreme conditions, far from typical physiological conditions.It should be stressed that in the presence of a transmembrane potential, translocation occurs and peptide accumulation in the membrane is not favoured, i.e., the membrane saturation/disintegration point is only reached at very high peptide concentration, which explains the low cytotoxicity of pep-1.
In spite of the α-helix contribution increase when pep-1 inserts in the membrane, there was no direct evidence for a transmembrane pore. Pep-1 first interaction with membrane is driven by electrostatic interaction Citation[9] followed by membrane carpeting, which occurs with lateral rearrangement of the acidic lipids Citation[7]. Similar phenomena were observed with other peptides and a ‘membrane-thinning’ effect was proposed Citation[41]. In this model, the peptide aggregates on the surface and the reduced local surface tension allow the peptide to intercalate the membrane. Flexible sealing between peptide side-groups and lipid head-groups minimize leakage during the CPP passage through the membrane Citation[1].
Supplementary material available online
(1) Pep-1 deuteration in the presence of lipidic bilayers monitorized by ATR-FTIR; (2) Pep-1 dichroic spectrum obtained by ATR-FTIR spectroscopy; (3) Evaluation of existence of pep-1 β-sheet aggregates by Thioflavin T fluorescence, and (4) Movies showing the interaction of the pep-1 with GUVs.
Online supplementary material
(1) Pep-1 deuteration in the presence of lipidic bilayers monitorized by ATR-FTIR
The 1H/2H exchange kinetics was studied to establish an appropriate duration for peptide deuteration to evaluate secondary structure by ATR-FTIR spectroscopy. The kinetics of pep-1 deuteration in the presence of POPC bilayers is fast (Figure S.1). There are no significant differences in amide I band after 1 min of deuteration. A decrease in the area of the amide II band (1590 − 1505 cm−1) is also noticed. The shape change in amide I and the area decrease in amide II bands suggest that the pep-1 is easily accessible to the solvent Citation[1]. A fast kinetics of pep-1 deuteration was observed for all the lipidic systems tested (POPC, POPC:Chol (2:1) and DPPC).
(2) Pep-1 dichroic spectrum obtained by ATR-FTIR spectroscopy
The dichroic spectrum is the difference between the spectra recorded with parallel and perpendicular polarizations; the perpendicular spectrum was multiplied by the dichroic ratio of the lipid ν (C = O) determined at 1738cm−1 (Riso) to take into account the difference in the relative power of the evanescent fields (see Citation[2] for further information). The dichroic spectrum provides information on the peptide orientation relative to the normal of membrane plane Citation[2].
Figure S.1. 1H/2H exchange kinetic of pep-1 in the presence of POPC bilayers (20% w/w). Spectra of 8 µg of pep-1 in the presence of 40µg of POPC were recorded as a function of the deuteration time (from 0 to 60 min of deuteration). All the spectra were normalized.
The dichroic spectrum, //-Riso⊥, for pep-1 in the presence of different lipids shows a positive dichroism signal, for amide I region, indicating that the peptide has a preferential orientation in the lipid membrane (see Figure S.2). This band, however, is relatively broad (FWHH > 50cm−1) with a maximum at 1674cm−1 and a shoulder at 1650cm−1.
Figure S.2. ATR-FTIR spectra of pep-1 (20% w/w) partitioned in POPC bilayers obtained using parallel or perpendicular polarization. The dichroic spectrum was obtained by the difference between the spectra recorded with parallel and perpendicular polarizations; the perpendicular spectrum was multiplied by Riso. All the spectra are in the same scale, but dichroic spectrum intensity has been multiplied by 2.
(3) Evaluation of existence of pep-1 β-sheet aggregates by Thioflavin T fluorescence
ThT dye was used to evaluate if pep-1 forms β-sheet aggregates in aqueous solution. In the absence of β-sheet aggregates the dye has an excitation and emission maxima at 350 and 438nm, respectively. In the presence of amyloid fibrils the ThT excitation spectrum shifts with a new peak at 450nm and emission at 482nm Citation[3]. Titration of 15µM ThT with a pep-1 stock solution (688 µM) was followed by fluorescence intensity at λemission=490nm with λexcitation=450nm.
(4) Movies showing the interaction of the pep-1 with GUVs
Movie 1. Leakage of the probes entrapped in GUVs. 0.9µM pep-1 was added to the vesicles composed by POPC:POPG (4:1 molar) with a lipid concentration ∼ 0.7µM. Fluorescence merge of the three dyes (Alexa Fluor546- Dextran (Mr∼10000) (red), Alexa Fluor488-Dextran (Mr∼3000) (green) and Alexa Fluor633 C5-maleimide (Mr∼1300) (blue)) is presented. The three dyes escape from the vesicles at the same time. In the film the velocity was increased 40 times.
Figure S.3. Peptide concentration effect in the ThT (15µM) fluorescence emission intensity, with excitation at 450nm and emission at 490nm. Experiments were carried out in 10mM HEPES buffer, pH 7.4, with 150mM NaCl.
Movie 2. Leakage of DiIC18-labelled GUVs filled with Alexa Fluor633 C5-maleimide (Mr∼1300). 0.9µM pep-1 was added to the vesicles composed by POPC:POPG (4:1 molar) with a lipid concentration ∼ 0.7µM. Fluorescence merge of the DiIC18 (red) and Alexa Fluor633 (blue) is presented. Membrane disruption and Maleimide escape occurred at once, which demonstrates that membrane is disrupted in these conditions. In the film the velocity was increased 30 times.
This paper was first published online on iFirst on 09 March 2007.
Acknowledgements
Fundação para a Ciência e Tecnologia (Portugal) is acknowledged for the grant SFRH/BD/14337/2003 to S. T. Henriques. FEBS is acknowledged for financial support to S. T. Henriques for a short-term visit to Dr Luis Bagatolli laboratory at MEMPHYS/BMB, Syddansk University, Odense, Denmark. Research in the laboratory of Dr Luis Bagatolli is funded by a grant from SNF, Denmark (21-03-0569) and the Danish National Research Foundation (which supports MEMPHYS-Centre for Biomembrane Physics). F. Homblé is a Research Director from the National Fund for Scientific Research, Belgium.
References
- Magzoub M, Graslund A. Cell-penetrating peptides: from inception to application. Q Rev Biophys 2004; 37: 147–195
- Thoren PE, Persson D, Isakson P, Goksor M, Onfelt A, Norden B. Uptake of analogs of penetratin, Tat(48-60) and oligoarginine in live cells. Biochem Biophys Res Commun 2003; 307: 100–107
- Richard JP, Melikov K, Vives E, Ramos C, Verbeure B, Gait MJ, Chernomordik LV, Lebleu B. Cell-penetrating peptides. A reevaluation of the mechanism of cellular uptake. J Biol Chem 2003; 278: 585–590
- Drin G, Cottin S, Blanc E, Rees AR, Temsamani J. Studies on the internalization mechanism of cationic cell-penetrating peptides. J Biol Chem 2003; 278: 31192–31201
- Morris MC, Depollier J, Mery J, Heitz F, Divita G. A peptide carrier for the delivery of biologically active proteins into mammalian cells. Nat Biotechnol 2001; 19: 1173–1176
- Henriques ST, Costa J, Castanho MA. Translocation of beta-galactosidase mediated by the cell-penetrating peptide pep-1 into lipid vesicles and human HeLa cells is driven by membrane electrostatic potential. Biochemistry 2005; 44: 10189–10198
- Henriques ST, Castanho MA. Consequences of nonlytic membrane perturbation to the translocation of the cell penetrating peptide pep-1 in lipidic vesicles. Biochemistry 2004; 43: 9716–9724
- Henriques ST, Castanho MA. Environmental factors that enhance the action of the cell penetrating peptide pep-1 A spectroscopic study using lipidic vesicles. Biochim Biophys Acta 2005; 1669: 75–86
- Henriques ST, Costa J, Castanho MA. Re-evaluating the role of strongly charged sequences in amphipathic cell-penetrating peptides: a fluorescence study using Pep-1. FEBS Lett 2005; 579: 4498–4502
- Weller K, Lauber S, Lerch M, Renaud A, Merkle HP, Zerbe O. Biophysical and biological studies of end-group-modified derivatives of Pep-1. Biochemistry 2005; 44: 15799–15811
- Fischer R, Fotin-Mleczek M, Hufnagel H, Brock R. Break on through to the other side –biophysics and cell biology shed light on cell-penetrating peptides. Chembiochem 2005; 6: 2126–2142
- Deshayes S, Heitz A, Morris MC, Charnet P, Divita G, Heitz F. Insight into the mechanism of internalization of the cell-penetrating carrier peptide Pep-1 through conformational analysis. Biochemistry 2004; 43: 1449–1457
- Vigano C, Manciu L, Buyse F, Goormaghtigh E, Ruysschaert JM. Attenuated total reflection IR spectroscopy as a tool to investigate the structure, orientation and tertiary structure changes in peptides and membrane proteins. Biopolymers 2000; 55: 373–380
- Zhang S, Udho E, Wu Z, Collier RJ, Finkelstein A. Protein translocation through anthrax toxin channels formed in planar lipid bilayers. Biophys J 2004; 87: 3842–3849
- Ambroggio EE, Separovic F, Bowie JH, Fidelio GD, Bagatolli LA. Direct visualization of membrane leakage induced by the antibiotic peptides: maculatin, citropin, and aurein. Biophys J 2005; 89: 1874–1881
- Mayer LD, Hope MJ, Cullis PR. Vesicles of variable sizes produced by a rapid extrusion procedure. Biochim Biophys Acta 1986; 858: 161–168
- Yang JT, Wu CS, Martinez HM. Calculation of protein conformation from circular dichroism. Methods Enzymol 1986; 130: 208–269
- Goormaghtigh E, Raussens V, Ruysschaert JM. Attenuated total reflection infrared spectroscopy of proteins and lipids in biological membranes. Biochim Biophys Acta 1999; 1422: 105–185
- Torrecillas A, Martinez-Senac MM, Goormaghtigh E, de Godos A, Corbalan-Garcia S, Gomez-Fernandez JC. Modulation of the membrane orientation and secondary structure of the C-terminal domains of Bak and Bcl-2 by lipids. Biochemistry 2005; 44: 10796–10809
- Goormaghtigh E, Cabiaux V, Ruysschaert JM. Determination of soluble and membrane protein structure by Fourier transform infrared spectroscopy. I. Assignments and model compounds. Subcell Biochem 1994; 23: 329–362
- Arrondo JL, Goni FM. Structure and dynamics of membrane proteins as studied by infrared spectroscopy. Prog Biophys Mol Biol 1999; 72: 367–405
- Barth A, Zscherp C. What vibrations tell us about proteins. Q Rev Biophys 2002; 35: 369–430
- Tatulian SA. Attenuated total reflection Fourier transform infrared spectroscopy: a method of choice for studying membrane proteins and lipids. Biochemistry 2003; 42: 11898–11907
- Bechinger B, Ruysschaert JM, Goormaghtigh E. Membrane helix orientation from linear dichroism of infrared attenuated total reflection spectra. Biophys J 1999; 76: 552–563
- Montal M, Mueller P. Formation of bimolecular membranes from lipid monolayers and a study of their electrical properties. Proc Natl Acad Sci USA 1972; 69: 3561–3566
- Fuks B, Homble F. Permeability and electrical properties of planar lipid membranes from thylakoid lipids. Biophys J 1994; 66: 1404–1414
- Redwood WR, Pfeiffer FR, Weisbach JA, Thompson TE. Physical properties of bilayer membranes formed from a synthetic saturated phospholipid in n-decane. Biochim Biophys Acta 1971; 233: 1–6
- Lindsey H, Petersen NO, Chan SI. Physicochemical characterization of 1,2-diphytanoyl-sn-glycero-3-phosphocholine in model membrane systems. Biochim Biophys Acta 1979; 555: 147–167
- Hung WC, Chen FY, Huang HW. Order-disorder transition in bilayers of diphytanoyl phosphatidylcholine. Biochim Biophys Acta 2000; 1467: 198–206
- Ambroggio EE, Kim DH, Separovic F, Barrow CJ, Barnham KJ, Bagatolli LA, Fidelio GD. Surface behavior and lipid interaction of Alzheimer beta-amyloid peptide 1-42: a membrane-disrupting peptide. Biophys J 2005; 88: 2706–2713
- Thoren PE, Persson D, Lincoln P, Norden B. Membrane destabilizing properties of cell-penetrating peptides. Biophys Chem 2005; 114: 169–179
- Sreerama N, Venyaminov SY, Woody RW. Estimation of the number of alpha-helical and beta-strand segments in proteins using circular dichroism spectroscopy. Protein Sci 1999; 8: 370–380
- Woody RW. Circular dichroism. Methods Enzymol 1995; 246: 34–71
- Oberg KA, Ruysschaert JM, Goormaghtigh E. The optimization of protein secondary structure determination with infrared and circular dichroism spectra. Eur J Biochem 2004; 271: 2937–2948
- Wieprecht T, Beyermann M, Seelig J. Thermodynamics of the coil-alpha-helix transition of amphipathic peptides in a membrane environment: the role of vesicle curvature. Biophys Chem 2002; 96: 191–201
- Yang L, Harroun TA, Weiss TM, Ding L, Huang HW. Barrel-stave model or toroidal model? A case study on melittin pores. Biophys J 2001; 81: 1475–1485
- Thulstrup EW, Michl J. Elementary polarization spectroscopy. VCH Publishers; 52 pp, New York 1989
- Shai Y. Mechanism of the binding, insertion and destabilization of phospholipid bilayer membranes by alpha-helical antimicrobial and cell non-selective membrane-lytic peptides. Biochim Biophys Acta 1999; 1462: 55–70
- Wiener MC, White SH. Structure of a fluid dioleoylphosphatidylcholine bilayer determined by joint refinement of x-ray and neutron diffraction data. III. Complete structure. Biophys J 1992; 61: 434–447
- Herbig ME, Weller K, Krauss U, Beck-Sickinger AG, Merkle HP, Zerbe O. Membrane surface-associated helices promote lipid interactions and cellular uptake of human calcitonin-derived cell penetrating peptides. Biophys J 2005; 89: 4056–4066
- Ludtke S, He K, Huang H. Membrane thinning caused by magainin 2. Biochemistry 1995; 34: 16764–16769
Supplementary material references:
- Manciu L, Chang XB, Buyse F, Hou YX, Gustot A, Riordan JR, Ruysschaert JM. Intermediate structural states involved in MRP1-mediated drug transport. Role of glutathione. J Biol Chem 2003; 278: 3347–3356
- Bechinger B, Ruysschaert JM, Goormaghtigh E. Membrane helix orientation from linear dichroism of infrared attenuated total reflection spectra. Biophys J 1999; 76: 552–563
- LeVine H., 3rd. Thioflavine T interaction with synthetic Alzheimer's disease beta-amyloid peptides: detection of amyloid aggregation in solution. Protein Sci 1993; 2: 404–410