
Abstract
Economic globalization has pressured countries to compete with one another for firms’ investment capital. Analyses of such competition draw heavily on foreign direct investment (FDI) statistics. In and of themselves, however, FDI statistics are merely a quantification of the value of firms’ investment projects and tell us little about the heterogeneity of these projects and the distinct patterns of competitive dynamics between countries they generate. Here, we create a more sophisticated understanding of international competition for FDI by pointing out its variegated nature. To do so, we trace the ‘great fragmentation of the firm’ to distinguish between five categories of FDI: manufacturing affiliates, shared service centers, R&D facilities, intermediate holding companies, and top holding companies. Using a novel combination of firm-level and country-level data, we identify for each of these different categories which European Union member states are most successful in attracting it, what macro-institutional and tax arrangements are present in them, and what benefits they receive from it in terms of tax revenues and employment creation. In this way, we are able to identify five distinct ‘FDI attraction profiles’ and show that competition increasingly appears to take place amongst subsets of countries that compete for similar categories of FDI.
1. Introduction
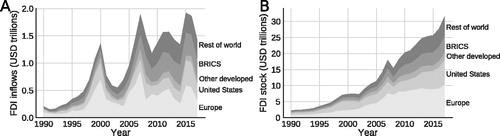
A defining feature of the most recent wave of economic globalization is the dramatic expansion of global foreign direct investment (FDI). Annual flows of global FDI have expanded from $205 billion in 1990 to $1.4 trillion in 2017 (). The worldwide stock of FDI has expanded accordingly. Whereas in 1990 it stood at $2.2 trillion, in 2017 this figure has risen to $31.5 trillion (). Motivated by the anticipated benefits from incoming FDI, which include both concrete short-term benefits, such as increased tax revenues, growing employment, and GDP growth, as well as more intangible long-term ones, such as knowledge spillover effects, productivity gains, and a reduction of current account deficits, national governments have become increasingly preoccupied with improving the attractiveness of their countries’ investment climates in order to outcompete other countries in the global race for FDI (Cerny, Citation1990; Elkins et al., Citation2006; Jensen, Citation2008; Porter, Citation1990; Stopford et al., Citation1991; Thomas, Citation2011).
Figure 1. The increasing importance of Foreign Direct Investment. (A) FDI inflows by region (B) FDI stock by region. All FDI data was collected from the UNCTAD World Investment Report (2018).
Such international competition for FDI presents one of the main dynamics in contemporary capitalism and, accordingly, has become a key research focus of scholars studying the international political economy. By now, a substantial literature has emerged that interrogates the phenomenon of international competition for FDI from a political economy perspective. Although this literature is vast and both theoretical and methodological approaches are heterogeneous, at its core three broad strands of literature can be identified.Footnote1
A first strand of political economy literature on international competition for FDI approaches the phenomenon from the perspective of the firm and asks what factors drive the decisions of TNCs on where to locate their foreign investments. Amongst the main ‘locational determinants’ of FDI that scholars have identified are: socio-economic factors, such as market size, infrastructure, labor costs and exchange rates (Bellak et al., Citation2008; Yu & Walsh, Citation2010), human capital (Blonigen & Piger, Citation2014; Globerman & Shapiro, Citation2002), agglomeration effects (Yu & Walsh, Citation2010), and cultural and geographical distance (Bénassy-Quéré et al., Citation2007; Blonigen & Piger, Citation2014); political-institutional factors, such as political (in)stability (Globerman & Shapiro, Citation2002), political regime type (Bailey & Warby, Citation2019; Jensen, Citation2003), regulatory frameworks (Bénassy-Quéré et al., Citation2007), and openness to foreign trade and capital flows (Blonigen & Piger, Citation2014; Desai et al., Citation2004); and factors related to the specificities of countries’ tax regimes, such as the availability of tax and investment treaties (Haftel, Citation2010), as well as statutory and effective corporate income tax rates (Devereux & Griffith, Citation1998; Mooij et al., Citation2003).
A second strand of literature approaches the phenomenon from the perspective of global markets and their interaction with the international state system. Work in this strand of literature typically uses formal models to explore how the increased footloosness of firms, especially since the 1990s, has pressured national governments into competing with one another to attract TNCs’ cross-border investments. Although some studies look at the way in which governments try to compete on the basis of labor standards (Davies & Vadlamannati, Citation2013; Olney, Citation2013) and environmental regulations (Dong et al., Citation2012; Elliott & Zhou, Citation2013), the vast majority of studies in this strand of literature focuses specifically on the ways in which governments use taxation policies to increase the attractiveness of their country’s investment climate. Studies on such international tax competition have, for instance, looked at the way in which pressures to compete affect big and small countries differently (Bucovetsky, Citation1991) and how such pressures are mediated by national politics and institutions (Basinger & Hallerberg, Citation2004; Jensen, Citation2008; Li, Citation2006). Scholars have also looked at the extent to which tax competition may lead to races to the bottom or top, or give rise to other forms of competitive (or cooperative) dynamics (Brueckner, Citation2003; Devereux et al., Citation2002; Genschel & Schwarz, Citation2011; Keen & Konrad, Citation2013; Swank, Citation2016; Wilson, Citation1999), as well as the overall welfare effects of such dynamics (Avi-Yonah, Citation2000; Ganghof, Citation2006; Genschel, Citation2001; Genschel & Seelkopf, Citation2016; Rixen, Citation2011; Swank, Citation1998).
A third strand of literature approaches the phenomenon from the perspective of individual states.Footnote2 Studies in this strand of literature typically adopt a comparative perspective to explore how specific historical legacies and variations in political-economic regimes have shaped the ways in which countries engage differently with the pressures emanating from the increased footlessness of firms, and how certain, especially Central and Eastern European, countries have come to rely more heavily than others on FDI to generate jobs and economic growth. Specifically, studies in this strand of literature open up the black box of the state to look at the institutional complementarities that underpin such FDI-led growth regimes (Myant & Drahokoupil, Citation2011; Nölke & Vliegenthart, Citation2009); the social and industrial policy tools they rely on (Brazys & Regan, Citation2017; Thomas, Citation2011); the political coalitions that support and sustain them (Bohle & Greskovits, Citation2012; Drahokoupil, Citation2009), as well as their distributional implications (Fink, Citation2006; Regan & Brazys, Citation2018).
In this paper we speak to each one of these strands of literature by challenging a key assumption they all share. That is the assumption that FDI is a monolithic phenomenon. In line with such an understanding, most studies on international competition for FDI rely heavily on inward FDI statistics. We contend that such an approach is problematic because FDI statistics are merely a quantification of the number or value of TNCs’ cross-border investments. They tell us very little about the character of the actual investment projects that are financed by these investments. This is an important shortcoming because these investment projects are extremely heterogeneous.
We are certainly not the first to emphasize the heterogeneity of FDI. The existing literature proposes several ways of disaggregating FDI statistics. One is to disaggregate FDI on the basis of TNCs’ motivations for their cross-border investment projects. This implies a conceptual distinction between ‘horizontal’ FDI, where TNCs duplicate existing operations abroad in order to gain access to new markets, and ‘vertical’ FDI, where TNCs invest in a upstream or downstream operations, and which is motivated by a desire to optimize production chains (Beugelsdijk et al., Citation2008). Another way is to distinguish between investments in new assets (i.e. ‘greenfield’ FDI) and the acquisition, leasing and licensing of already existing assets (i.e. ‘brownfield’ FDI) (Auerbach et al., Citation1993) These distinctions are meaningful, but fail to account for variations in the actual business functions realized through different investment projects. Compare, for instance, a TNC’s investment in a manufacturing plant in Poland with the relocation of its headquarters to Malta. Both the benefits that the host countries can expect to reap from these investments and the macro-institutional features they require to attract them are likely to vary considerably.Footnote3
In this paper, we propose a functional disaggregation of FDI. We draw on insights from the International Business and Management literature (e.g. Desai, Citation2009; Braunerhjelm & Ekholm, Citation1998) to trace the fundamental restructuring over the last couple of decades of the organizational design and legal-financial structure of large internationally operating firms,Footnote4 a process we propose to refer to as the great fragmentation of the firm. This allows us to disaggregate FDI into five categories based on the specific business function performed by the foreign subsidiaries in which the investment is made. Specifically we distinguish between FDI in manufacturing affiliates, shared service centers, R&D facilities, intermediate holding companies and top holding companies. We then compile a novel dataset which combines firm and country-level data and that allows us to assess, for each category of FDI, which EU member states are most successful in attracting it, some of the political benefits their governments may receive from doing so,Footnote5 and which tax incentives and macro-institutional features are present in countries that attract these different categories of FDI. We conclude by profiling countries according to the specific combinations of categories of FDI they attract. This prompted us to identify five, what we call, FDI-attraction profiles: manufacturing centers, back-office centers, innovation centers, coordination centers and profit centers.
By developing the notion of the great fragmentation of the firm and functionally disaggregating FDI, we shine a new light on debates in all three strands of literature discussed above. First, we advance existing knowledge about the factors that drive TNCs’ foreign investment decisions by showing that different types of FDI are associated with different locational determinants. Second, we introduce a new way of thinking about the structure and dynamics of international competition for FDI. Our identification and characterization different FDI attraction profiles suggests that the increased footloosness of firms has not translated into countries competing for FDI in a race of all against all, but rather that countries occupy different niches in which they compete for specific categories of FDI. It is in this sense that the title of our paper speaks of countries competing not for capital, but for capitals. Third, our characterization of FDI attraction profiles also contributes to debates about the political-institutional underpinnings and distributional implications of FDI-led growth regimes. Given our finding that each FDI attraction profile comes with its own kinds of benefits, and thus favors distinct social groups, we should expect different FDI attraction profiles to be politically supported by different kinds of interest coalitions.
The paper proceeds as follows. The following two sections develop the theoretical and analytical framework that underpins the empirical analysis we present in the second part of the paper. Section two discusses the ‘great fragmentation of the firm’. Section three then provides a schematic depiction of the anatomy and geographical dispersion of the contemporary firm. Specifically, it distinguishes between five different types of corporate subsidiaries, which correspond to our five different categories of FDI. The paper then turns to the empirical analysis. Section four details the analytical approach and discusses the data used for the analysis. Subsequently, section five presents the results of the analysis. Finally, section six concludes by summarizing our results and suggesting some of the implications of these results for policy-making and further research.
2. The great fragmentation of the firm
The impressive expansion of global FDI in recent decades has been a symptom of a fundamental reorganization during that period of the architecture of TNCs. This reorganization, we propose, is best understood in terms of a fragmentation and geographical dispersion of TNCs’ operational activities and legal-financial structure, a phenomenon we will refer to as the great fragmentation of the firm.
Conceptually, the great fragmentation of the firm can be thought of as transpiring on two levels of corporate organization. At the operational level, the notion of the great fragmentation of the firm captures the unbundling and geographical dispersion of TNCs’ operational activities. This level of the great fragmentation has been well-documented in the International Business and Management literature as well as the Political Economy literature on Global Value Chains and Global Production Networks. These bodies of literature discusses how, driven by growing demands to maximize shareholder value, and facilitated by advances in information and communication technology (ICT) and gradual reductions in trade and investment barriers, from the 1980s onwards large firms increasingly began to unbundle, outsource and relocate part of their operational activities offshore. Over time, these processes have resulted in the emergence of global value chains through which large TNCs, so-called ‘lead firms’, organize and coordinate their productive operations across geographies (Coe et al., Citation2008; Gereffi et al., Citation2005). Most salient in this regard, both politically and in terms of scholarly interest, has been the relocation of TNCs’ manufacturing activities to low labor-cost countries (Blinder, Citation2006).
However, the offshoring of operational activities has not been confined to manufacturing activities. Since the second half of the 1990s, TNCs have increasingly been unbundling, outsourcing and offshoring business support services as well (McIvor, Citation2010). The offshoring of business support services has involved not only back office and support operations, such as human resource management, legal services, and accounting (Wilson, Citation1995), but also front-office operations such as customer support (Breathnach, Citation2000) and even research and development activities (Dachs et al., Citation2014). As of recently, the unbundling and geographical dispersion of TNCs operational activities has also come to affect those functions that traditionally were combined in the TNC’s global corporate headquarter (Desai, Citation2009). For example, TNCs’ global treasury and financing function might be separated from other headquarter functions to be performed by a separate legal entity operating from a jurisdiction that provides the optimal institutional environment for the performance of that specific function. Similarly, strategic management might be offshored to jurisdictions that provide large pools of managerial talent and that are conveniently located in the proximity of major markets.
At the legal-financial level of corporate organization, the great fragmentation of the firm involves processes of legal restructuring and financial innovation that enable firms to more efficiently capture the value created by their globalized operational activities. This dimension of the great fragmentation is currently being explored in the emerging literature on Global Wealth Chains (Bryan et al., Citation2017; Seabrooke & Wigan, Citation2017). Based on our reading of this literature, we distinguish three important features of the rethinking of the legal-financial organization of the corporate group. A first feature has been the interposition of (intermediate) holding companies in group ownership structures. These are companies that engage in narrowly defined activities such as the holding of equity or debt stakes in group subsidiaries or the holding of rights to the (sub)licensing of intellectual property. The use of holding companies has increased significantly since the 1990s. For example, assets held by intermediate holding companies in the Netherlands have increased from under 1.8 EUR trillion in 2006 to 3.8 EUR trillions in 2015.Footnote6 For Germany, assets held by intermediate holdings increased by 1400% from 1989 to 2001 (Weichenrieder & Mintz, Citation2008).
A second feature has been the rearrangements of important value-creating assets, especially intellectual property such as copyrights, patents, and trademarks, across group subsidiaries. Through intra-group transactions and cost-contribution agreements,Footnote7 either intellectual property assets themselves, or (parts of) the rights to the income streams generated by those assets are transferred to group holding companies established especially for the purpose of holding those assets.
A third feature concerns innovative approaches to intra-group financing arrangements, often supporting a strategy called ‘earnings stripping’. In the case of earnings stripping, subsidiaries located in high-tax jurisdictions are financed by subsidiaries located in low-tax jurisdictions. The interest on the debt paid by the subsidiary in the high-tax jurisdiction reduces the taxable profits reported in that jurisdiction, while the interest income registered in the low-tax jurisdiction is taxed at a very low rate—or is not taxed at all.
3. The anatomy and geographical dispersion of corporate groups
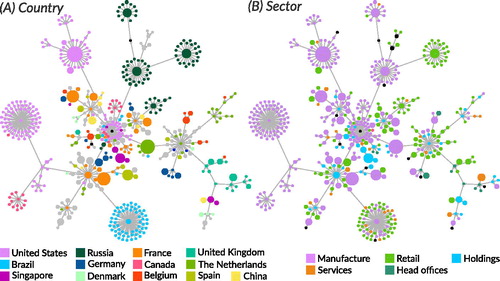
Over the last couple of decades, the operational and legal-financial fragmentation of the TNC has resulted in a transformation of the large firm from a functionally diverse, but legally and jurisdictionally contained enterprise to a multi-subsidiary corporate group, in which different functions are fulfilled by specific subsidiaries that often exist as separate legal entities in different jurisdictions. A typical TNC, or corporate group,Footnote8 nowadays has dozens, if not hundreds of subsidiaries, each of which fulfills a specific role in the broader scheme of the corporate groupFootnote9 (). Although the constellation and specific functions of individual subsidiaries are idiosyncratic and unique for each corporate group, for analytical purposes we distinguish between five broad types of subsidiaries. These are manufacturing affiliates; shared service centers; R&D facilities, top holding companies; and intermediate holding companies. Below, we discuss for each of these types of subsidiaries the kinds of activities they engage in, their specific function in the broader scheme of the corporate group, the macro-institutional arrangements and tax incentives that can be expected to attract these types of activities, and the benefits that countries can expect to receive from the hosting of such subsidiaries.
Figure 2. Corporate structure of a large food company. Nodes represent different subsidiaries, connected by ownership relationships. Colors indicate (A) country of incorporation, and (B) type of entity. Node size indicates turnover reported by the entity.
3.1. Manufacturing affiliates
A first type of subsidiary is the manufacturing affiliate. Beginning in the 1960s, and increasingly so with the gradual abandonment of international trade and capital barriers in the 1980s and 1990s, TNCs have outsourced and relocated parts of their manufacturing operations to foreign locales. Initially, such relocations primarily involved the most routine and labor-intensive of TNCs’ manufacturing operations and were driven above all by a search for labor cost advantages (Lewin & Peeters, Citation2006). Over time, however, TNCs increasingly began to relocate more complex tasks and have moved beyond cost savings to consider such things as worker skills, infrastructure, and government trade and investment policies (Ellram et al., Citation2013).
In addition to the benefit of low labor costs and other institutional factors, manufacturing affiliates often make use of special regulatory and tax regimes available in the new host country. Such ‘special economic zones’ typically offer a combination of tax and tariff incentives and may even exclude firms operating in those zones from labor, environmental and ownership regulations that apply to firms operating elsewhere in the country (Farole & Akinci, Citation2011).
Manufacturing activities are typically the most labor-intensive subsidiaries of a corporate group. So when a TNC relocates parts of its manufacturing operations abroad, this is generally believed to have significant and beneficial employment-creating effects in the manufacturing sector of the new host country (Harrison & Rodríguez-Clare, Citation2010). Moreover, the offshoring of manufacturing operations by a lead firm in a particular global supply chain may also give a significant boost to the non-exporting segment of the manufacturing sector in the new host country as local suppliers flock around the lead firms production operations (Berger, Citation2005), potentially giving rise to the emergence of manufacturing, or industrial, clusters (Fan & Scott, Citation2009).
3.2. Shared service centers
A second cluster of group subsidiaries consist shared service centers. These are subsidiaries that provide centralized support services to other group entities. This may involve both low value-adding back-office operations, such as information technology, human resource management and accounting, as well as higher value-adding services, such as procurement, marketing, sales and distribution. Some firms have opted for an outsourcing strategy, in which specific services (mostly the lower value-adding back-office operations) are provided by a third party service provider. A trend in recent years, however, has been for TNCs to centralize and ‘in-source’ some or all business support activities and have them performed by a captive entity (Bondarouk, Citation2014; Lewin & Peeters, Citation2006).Footnote10 This entity, known as a ‘shared service center’ (SSC), then provides the services to other group entities. Such an SSC may serve the entire corporate group or selected group entities operating in a specific geographical region or line of business.
Two considerations may lie behind the establishment of shared service centers. The first is cost reduction. SSCs allow corporate groups to benefit from economies of scale and avoid duplication of services across subsidiaries. Moreover, when located in jurisdictions that provide inexpensive labor, the establishment of SSCs can result in substantial savings on labor costs (Lewin & Peeters, Citation2006). An increasingly important driver for the growing use of SSCs, however, is a desire to source new organizational capabilities (Lewin & Peeters, Citation2006). TNCs increasingly discover that offshoring technical, professional and administrative activities allow them to tap into new pools of highly qualified staff (Lewin & Volberda, Citation2011).Footnote11 Regardless of which of these considerations prevails, the successful implementation of SSCs relies heavily on the availability of good transportation and ICT infrastructure and the availability of an English speaking workforce (Doh et al., Citation2009). Taxes, on the other hand, appear to play only a secondary role in TNCs’ decisions where to locate their SSCs. A survey conducted by management consulting firm Deloitte amongst 311 large firms that had established over 1,000 SSCs found that 70% of companies do not take taxation into consideration when choosing the location of their SSCs. We expect that this might be partly explained by the fact that SSCs are often run as cost, rather than profit centers and thus make little or no taxable profits. Still, 17% of companies setting up SSCs do so with the objective to reduce their global tax burden—for instance through transfer pricing strategies.Footnote12
The benefits countries receive from hosting SSCs come primarily in the form of job creation. This may be effectuated in two ways. First, SSCs can be large employers in the service sector of a country’s economy. The previously mentioned Deloitte surveyFootnote13 found that 43% of the SSCs in their sample employed more than 100 people, with 15% employing more than 500 people. SSCs may also contribute to job creation in a more indirect way. The establishment of SSCs in a particular country may provide a boost to the domestic services sector in that country, thereby contributing to job creation in the sector, or attract large multinational business service firms to a country. Moreover, since SSCs ‘sell’ their services to group entities located in other countries, host countries see their services exports increase and their current account balance strengthened.
3.3. Research and development (R&D) facilities
A third cluster of group subsidiaries consists of TNCs’ R&D facilities. These are subsidiaries that are responsible for TNCs’ product innovations. Although up until the 1990s these activities used to be performed in the context and proximity of TNCs’ global headquarters (Patel & Pavitt, Citation1991), increasingly TNCs are relocating them across jurisdictions (Dachs et al., Citation2014).
Existing literature identifies three main motives underlying the internationalization of TNCs’ R&D activities (Carlsson, Citation2006). The first is for TNCs to adapt the design and development of their goods and services to the specific needs of local markets (Fors & Zejan, Citation2012). This is typically done for markets that are especially important for a firm’s sales figures. Another motive for the relocation of R&D facilities is to bring them in closer proximity to TNC’s previously offshored manufacturing operations. Finally, a third, and increasingly prominent, motive underlying the relocation of R&D activities away from TNCs’ home country is a desire to establish a presence in highly innovative regions and cities (Florida, Citation1997). TNCs relocating their R&D activities to such regions do so to get access to local talent and knowledge. Important considerations taken into account by TNCs seeking to tap into local innovative capacities are the availability of highly qualified personnel and a high density of universities and other types of research institutions (Cantwell & Piscitello, Citation2002; Dachs et al., Citation2014). The cost of R&D personnel appears to be of only minor importance in the R&D location decision (Dachs et al., Citation2014). Instead, TNCs value countries, and regions within countries, that provide for attractive living conditions that make it easy to attract additional knowledge workers from abroad (Malecki, Citation1987).
Although there appears to be consensus in the literature that macro-institutional factors dominate TNCs’ R&D offshoring decisions, tax incentives are said to play a role as well (Cantwell & Mudambi, Citation2000; Hines, Citation1994). Tax incentives for R&D activities may involve tax credits for R&D expenditures or so-called patent or innovation boxes, whereby income emanating from qualifying IP is taxed at a reduced rate (Evers et al., Citation2015). Especially the latter type of incentive has become widely used in Europe over the last decade. As of June 2017, 14 European jurisdictions had introduced some form of innovation box.Footnote14 Moreover, to attract foreign high-skilled workers, and thus increase their attractiveness as a location for TNCs’ R&D activities, some jurisdictions have implemented temporary tax reductions for personal income taxes for foreign knowledge workers.
When it comes to the potential benefits that host countries might reap from the relocation of R&D activities, discussions in the literature tend to focus on the promise of knowledge spillovers and productivity gains (Hejazi & Safarian, Citation1999; Kim & Park, Citation2017; Saggi, Citation2002). However, research on the policy strategies that governments adopt to attract FDI in R&D suggests that national investment promotion agencies consider the quantity and quality of jobs created as some of the most important factors in their evaluation of potential R&D investment projects (Guimón, Citation2009).
3.4. Top holding companies
The fourth cluster of group subsidiaries we identify are top holding companies. Top holding companies are companies that appear at the apex of a corporate group’s ownership structure and therefore are often referred as the group’s ‘global ultimate owner’ (GUO). These entities play a key role in the legal-financial organization of the group. The location of the top holding company generally determines the legal home of a corporate group and thereby not only the company law under which it operates, but in many cases also its tax residency.Footnote15 Since a large fraction of profits are typically transferred to the top holding company, the tax residency of that company plays a key role in the consolidated tax rate of the group (Dischinger et al., Citation2014). For publicly listed TNCs, the top holding company is also the legal entity whose shares are traded on a stock exchange and thus administers the group’s relationship with its external shareholders. This means that the tax regime of the jurisdiction in which the top holding is domiciled determines how dividend payments to shareholders are taxed.
Not all top holdings, however, are the same. The traditional top holding company would be domiciled in the jurisdiction from which the group originated and not only fulfill a key role in the legal-financial organization of the corporate group, but also act as the group’s global headquarters and thus perform most or all of the corporate functions responsible for the orchestration of the group’s global value chains: strategic management, shared services, and compliance and reporting (Baaij et al., Citation2015). In today’s fragmented TNC, these functions are increasingly unbundled and relocated to jurisdictions that provide the optimal conditions for the performance of those specific functions (Baaij et al., Citation2015; Desai, Citation2009). Examples of traditional headquarter functions that TNCs may detach from their top holding and relocate across borders are the staff function (resulting in the establishment of SSCs), the group financing and treasury function (resulting in group financing companies—see next subsection), and the strategic management function (resulting in divisional and regional headquarters—see next subsection).
Given the large impact of the tax regime that applies to a top holding on the overall tax burden of a corporate group, TNCs have large incentives to transfer their top holding to a jurisdiction with low corporate income tax rates and/or more favorable legislation (Baaij et al., Citation2015; Voget, Citation2011). In the period 1997–2007, 6% of all multinationals relocated their headquarters to another jurisdiction by means of corporate inversions or mergers with a foreign firm (Voget, Citation2011). Over 50 percent of US multinationals that relocated their headquarters to another jurisdiction by means of corporate inversions in the period 1990–2016, did so to countries with no corporate income tax—mainly the Cayman Islands, Bermuda and the British Virgin Islands (Slangen et al., Citation2017). Transferring the top holding to another jurisdiction may have other non-tax related benefits as well. For instance, it has been suggested that top holding relocations may enable TNCs to improve communication and knowledge exchange with investors (Birkinshaw et al., Citation2006), and give them access to new pools of managerial talent (Baaij et al., Citation2015).
The benefits that countries receive from hosting top holding companies thus very much depend on the scope of the activities performed by the top holding. When a top holding company only serves as legal seat, but carries out few or no real activities, then benefits for the host country come almost exclusively in the form of increased revenues from corporate taxes and incorporation fees.Footnote16 If, on the other hand, a top holding company carries out some or all of the traditional corporate headquarter functions, substantial employment benefits for the host country can be expected. Global headquarter functions are associated with high-quality jobs, and can potentially give rise to agglomeration effects and result in significant knowledge spillovers (Davis & Henderson, Citation2008).
3.5. Intermediate holding companies
These are holding companies that may appear anywhere under the top holding in a corporate group’s ownership structure. Intermediate holding companies appear in different forms and may be used for a number of purposes. One such a purpose is the tax-efficient channeling of the value that is created by operating subsidiaries to the parent company. To achieve this, debt or equity investments made by the parent company are not made directly into a foreign subsidiary, but indirectly through an intermediate holding company, or ‘conduit’ entity. Returns made on those investments are then channeled back to the parent company through the conduit entity in the form of interest or dividend payments. Intermediate holdings may also be used for the channeling of royalty payments. Such ‘royalty conduits’ may receive royalty payments because they are the legal owner of an intellectual property asset itself or because they own the economic rights to the royalty income generated by the asset due to a licensing agreement with the group entity that legally owns the asset (Maine & Nguyen, Citation2017). The above described dividend-, interest-, and royalty conduit functions may also be combined in a single intermediate holding company.
The archetypical intermediate holding company is one that has few employees and plays only a minor role in managing and directing group activities. This may be different, however, in the case of intermediate holding companies that combine pure holding activities (i.e. the holding and administering of assets, be they financial, tangible, or intangible assets) with strategic, coordinating or capital management functions. The best example of such multifunctional intermediate holding companies are regional headquarters. Regional headquarters are typically designed to both hold the equity capital of operational subsidiaries active in the relevant region and to engage in strategic decision-making and coordinating functions regarding the TNC’s activities in that region. It is also not uncommon for a regional headquarters to accommodate a shared service center offering business support services to operating subsidiaries in that specific region. Another example is the group financing company, sometimes also referred to as the group’s treasury. These are entities that are responsible for the management of intra-group financial transactions, such as intra-group lending, group liquidity management, hedging, and other financial operations that had traditionally been part of the finance function of the corporate headquarter.
A number of institutional features can make a jurisdiction an especially attractive location for the establishment of intermediate holding companies and/or regional headquarters. One is the availability of the institutional infrastructure necessary to support intermediate holdings companies: a stable and efficient state apparatus, sufficiently advanced ICT infrastructure, and the availability of knowledgeable tax advisors, trust firms, and other types of business services (Eicke, Citation2009; Wójcik, Citation2013). For group treasuries, having access to deep and developed capital markets may represent an important consideration (Eicke, Citation2009). Perhaps even more important for TNCs’ decisions where to locate their intermediate holding companies, however, are the specificities of a jurisdiction’s tax regime. One such specificity is the absence of withholding taxes on outgoing and incoming dividend, interest and royalty payments, or the availability of reduced rates on such payments. Typically, therefore, intermediate holding companies are located in jurisdictions that provide TNCs with access to an extensive network of bilateral tax treaties, enabling them to significantly reduce the tax costs of funneling payments through a specific jurisdiction (Weyzig, Citation2013). Other aspects of a country’s tax regime that TNCs may consider in the location decision for their intermediate holding companies are the administrative burden created by tax compliance and the existence and enforcement of anti-avoidance provisions. Finally, the availability of investment treaties with countries in which an envisioned holding company’s subsidiaries are located may further increase the attractiveness of a jurisdiction as a location for an intermediate holding company.
From a country perspective, the benefits that come with the hosting of intermediate holding companies depend very much on the extent to which these companies are pure conduit entities or engage in a broader scope of activities. For intermediate holding companies that act as pure conduit entities, the benefits should primarily be looked for in additional tax revenues and indirect employment effects. Effective tax rates on the dividends, interests, and royalties that flow through these entities may be minimal, but because of the sheer size of these flows, they may generate substantial tax revenues for the host country nevertheless. In the case of the Netherlands, for instance, financial flows through intermediate conduits of €4 trillion (five times the size of the country’s GDP) contribute an estimated €3 to €3.4 billion in taxes, salaries and services hired (Berg et al., Citation2008; Kerste et al., Citation2013). Conduit entities themselves employ few employees, but the establishment and maintenance of intermediate holding companies require the services of local corporate service providers (i.e. notaries, trust firms, tax advisors, lawyers, etc.) and thus has employment-creating effect in those sectors. This is different, however, when the intermediate holding company also serves as a regional headquarter. In this case, the intermediate holding company might employ substantial numbers of employees and contribute significantly to a country’s services exports.
The representation of the anatomy of the contemporary firm sketched in the previous paragraphs is, of course, a highly stylized one. Explicitly distinguishing between FDI in these five different types of operations does, however, provide a degree of analytical traction that has been missing in previous analyses of international competition for FDI. In the ensuing analysis we exploit this analytical traction to develop a more sophisticated understanding of this phenomenon. Specifically, we answer three simple questions: Which EU countries attract which types of FDI? What institutional and tax arrangements do they use to do so? And what are the benefits they receive from doing so in terms of tax revenues and employment creation?
4. Analytical approach, data and visualization
4.1. Analytical approach
To answer these questions we conducted a two-step analysis. In a first step we determined for each of the five categories of FDI identified in section three which EU member statesFootnote17 are most successful in attracting those activities. Because the available data on FDI does not distinguish between the different types of investment projects that are financed by the FDI flows, we constructed a set of indicators that gauge the intensity of the economic phenomena and activities associated with each type of FDI. Throughout the remainder of the article we denote these indicators as activity indicators.
In a second step we collected a range of macro-institutional and tax policy indicators to understand which macro-institutional features and tax policies may be associated with those countries that are most successful in attracting the different categories of FDI. For example, based on our reading of the literature, we include labor costs and corporate income tax rates as possible determinants of foreign direct investments in manufacturing affiliates, while we include the availability of low withholding taxes as a possible determinant for investments in intermediate holding companies. Throughout the ensuing text, we label our indicators using square brackets (e.g. [Governance]).
The motivations for our indicators and the exact operationalization of each indicator can be found in Table S1 and section S5 in the Appendix.
4.2. Data
To construct our indicators we use a combination of macro (country-level) and micro (firm-level) statistics. Macro statistics were collected from Eurostat, World Bank Open Data, the International Bureau of Fiscal Documentation, and UNCTADstat. Since we obtain the majority of our indicators from Eurostat, we generally lack data on Switzerland. Micro statistics were collected from the Orbis database. Orbis collects information on over 250 million public and private firms worldwide from official country registrars and other country collection agencies, and it is a frequently used source of data (Garcia-Bernardo et al., Citation2017; Johannesen et al., Citation2016; Vitali et al., Citation2011) that offers good coverage for EU’s firms (Garcia-Bernardo & Takes, Citation2017). All indicators were calculated as the mean value for the period 2007–2017, or a subset of the period when data was not available for all years. Our selection of the 2007–2017 period reflects two considerations. The first is purely pragmatic; this is the only period for which all databases provide data. The second is that our activity indicators reflect stocks of FDI, rather than flows. This implies that each indicator reflects investments accumulated prior to the period. Because, as stated in the introduction, we decided to focus our analysis on non-financial corporations, we restricted the Orbis and Eurostat data to include only non-financial corporations. For a complete description of all the indicators, including sources, time data availability and descriptive statistics see Tables S1–S6 in the appendix as well as the Supplementary Methods section. In order to ensure replicability and cumulative knowledge-building, all our indicators and Python code are available at https://osf.io/7xwtb/ under public license Creative Commons Attribution-ShareAlike 4.0.
4.3. Visualization of the results
4.3.1. Normalization
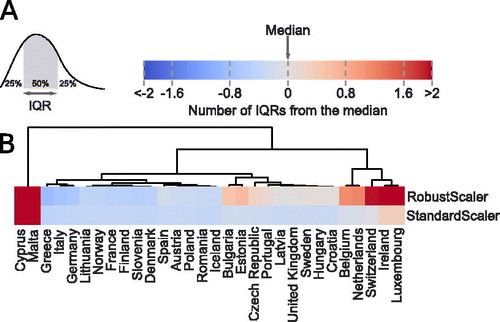
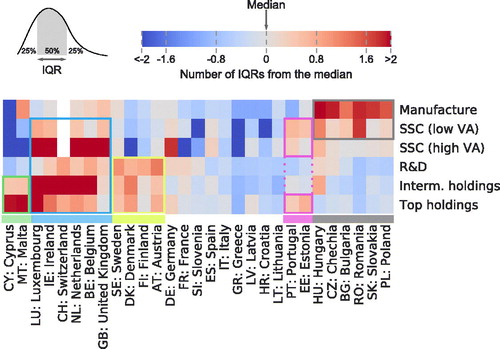
Our visualization strategy assigns a color to a numerical value, where blue corresponds to low values and red corresponds to high values. Using the same matching between colors and numerical values in all variables would be infeasible since the range of our variables varies by several orders of magnitude. While the average tax rate of multinationals is 0.18 (±0.07), the average time to complete and submit taxes is 192.2 (±99) days. In order to visualize the results effectively, we need to normalize all variables so that they lie in the same range. A common normalization strategy (StandardScaler) is to subtract the mean and divide by the standard deviation, which standardizes all variables to have mean equal to zero and standard deviation equal to one. However, this strategy is not robust to outliers—such as Malta with an FDI stock 16 times the size of its GDP. Instead, we use another normalization strategy (RobustScaler) where we subtract the median and divide by the interquartile range—the range between the 1st quartile (25th percentile) and the 3rd quartile (75th percentile) (). visualizes the data on FDI flows in 2017 (Figure S2 in the Appendix) using both RobustScaler and StandardScaler. When using RobustScaler we are able to see both the outliers (Malta and Cyprus) and countries attracting high FDI stocks (Belgium or Netherlands) in red, while for the StandardScaler strategy only the outliers are visible.
Figure 3. Visualization of our results. (A) Example of the interquartile range (IQR) and the color scheme used throughout the analysis. (B) Example of the FDI stock by country using two normalization strategies. Note that the outliers (Malta and Cyprus) reduce the range of countries visible with the StandardScaler strategy.
4.3.2. Clustering
We use the activity indicators to identify countries that compete for a specific category of FDI. We make use of a clustering algorithm to guide our interpretation of the results. The clustering algorithm calculates the distance between two countries based on the differences between all activity indicators. For instance, in there are two variables (RobustScaler and StandardScaler). There is a small distance between two countries if they have similar values for both variables. The algorithm then constructs a tree, where countries appear in adjacent branches if the distance between them is small—e.g. Cyprus and Malta, or Luxembourg, Ireland, Switzerland, the Netherlands and Belgium.
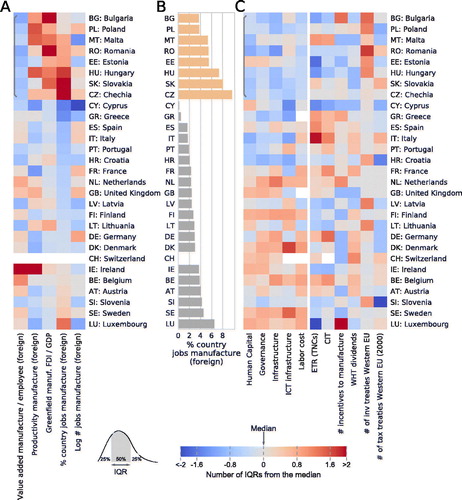
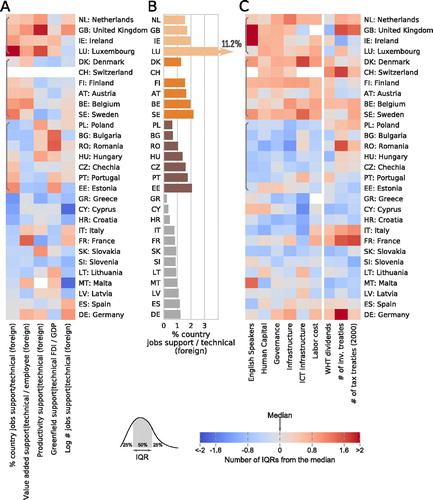
Figure 4. Manufacturing affiliates. (A) Activity indicators, (B) benefits, and (C) macro-institutional features and tax incentives associated with attracting manufacturing affiliates. The identified clusters of countries is marked with a gray bracket (A,C) and different shades of orange (B). See Table A1 for a complete explanation of the indicators. Countries are sorted according to their assigned cluster.
To arrange countries into groups, many different clustering algorithms can be used. Each of these techniques uses its own distance formulas, and thus yields different results. In order to avoid cherry-picking a clustering technique that produces ‘meaningful’ results, we apply the default algorithm and use the results only as a starting point, on the basis of which we then cluster the countries manually. The initial clustering is provided in Figure S3. A detailed explanation of the clustering algorithm and its possible variations is provided in the Supplementary Methods.
4.3.3. Country summaries and FDI attraction profiles
We summarized how successful countries are at attracting each category of FDI by using the sum of all activity indicators, separating low and high value-adding activities (see section S4 in the Appendix). In order to compare the European countries among themselves, the success of each country was then normalized using the method from Section 4.3.1. We created the six FDI-profiles using the information from cluster analysis of each of the five types of FDI, and by using cluster analysis on the cluster summary (see section S4).
5. Results
5.1. Manufacturing affiliates
We first identified those countries that attract disproportionate amounts of TNCs’ manufacturing affiliates. We found a prominent cluster of countries composed of Romania, Hungary, Poland, Slovakia, Czechia, Estonia, Malta and Bulgaria (). All these countries engage primarily in low value-adding manufacturing activities for which they show high levels of wage-adjusted productivity. Moreover, this cluster of countries receives greenfield investment flows in the manufacturing sector of 2.0% (±0.8%) of their GDP, which contrasts with the 0.4% (±0.3%) received by all other countries.Footnote18 There is, however, a broad distinction within this cluster between those countries in which a large fraction of the labor force is employed in foreign owned companies in the manufacturing sector and those in which this fraction is much smaller (). In Malta, Romania, Estonia, Hungary, Slovakia, and Czechia the number is 6.9% (±1.8), whereas for Poland and Bulgaria it is 3.7% (±0.5%). For the latter group of countries, however, a number of factors might partly explain these relatively low numbers. For Poland, the country’s large population size has a significant downward effect on the percentage of the labor force employed by foreign firms. The raw number of jobs created in that country, however, is 680,000, considerably higher than the numbers for countries of similar size, such as Spain and Italy (386,000 and 429,000 respectively). For Bulgaria, the size of greenfield investment suggests that a future increase in the number of jobs in foreign-owned manufacturing operations can be expected.
We next moved to the macro-institutional and tax arrangements associated with the countries previously identified (). As anticipated, since we assume cost reductions to be the primary motivation for the offshoring of manufacturing operations, all countries previously identified score low on all macro-institutional indicators when compared with the EU average. As shows, labor costs are especially low in Romania and Bulgaria. These countries’ exceptionally low labor costs may be an important factor in explaining why since 2007, the year they joined the European Union, these countries have been the largest recipients of greenfield FDI in manufacturing activities. Regarding the tax indicators (which, in are separated from the macro-institutional indicators by a thin white line), we see that all the identified countries have corporate income tax rates that are significantly lower than those for most other European countries, with the notable exceptions of Ireland and Cyprus. They also all stand out both in terms of the number of tax incentives targeted specifically to investments in manufacturing activities and in terms of the low levels of withholding taxes that they levy on outbound dividend payments. We also observe that all countries that attract manufacturing affiliates, except Slovakia and Czechia, had signed large numbers of investment treaties, but not tax treaties, with Western Europe before they entered the European Union. This suggests that withholding tax considerations are secondary to the securing of property rights in TNCs’ decisions where to locate their offshored manufacturing activities.
5.2. Shared service centers
We next identified countries that attract disproportionate numbers of TNCs’ SSCs. Here we identified three clusters of countries that do so (). All countries in those three clusters (with the notable exceptions of Poland and Bulgaria, which we will discuss below), see a relatively large fraction of their labor force employed in foreign owned SSCs. The first cluster, consisting of the Netherlands, Ireland, United Kingdom and Luxembourg attracts high value-adding SSC activities, has high wage-adjusted productivity and receives large amounts of greenfield investments in SSC activities. The second cluster, composed of Finland, Austria, Belgium and Sweden also attracts high value-adding SSC activities but shows lower wage-adjusted productivity and also somewhat lower levels of greenfield investment in SSCs. We interpret this difference as the second cluster being somewhat less attractive as a location for TNCs’ high value-adding SSC operations and therefore attracting fewer such operations. The third cluster, composed of Poland, Bulgaria, Romania, Hungary, Czechia, Portugal and Estonia, is characterized by low value-adding activities but high levels of adjusted productivity. In this third cluster, foreign owned SSCs employ 1.3% (±0.5%) of the labor force, compared to 4.1% (±4.7%) and 1.7% (±0.3) for the first and second clusters respectively (). However, Bulgaria receives the second highest flows of greenfield FDI and we thus expect employment numbers to increase in the following years. In the case of Poland, the large size of their labor force causes a downward bias in the share of the labor force employed in foreign owned SSCs. In fact, the raw number of workers in foreign owned SSCs in Poland (372,000) is two to four times higher than the number for Romania (183,000), Portugal (107,000), Czechia (102,000) and Hungary (78,000).
Figure 5. Shared service centers. (A) Activity indicators, (B) benefits, and (C) macro-institutional features and tax incentives associated with attracting shared service centers. The three identified clusters of countries are marked with gray brackets (A,C) and different shades of orange (B). See Table A1 for a complete explanation of the indicators. Countries are sorted according to their assigned cluster.
Looking at the macro-institutional and tax policies associated with the countries in those three clusters (), we make the following observations. High value-adding SSC activities (first and second clusters) take place in countries that combine high levels of human capital, governance and infrastructure with an expensive, but highly productive labor force, while the contrary is true for low value-adding activities (third cluster). Similar to the manufacturing case, tax considerations appear to be secondary to macro-institutional determinants in TNCs’ decisions where to locate their SSC activities. We assume this to be a result of the fact that most SSCs are run as cost centers and therefore do not make substantial amounts of taxable profits.
5.3. R&D facilities
Thirdly, we identified countries that attract disproportionate amounts of TNCs’ R&D facilities. We found two clusters of such countries (). The first consists of a heterogeneous group of highly developed countries. All countries in this cluster have a large R&D sector, evidenced by the large share of their labor force employed in corporate R&D facilities and the large numbers of patent applications by both domestic and foreign firms. Moreover, these countries all display high levels of R&D expenditure financed from abroad, which indicates that a significant proportion of R&D operations in those countries is conducted by foreign owned firms. This is further confirmed by the fact that, corrected for the size of their economies, these countries show high numbers of patent applications by foreign owned companies. Three countries within this cluster (Belgium, Ireland and the United Kingdom) distinguish themselves from the others in that foreign owned firms account for 42–45% of all patent applications in those countries—compared with 16–31% in the rest of the cluster. The second cluster consists of Hungary, Bulgaria and Czechia. Compared to the first cluster, R&D takes a much less prominent role in these countries’ economies, as evidenced by the much lower fraction of their labor forces employed in R&D operations as well as the low number of patent applications by domestic firms (). They do, however, receive high values of foreign R&D expenditure, suggesting that foreign firms see them as suitable locations for their offshored R&D activities nevertheless.
Figure 6. R&D facilities. (A) Activity indicators, (B) benefits, and (C) macro-institutional features and tax incentives associated with attracting R&D facilities.The two identified clusters of countries are marked with gray brackets (A,C) and different shades of orange. See Table A1 for a complete explanation of the indicators. Countries are sorted according to their assigned cluster.
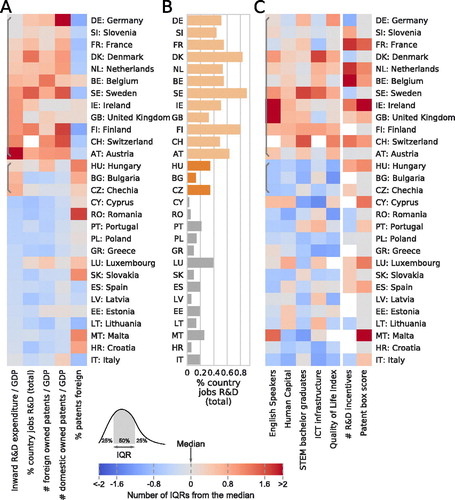
To get a deeper understanding of the differences between the two clusters, we then looked at the macro-institutional and tax features of these countries. For the first cluster of highly developed countries, fluency in English, ICT infrastructure, graduates in science and technology and quality of life highly correlate with foreign owned R&D activities (). This was expected, since TNCs operate R&D facilities in those countries where the skills are located. The top three countries by foreign R&D investment (Austria, Switzerland and Finland) rank 4th, 2nd, and 3rd for quality of life and 6th,3rd and 2nd for graduates in science and technology. For the second cluster of countries, low labor costs appear to dominate over other indicators. Most likely, the fact that these countries see comparably large amounts of their total R&D expenditures come from foreign owned companies and see a large percentage of their domestic patent applications come from foreign owned companies as well, is due to the prominent presence of foreign owned manufacturing activities in those countries. As explained in section 3.3, one motivation for TNCs to relocate some of their R&D activities is to have them in the proximity of their already offshored manufacturing operations. Finally we found that R&D incentives (with the notable exception of the patent box) are correlated with R&D activity. However, we also found a number of countries (i.e. Sweden, Austria or Denmark) that offer only a small number of R&D incentives but nevertheless attract high levels of foreign R&D investments. This indicates that tax considerations play only a secondary role to the availability of talent in those countries.
5.4. Top holdings
We identified two clusters of countries that attract disproportionate amounts of TNCs’ top holding companies (). The first cluster is composed of the three smallest EU member states: Cyprus, Luxembourg and Malta. The second is composed of Ireland, Switzerland, the Netherlands and the United Kingdom.Footnote19 Both clusters attract disproportionate amounts of top holding companies, but countries in the first cluster attract the highest numbers relative to the sizes of their GDPs. Countries in the first cluster also seem to enjoy more significant benefits from hosting top holdings, at least as far as tax revenues are concerned. They raise tax revenues of 5.4% (±0.3%) of their GDP from corporations, compared with 2.5% (±0.5%) in other European countries (). The main difference between the two clusters, however, concerns the profit rate of foreign firms (). The profit rate in the first cluster is 511,000 (±230,000) €/employee,Footnote20 significantly higher than the profit rates in the second cluster (59,000 ± 7,530 €/employee) and all other countries (69,000 ± 38,000€/employee). Furthermore, the three clusters differ from each other in terms of their differential score on the difference in profit rates between multinational and domestic companies. For the first cluster this difference stands at 135,000 (±187,000) €/employee, for the second at 17,000 (±23,000) €/employee, and for the third at −59,000 (±36,000) €/employee. For all other countries this difference stands at −58,000 (±44,000) €/employee.
Figure 7. Top holdings. (A) Activity indicators, (B) benefits, and (C) macro-institutional features and tax incentives associated with attracting top holdings. The three identified clusters of countries are marked with gray brackets (A,C) and different shades of orange. See Table A1 for a complete explanation of the indicators. Countries are sorted according to their assigned cluster.
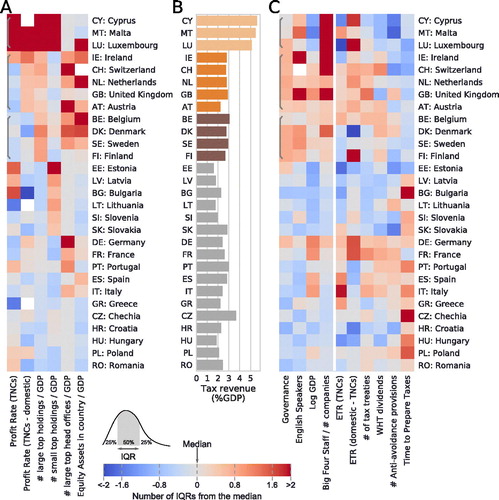
The difference between the countries in the first and second cluster becomes more pronounced when their scores on the macro-institutional and tax indicators are considered (). Most importantly, the effective tax rates (ETRs) for countries in the second cluster are significantly higher than those for countries in the first cluster. We find the median ETR for companies with revenues higher than one million dollars to be 3.9% in Luxembourg, 9.8% in Cyprus, 28.0% in Malta, and 20.6% (±6.0%) in all other European countries. In the Maltese case, however, the effective tax rate excludes an up to six-sevenths refund to shareholders on the tax paid. Including this refund in the calculation would bring the ETR down to 4–8%. Moreover, the low ETRs that multinationals pay in these countries do not necessarily apply to domestic companies. We found that the tax paid by TNCs in countries that belong to the first cluster is up to 11 percentage points lower than the tax paid by their domestic counterparts. We interpret our finding that countries in the first cluster combine low effective tax rates with relatively high profit rates of multinationals, and above those of domestic companies, as an indication that TNCs locate their top holding in those countries primarily for reasons of tax planning. Countries in the second cluster, with lower profit rates of multinationals, larger economies, a higher score on the governance indicator, and higher effective tax rates for multinationals, seem to be able to attract a larger fraction of top holdings that are not exclusively motivated by tax planning considerations, meaning, for example, actual global or regional headquarters. Another difference between the three clusters concerns the absence of an extensive network of tax treaties in the first one. We interpret the apparent unwillingness of countries to sign tax treaties with countries in the first cluster as another indication that TNCs locate their top holdings in Cyprus, Malta, and Luxembourg mainly to reduce their tax burden. For countries in the second and third cluster, on the other hand, we interpret their ability to sign tax treaties with large numbers of countries as an indication that the top holdings located in those countries are perceived as more legitimate by potential treaty partners. Finally, our results further suggest that countries may increase their attractiveness as a location for TNCs’ top holding companies by offering low withholding taxes on dividends and providing for a lenient and efficient tax legislation (low number of anti-avoidance provisions and short time needed to prepare taxes).Footnote21
5.5. Intermediate holdings
Lastly, we identified three clusters of countries that attract disproportionate amounts of intermediate holding companies, or conduits (). The first cluster is composed of Hungary, Malta and Cyprus. Countries in this cluster are all specialized in one type of intermediate holding company. Cyprus operates as a pure dividend conduit, as evidenced by its high value of conduit investment. Hungary and Malta attract disproportionally large payments for the use of intellectual property, reflecting their status as preferred jurisdictions for royalty conduits. The second cluster is composed of a prominent group of multi-purpose countries: Luxembourg, Netherlands, Switzerland, Ireland, Belgium and the United Kingdom. All countries in this group exhibit high values for all types of holding activities. For the case of the United Kingdom, its large GDP—3.4 times higher than the second largest country in the cluster—downplays the importance of the country as a conduit jurisdiction. The third cluster we identified consists of four countries that attract moderate amounts of holding companies: Finland, Sweden, Austria and Denmark. Countries in this group are frequently used as dividend conduits, and occasionally as royalty and interest conduits.
Figure 8. Intermediate holdings. (A) Activity indicators, (B) benefits, and (C) macro-institutional features and tax incentives associated with attracting intermediate holdings. The two identified clusters of countries are marked with gray brackets (A,C) and different shades of orange. See Table A1 for a complete explanation of the indicators. Countries are sorted according to their assigned cluster.
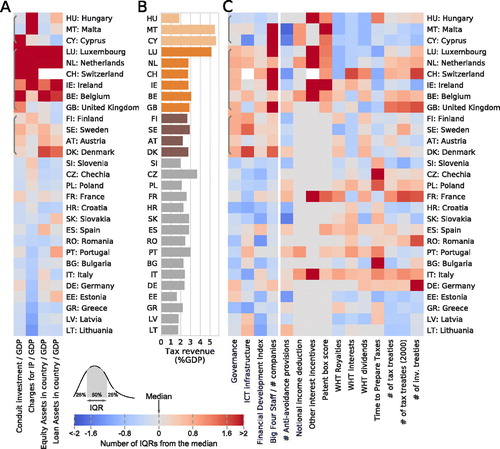
We next analyzed the macro-institutional indicators correlated with the clusters (). We found that countries in the second and third clusters have good governance, a highly developed ICT and financial infrastructure, and a large presence of the Big Four. Contrary, countries in the first cluster exhibit comparatively lower levels of governance and infrastructure (at similar levels than Spain or France), which suggest that tax determinants may be key to their success. Indeed, we found that all three countries have no withholding taxes, a low number of anti-avoidance provisions, and the most generous patent boxes in Europe. The patent box in Hungary (established in 2003) offers a tax rate of 5% on qualifying royalty income, the Maltese patent box (established in 2010) provides a full exemption for all qualifying royalty income, and the Cyprus patent box (established in 2013) offers an 80% exemption in gross profits (tax rate below 2.5%).
The second cluster of countries is also characterized by the presence of a generous patent box, and either the presence of the notional interest deduction or another tax incentive targeting group interest payments. The high correlation between the patent box score and the success to attract royalty holdings indicates that royalty holdings (but not R&D activities) are attracted to places with generous patent boxes, which is consistent with the literature on patent location (Evers et al., Citation2015; Karkinsky & Riedel, Citation2012). Moreover, the correlation between the presence of measures granting special tax treatment for interest income and the loans held by non-financial corporations in a country indicates that interest holdings may be attracted to places with generous interest incentives. Moreover, countries in this group have either no or low withholding taxes (Luxembourg and the Netherlands), or an extensive network of tax treaties (Switzerland, Belgium, United Kingdom). The only exception is Ireland, with moderate withholding taxes and a relatively shallow network of tax treaties. However, withholding taxes in Ireland can be avoided by using a holding company in a third EU country that has an extensive network of tax treaties, since intra-group payments in the EU are exempt from withholding taxes. Countries in this second cluster also have a large network of investment treaties, ensuring investor rights and increasing the attractiveness of a country for dividend holdings. Finally, countries in the third cluster are characterized by the highest levels of governance, reduced regulation and incentives, evidenced by the lack of anti-avoidance provisions and interest incentives.
5.6. Towards a typology of ‘FDI attraction profiles’
To summarize and wrap up the results of our analysis we then profiled all countries according to the different types of FDI they attract. We identified six groups of countries (), each of which we indicated with a unique color mark in the bar just above the country labels. One group of countries (indicated with the white color mark) consists of a heterogeneous set of big and small countries (Germany, France, Slovenia, Spain, Italy, Greece, Latvia, Croatia, and Lithuania) that all appear to be rather unsuccessful in attracting FDI of any category. Countries in each of the other five groups all successfully attract distinct combinations of two or more categories of FDI. We call these distinct combinations FDI attraction profiles. Below we briefly discuss each of these profiles in more detail.
Figure 9. Summary of the results. Countries’ ability to attract different category of FDI. Red cells correspond to highly successful, blue cells correspond to highly unsuccessful. Colored boxes indicate the five FDI-attraction profiles identified: Profit centers (green), Coordination centers (blue), Innovation centers (yellow), Back-office centers (magenta) and Manufacturing centers (gray).
The FDI attraction profile that is marked in grey, and which is associated with Hungary, Czechia, Bulgaria, Romania, Slovakia, and Poland, revolves primarily around TNCs’ offshoring of manufacturing activities. For this reason, we dubbed countries associated with this profile manufacturing centers. Apart from manufacturing activities, all countries in this group attract at least some degree of (primarily low value-adding) SSC activities. It is conceivable that this particular combination of manufacturing and low value-adding SSC FDI is the result of a sequential phenomenon in which TNCs first offshore their manufacturing operations to those countries and, after having had good experiences with the country’s investment climate, decide to also relocate some of their lower value-adding SSCs to the country. After all, in decisions regarding SSC (re)locations that are primarily motivated by cost reductions TNCs seem to consider location factors that are very similar to those that are considered in decisions regarding the (re)location of manufacturing activities. Such a pattern of ‘sequential FDI’ has indeed been identified in the International Business literature as a mechanism that might explain TNCs’ location decisions when offshoring activities (Kogut, Citation1983; Oman, Citation2000). Two of the countries associated with the manufacturing centers profile (the Czechia and Hungary) also attract a small amount of R&D activities. As we suggested earlier, this may be an artefact of TNCs’ preference to have some of their R&D activities located in the proximity of their previously offshored manufacturing operations. Hungary is a special case in this group of countries because it has also been able to attract substantial numbers of intermediate holding companies due to its aggressive tax incentives (see Section 5.5).
The second FDI attraction profile, which is associated with Portugal and Estonia, combines low value adding SSC activities with a limited amount of high value adding SSC activities. We refer to countries associated with this profile as back office centers. The reason these countries are successful in attracting SSCs may lie in their unique macro-institutional features. Both countries combine low labor costs with an efficient workforce and above average ICT infrastructure. Their success in attracting top holding companies, however, probably has more to do with the specificities of their corporate tax regimes. Estonia only taxes corporate income once it is distributed to shareholders, which is an attractive regime for small individually-owned companies, while Portugal harbors within its borders the Madeira international business center, where no withholding taxes are levied and which offers a statutory tax rate of only 5%.
The third FDI attraction profile, which we label innovation centers, is associated with Sweden, Denmark, Finland and Austria (marked in yellow). The main strength of these countries is their ability to attract TNCs’ R&D affiliates. We attribute these countries’ ability to do so primarily to their macro-institutional features. All countries offer large numbers of STEM graduates, good ICT infrastructure, and a stable political climate. Interestingly, none of these countries seems to rely on exceptionally generous patent boxes or other kinds of tax incentives to be successful in attracting TNCs’ R&D facilities. Apart from the FDI in R&D, most of these countries also attract a considerable number of intermediate and top holdings. The attraction of holdings is correlated with good access to financial markets, and the presence of a stable government providing efficient regulation.
The fourth FDI attraction profile that we identified is without doubt the most encompassing one. This profile (indicated in blue) combines all categories of FDI except for manufacturing activities. However, what is unique about the countries associated with this profile is their ability to attract high value-adding SSCs and intermediate holding companies. Because of the central role of these two functions in the coordination of global supply and wealth chains, we dubbed this the coordination centers profile. This unique combination of activities is partly explained by these countries’ macro-institutional endowments. All countries in this group provide for a highly skilled workforce, good infrastructure, and a stable political climate. However, tax incentives appear to play a significant role as well. Most of these countries provide for low withholding taxes and tax incentives specifically created to attract holding companies, such as patent boxes and special treatment of group interest income. We believe that the explanation for the emergence of this particular FDI attraction profile should be looked for in the proactive role of the offshore services sector in shaping tax and financial regulatory policies in these countries (Dörry, Citation2016). Although this hardly confirms our expectation, all countries associated with the coordination profile display an exceptionally high presence of the Big Four accounting firms (see ).
We labelled the fifth and final FDI attraction profile the profit centers profile. The two countries associated with this profile (Cyprus and Malta) primarily attract top holding companies, but also, to a somewhat lesser extent, intermediate holding companies. The extraordinary high profit rates of multinationals that we found for those two countries indicate that the top holdings they attract are mainly of the sort that ares used for profit shifting purposes, rather than those that engage in substantial global headquarter activities. We thus conclude that these countries owe their status as a preferred location for top holdings almost exclusively to the specificities of their tax regimes. Taking into account Malta’s special tax refund scheme, both countries have effective tax rates that are amongst the lowest in the EU. The centrality of such low effective tax rates makes it that the profit center profile can only be a feasible FDI attraction profile for countries with very small domestic economies. This is because in such countries, the additional tax revenues generated by taxing the activities of intermediate holding companies more than offset the reduction in tax revenues from domestic companies.
6. Conclusion
In this paper we have challenged the monolithic understanding of FDI that underpins most of the political economy literature dealing with international competition for FDI. To do so we first traced the great fragmentation of the firm to distinguish between five different categories of FDI: manufacturing affiliates, shared service centers, R&D facilities, intermediate holding companies (conduits) and top holding companies (sinks). Using a combination of micro and macro statistics, we then showed for each category of FDI which European countries are most successful in attracting it and identified some of the benefits they obtain from doing so. We also identified a range of macro-institutional and tax indicators present in countries that attract these different categories of FDI. Finally, we summarized our findings by profiling countries according to the different categories of FDI they attract. In this way, we were able to identify five distinct groups of countries, each of which attracts a distinct combination of categories of FDI. We called these distinct combinations ‘FDI attraction profiles’ and labelled the five FDI attraction profiles that we found to coexist in the European Union manufacturing centers, back-office centers, innovation centers, coordination centers, and profit centers.
Three important lessons can be learned from our results. The first of these pertains to the locational determinants of FDI. Our results show that each type of FDI is correlated with distinct macro-institutional and tax indicators. This implies that, from a TNC’s perspective, the perceived attractiveness of potential host countries and, ultimately, TNCs’ decisions where to invest, are different for different types of subsidiaries. Future studies on the locational determinants of FDI can build on the analytical framework we developed in this paper to carefully establish the causal effect of the different macro-institutional and tax determinants on each type of FDI.Footnote22
A second lesson that can be drawn from our results has to do with our understanding of the structure and dynamics of international competition for FDI. Our results show that different countries attract different categories of FDI and appear to rely on different types of macro-institutional and tax policies to do so. Competition for FDI thus appears to takes place amongst subsets of countries that compete for similar categories of FDI. It is in this sense that the title of this article makes reference to countries competing not for capital, but for capitals. This insight has important implications for policy initiatives at the EU level that aim to curb aggressive tax competition. Tax policy-making in the EU is a highly politicized affair. Direct taxation is one of the few policy fields in which individual member states have successfully defended their sovereignty. As a result, any attempt to question the legitimacy of a specific tax incentive or instrument tends to run against opposition from those member states that have incorporated that incentive or instrument in their tax legislation. Given the variegated nature of tax competition, we should not expect smaller member states to invariably be united in their attempts to block attempts orchestrated at the EU level to question the legitimacy of a specific tax incentives or instrument. Rather, we should expect member states to alternately side with and oppose ad hoc coalitions of countries, big or small, that initiate attacks on specific tax measures and instruments. Advocacy groups, international organizations, and even the European Commission would be wise to take the possible existence of such flexible coalitions into account when formulating policy proposals aimed at curbing the harmful aspects of international tax competition.
A third lesson that can be drawn from our results concerns the way in which we think about European countries’ growth regimes and specifically about the role of FDI therein. Previous research in comparative political economy has emphasized the FDI-dependence of some European countries’ growth regimes. The analysis presented in this paper, however, suggests that in the age of the great fragmentation, FDI-dependence seems to have become a feature that is shared by many European growth regimes. Moreover, our analysis shows that such FDI-dependence comes in different forms. Countries have developed distinct varieties of what we have called FDI attraction profiles. Given our finding that each FDI attraction profile comes with its own set of benefits, and thus favors distinct social groups, we can expect FDI attraction profiles to be politically supported by different kinds of interest coalitions. Future research could conduct in-depth case studies of national FDI attraction models to identify those interest coalitions, learn more about the specific historical and political conjuncture in which these models emerged, and identify the winners and losers of different FDI attraction profiles. Earlier studies have done this for a range of Central and Eastern European countries that we have associated with the manufacturing centers profile (Bohle & Greskovits, Citation2012; Drahokoupil, Citation2009; Nölke & Vliegenthart, Citation2009). We know little, however, about the historical and institutional origins and evolution of other types FDI attraction profiles. Given their central role in the coordination of global supply and wealth chains, especially countries associated with the coordination center profile merit closer scrutiny.
The analysis presented in this paper has a number of limitations that open up additional avenues for future research. We see two of them as especially fruitful. The first of these would be to extend the analysis presented in this paper to other parts of the world. In this regard, the Asia-Pacific region seems to be an especially suitable candidate. A process of regional economic integration in some ways resembling that in the European Union has been underway in that region since the mid-1980s under the auspices of the Association of Southeast Asian Nations (ASEAN) and the Asia-Pacific Economic Cooperation (APEC). For firms operating in that region, this has opened up the possibility to organize their corporate structures and processes on a regional, rather than national basis. Indeed, jurisdictions like Singapore and Hong Kong are known to be domiciles for large numbers of holding companies and regional headquarters, making it at least conceivable that they fulfill a role in that region that is not unlike the one played by the coordination centers we found in the EU. Whether the region also harbors the other FDI attraction profiles we identified in this article remains an open question.
Another limitation of our analysis that could be addressed in future research is that we have focused primarily on non-financial firms. Yet, financial firms (banking conglomerates, investment funds, insurance firms) have gone through a similar process of fragmentation. The emergence of multi-purpose financial service firms and the unbundling of front- and back-office operations in those firms have since the 1990s resulted in a geographical dispersion of the financial firm that is similar to the one experienced by non-financial firms. A typical investment fund nowadays is domiciled in Luxembourg or the Cayman Islands, the fund manager sits in London, while the back office paperwork is done in Dublin. International competition for each of these activities is as fierce for financial TNCs as it is for non-financial ones (Fernandez & Wigger, Citation2016).
Supplemental Material
Download PDF (1 MB)Supplemental Material
Download PDF (2.6 MB)Acknowledgements
We thank Saila Stausholm for providing the data on the number of employees at the Big Four accounting firms. We also thank Milan Babic and the other members of the CORPNET research group, as well as Benjamin Braun, Sandy Hager, Marina Hübner, Lukas Arndt, Bruno Casella and Richard Bolwijn for useful suggestions and comments.
Disclosure statement
No potential conflict of interest was reported by the author(s).
Additional information
Funding
Notes on contributors
Arjan Reurink
Arjan Reurink is a PhD candidate at the Max Planck Institute for the Study of Societies in Cologne. His research spans the fields of international and comparative political economy, economic sociology, and economic geography, with a focus on international finance and international taxation. In his PhD research project he studies the historical and institutional trajectory of the Netherlands as an important jurisdiction in the global offshore financial system.
Javier Garcia-Bernardo
Javier Garcia-Bernardo is a PhD candidate in Political Science at the CORPNET project. He did his M.Sc. in Computer Science at the University of Vermont (USA), specializing in Complex Systems. He is interested in understanding the influence of corporate networks in the real world. Javier’s work focuses on unveiling the structure and dynamical properties of such networks, and connecting those properties to tax planning and offshore finance.
Notes
1 The IPE literature on FDI per se is much broader. However, in this article we limit our focus on that part of the literature that deals specifically with international competition for FDI.
2 Given the scope of our paper, we limit our discussion here to studies that focus on European countries.
3 Previous literature has disaggregated FDI by the sector of the investment, distinguishing for instance between investments in the secondary and tertiary sectors, or between investments made by IT companies and pharmaceutical companies (e.g. Papke, Citation1991; Regan & Brazys, Citation2018; Stöwhase, Citation2005; Yu & Walsh, Citation2010). Such a sectoral disaggregation is helpful only to some extent. In today’s economy, the distinction between sectors have blurred. For instance, manufacturing firms increasingly engage in service activities (Lodefalk, Citation2013). Similarly, a key source of profits for all kinds of TNCs today is the management and exploitation of financial and intellectual property assets (Schwartz, Citation2017). Scholars have also disaggregated FDI in ‘real’ and ‘financial’ FDI (e.g. Clausing, Citation2016; Desai et al., Citation2004; Devereux et al., Citation2008; Jones & Temouri, Citation2016), measuring ‘real’ FDI using wages or fixed assets. In any case, with the partial exception of Defever (Citation2006), the literature does not try to disaggregate FDI by the business function realized through the investment.
4 Due to the uniqueness of the activities and organisational design of firms operating in the financial services industry, we limit our analysis to non-financial firms.
5 Our aim is not to give a full account of all the potential benefits, in terms of economic performance, a national economy may receive from different categories of FDI. Rather, our aim is to give an indication of some of the more immediate political benefits, in terms of employment creation and tax revenues, that are associated with attracting the different categories of FDI.
6 Data on Special Financial Institutions from De Nederlandsche Bank.
7 Cost-contribution agreements are contracts in which two entities agree to contribute financially toward the development or production of an asset or the execution of a service. In exchange for their financial contribution, parties to the contract receive a proportionate share of the economic benefits arising from the asset or service.
8 Throughout this article we use the terms ‘transnational corporation’ (TNC), ‘multinational’ and ‘corporate group’ interchangeably.
9 The function may even be so specific that it pertains only to a particular transaction and a limited period of time. If such subsidiaries are not dissolved after their specific purpose has dissipated, this may, over time, result in their becoming obsolete; an artefact of the past.
10 See also: https://www2.deloitte.com/content/dam/Deloitte/dk/Documents/finance/SSC-Handbook-%20Hit-the-Road.pdf
11 See also https://www.pwc.de/de/finanzdienstleistungen/assets/pwc_studie_financial_shared_service_centers.pdf
12 For example, Starbucks’ centralized procurement SSC, located in the Netherlands, played an important role in the tax planning strategy the company had adopted in order to minimize the tax burden on its European operations (Kleinbard, Citation2013).
14 These are Belgium, Cyprus, France, Hungary, Ireland, Italy, Liechtenstein, Luxembourg, Malta, the Netherlands, Portugal, Spain, the canton of Nidwalden in Switzerland, and the UK (Chen et al., Citation2019).
15 Not all tax systems determine an entity’s tax residency by its place of incorporation. Some jurisdictions determine tax residency by the place of management, or a combination of both place of incorporation and place of management.
16 The host country may also benefit from indirect forms of employment creation. The legal and financial reporting obligations that come with the maintenance of top holding companies provide work for the offshore services sector (i.e. trust firms, tax advice, legal advice, etc.) in the host country.
17 Our sample corresponds to all countries covered by the Interest and Royalty Directive (Council Directive 2003/49/EC) and the Parent-Subsidiary Directive (Council Directive 2003/123/EC)—i.e. all countries from the European Union and Switzerland. These directives abolish withholding taxes on intra-group interest-, royalty- and dividend transactions within the European Union and Switzerland, and thereby enable TNCs to adopt a pan-European approach to the legal-financial organisation of their European operations.
18 Three countries (Lithuania, Latvia and Croatia) receive relatively large greenfield FDI flows (0.9% ± 0.4%). However, given their small size and the fact that only a small fraction of their labor force is employed in foreign owned companies in the manufacturing sector, we do not consider them as countries that attract disproportionate numbers of manufacturing affiliates.
19 Arguably, with a strong presence of the Big Four, a high number of GUOs and high profit rates, Denmark would also be a candidate for this group. However, we decided to exclude it for two reasons. First, the comparatively low value of equity assets held by companies in that country suggests that Denmark primarily harbors top holdings of rather small and inconsequential TNCs. Second, the low profit rates when compared with domestic companies suggest that the relatively high number of GUOs in Denmark has little to do with TNCs’ tax planning strategies.
20 Assuming an employee cost of $100,000 US dollars across countries.
21 Estonia is worthy of special mention. It appears to have all the right conditions to be identified as a top holding jurisdiction—a small economy, lenient and efficient tax legislation, minimal taxation. It also harbors a large number of GUOs. However, the low scores of the country on all the other activity indicators suggest that the country may be attracting large amounts of top holdings of small and inconsequential TNCs (possibly related to personal finance and wealth management) but does not play a significant role as a preferred jurisdiction for top holdings of bigger TNCs.
22 To do so, future studies could, for instance, use longitudinal regression models. Such studies will, however, face several challenges, such as incomplete data for some years, multicollinearity, endogeneity, and omitted variable bias (see e.g. Bénassy-Quéré et al., Citation2007; Blonigen, Citation2005; Nielsen et al., Citation2017). Such studies should also take into account the hierarchical location decision process of TNCs (Nielsen et al., Citation2017). This process is likely a multi-step one, where the firm first chooses series of potential candidates on the basis of the macro-institutional features, and only then the tax and policy features become relevant (Oman, Citation2000).
Related Research Data
References
- Auerbach, A. J., Hassett, K., & Slemrod, J. (1993). Taxation and foreign direct investment in the United States: A reconsideration of the evidence. In Studies in international taxation (pp. 119–148). University of Chicago Press.
- Avi-Yonah, R. S., (2000). Globalization, tax competition, and the fiscal crisis of the welfare state. Harvard Law Review, 113(7), 1573. doi:https://doi.org/10.2307/1342445
- Baaij, M. G., Mom, T. J. M., Van den Bosch, F. A. J., & Volberda, H. W., (2015). Why do multinational corporations relocate core parts of their corporate headquarters abroad? Long Range Planning, 48(1), 46–58. doi:https://doi.org/10.1016/j.lrp.2012.07.001
- Bailey, N., & Warby, B., (2019). Explaining the competition for FDI: Evidence from Costa Rica and cross-national industry-level FDI data. Research in International Business and Finance, 47, 67–77. doi:https://doi.org/10.1016/j.ribaf.2018.07.002
- Basinger, S. J., & Hallerberg, M., (2004). Remodeling the competition for capital: How domestic politics erases the race to the bottom. American Political Science Review, 98(2), 261–276. doi:https://doi.org/10.1017/S0003055404001133
- Bellak, C., Leibrecht, M., & Riedl, A., (2008). Labour costs and FDI flows into Central and Eastern European countries: A survey of the literature and empirical evidence. Structural Change and Economic Dynamics, 19(1), 17–37. doi:https://doi.org/10.1016/j.strueco.2007.03.001
- Bénassy-Quéré, A., Coupet, M., & Mayer, T., (2007). Institutional determinants of foreign direct investment. The World Economy, 30(5), 764–782. doi:https://doi.org/10.1111/j.1467-9701.2007.01022.x
- Berg, M. v. d., Van Buiren, K., Van Giffen, T. & Risseeuw, P. (2008). The Dutch trust industry: Facts & figures. SEO Economic Research. http://dare.uva.nl/record/1/296486
- Berger, S. (2005). How we compete: What companies around the world are doing to make it in today’s global economy. Crown Publishing Group.
- Beugelsdijk, S., Smeets, R., & Zwinkels, R., (2008). The impact of horizontal and vertical FDI on host’s country economic growth. International Business Review, 17(4), 452–472. doi:https://doi.org/10.1016/j.ibusrev.2008.02.004
- Birkinshaw, J., Braunerhjelm, P., Holm, U., & Terjesen, S., (2006). Why do some multinational corporations relocate their headquarters overseas? Strategic Management Journal, 27(7), 681–700. doi:https://doi.org/10.1002/smj.541
- Blinder, A. S., (2006). Offshoring: The next industrial revolution? Foreign Affairs, 85(2), 113–128. doi:https://doi.org/10.2307/20031915
- Blonigen, B. A., (2005). A review of the empirical literature on FDI determinants. Atlantic Economic Journal, 33(4), 383–403. doi:https://doi.org/10.1007/s11293-005-2868-9
- Blonigen, B. A., & Piger, J., (2014). Determinants of foreign direct investment. Canadian Journal of Economics/Revue Canadienne D'économique, 47(3), 775–812. doi:https://doi.org/10.1111/caje.12091
- Bohle, D., & Greskovits, B. (2012). Capitalist diversity on Europe’s periphery. Cornell University Press.
- Bondarouk, T. (2014). Shared services as a new organizational form. Emerald Group Publishing.
- Braunerhjelm, P., & Ekholm, K. (1998). The geography of multinational firms. Springer Science & Business Media.
- Brazys, S., & Regan, A., (2017). The politics of capitalist diversity in Europe: Explaining Ireland’s divergent recovery from the euro crisis. Perspectives on Politics, 15(2), 411–427. doi:https://doi.org/10.1017/S1537592717000093
- Breathnach, P., (2000). Globalisation, information technology and the emergence of Niche transnational cities: The growth of the call centre sector in Dublin. Geoforum, 31(4), 477–485. doi:https://doi.org/10.1016/S0016-7185(00)00016-6
- Brueckner, J. K., (2003). Strategic interaction among governments: An overview of empirical studies. International Regional Science Review, 26(2), 175–188. doi:https://doi.org/10.1177/0160017602250974
- Bryan, D., Rafferty, M., & Wigan, D., (2017). Capital unchained: Finance, intangible assets and the double life of capital in the offshore world. Review of International Political Economy, 24(1), 56–86. doi:https://doi.org/10.1080/09692290.2016.1262446
- Bucovetsky, S., (1991). Asymmetric tax competition. Journal of Urban Economics, 30(2), 167–181. doi:https://doi.org/10.1016/0094-1190(91)90034-5
- Cantwell, J., & Mudambi, R., (2000). The location of MNE R&D activity: The role of investment incentives. Management International Review, 40(1), 127–148.
- Cantwell, J., & Piscitello, L., (2002). The location of technological activities of MNCs in European regions: The role of spillovers and local competencies. Journal of International Management, 8(1), 69–96.
- Carlsson, B., (2006). Internationalization of innovation systems: A survey of the literature. Research Policy, 35(1), 56–67. doi:https://doi.org/10.1016/j.respol.2005.08.003
- Cerny, P. G. (1990). The changing architecture of politics: Structure, agency and the future of the state. SAGE.
- Chen, S., De Simone, L., Hanlon, M., & Lester, R. (2019). The effect of innovation box regimes on income shifting and real activity. doi:https://doi.org/10.2139/ssrn.3486428
- Clausing, K. A., (2016). The effect of profit shifting on the corporate tax base in the United States and beyond. https://doi.org/10.2139/ssrn.2685442
- Coe, N. M., Dicken, P., & Hess, M., (2008). Global production networks: Realizing the potential. Journal of Economic Geography, 8(3), 271–295. doi:https://doi.org/10.1093/jeg/lbn002
- Council Directive 2003/49/EC on a common system of taxation applicable to interest and royalty payments made between associated companies of different Member States. Official Journal of the European Union, L157, 49–54.
- Council Directive 2003/123/EC amending Directive 90/435/EEC on the common system of taxation applicable in the case of parent companies and subsidiaries of different Member States. Official Journal of the European Union, L007, 41–44.
- Dachs, B., Stehrer, R., & Zahradnik, G. (2014). The Internationalisation of Business R&D. Edward Elgar Publishing.
- Davies, R. B., & Vadlamannati, K. C., (2013). A race to the bottom in labor standards? An empirical investigation. Journal of Development Economics, 103(July), 1–14. doi:https://doi.org/10.1016/j.jdeveco.2013.01.003
- Davis, J. C., & Henderson, J. V., (2008). The agglomeration of headquarters. Regional Science and Urban Economics, 38(5), 445–460. doi:https://doi.org/10.1016/j.regsciurbeco.2008.05.002
- Defever, F., (2006). Functional fragmentation and the location of multinational firms in the enlarged Europe. Regional Science and Urban Economics, 36(5), 658–677. https://www.sciencedirect.com/science/article/pii/S0166046206000524. doi:https://doi.org/10.1016/j.regsciurbeco.2006.06.007
- Desai, M. A., (2009). The decentering of the global firm. World Economy, 32(9), 1271–1290. doi:https://doi.org/10.1111/j.1467-9701.2009.01212.x
- Desai, M. A., Foley, C. F., & Hines, J. R., (2004). Foreign direct investment in a world of multiple taxes. Journal of Public Economics, 88(12), 2727–2744. doi:https://doi.org/10.1016/j.jpubeco.2003.08.004
- Devereux, M. P., & Griffith, R., (1998). Taxes and the location of production: Evidence from a panel of US multinationals. Journal of Public Economics, 68(3), 335–367. doi:https://doi.org/10.1016/S0047-2727(98)00014-0
- Devereux, M. P., Griffith, R., & Klemm, A., (2002). Corporate income tax reforms and international tax competition. Economic Policy, 17(35), 449–495. doi:https://doi.org/10.1111/1468-0327.00094
- Devereux, M. P., Lockwood, B., & Redoano, M., (2008). Do countries compete over corporate tax rates? Journal of Public Economics, 92(5-6), 1210–1235. doi:https://doi.org/10.1016/j.jpubeco.2007.09.005
- Dischinger, M., Knoll, B., & Riedel, N., (2014). The role of headquarters in multinational profit shifting strategies. International Tax and Public Finance, 21(2), 248–271. doi:https://doi.org/10.1007/s10797-012-9265-5
- Doh, J. P., Bunyaratavej, K., & Hahn, E. D., (2009). Separable but not equal: The location determinants of discrete services offshoring activities. Journal of International Business Studies, 40(6), 926–943. doi:https://doi.org/10.1057/jibs.2008.89
- Dong, B., Gong, J., & Zhao, X., (2012). FDI and environmental regulation: Pollution haven or a race to the top? Journal of Regulatory Economics, 41(2), 216–237. doi:https://doi.org/10.1007/s11149-011-9162-3
- Dörry, S., (2016). The role of elites in the co-evolution of international financial markets and financial centres: The case of Luxembourg. Competition & Change, 20(1), 21–36. doi:https://doi.org/10.1177/1024529415623715
- Drahokoupil, J., (2009). After transition: Varieties of political-economic development in Eastern Europe and the Former Soviet Union. Comparative European Politics, 7(2), 279–298. doi:https://doi.org/10.1057/cep.2008.30
- Eicke, R. (2009). Tax planning with holding companies - Repatriation of US profits from Europe: Concepts, strategies, structures. Kluwer Law International.
- Elkins, Z., Guzman, A. T., & Simmons, B. A., (2006). Competing for capital: The diffusion of bilateral investment treaties, 1960–2000. International Organization, 60(04), 811–846. doi:https://doi.org/10.1017/S0020818306060279
- Elliott, R. J. R., & Zhou, Y., (2013). Environmental regulation induced foreign direct investment. Environmental and Resource Economics, 55(1), 141–158. doi:https://doi.org/10.1007/s10640-012-9620-0
- Ellram, L. M., Tate, W. L., & Petersen, K. J., (2013). Offshoring and reshoring: An update on the manufacturing location decision. Journal of Supply Chain, 49(2), 14–22. doi:https://doi.org/10.1111/jscm.12019.
- Evers, L., Miller, H., & Spengel, C., (2015). Intellectual property box regimes: Effective tax rates and tax policy considerations. International Tax and Public Finance, 22(3), 502–530. doi:https://doi.org/10.1007/s10797-014-9328-x
- Fan, C. C., & Scott, A. J., (2009). Industrial agglomeration and development: A survey of spatial economic issues in East Asia and a statistical analysis of Chinese regions. Economic Geography, 79(3), 295–319. doi:https://doi.org/10.1111/j.1944-8287.2003.tb00213.x
- Farole, T., & Akinci, G. (2011). Special Economic Zones in Africa: Comparing Performance and Learning from Global Experience. Directions in development - General. The World Bank.
- Fernandez, R., & Wigger, A. (2016). Lehman Brothers in the Dutch offshore financial centre: The role of shadow banking in increasing leverage and facilitating debt. Economy and Society, 45(3–4), 407–430. doi:https://doi.org/10.1080/03085147.2016.1264167
- Fink, P. (2006). FDI-led growth and rising polarisations in Hungary: Quantity at the expense of quality. New Political Economy, 11(1), 47–72. doi:https://doi.org/10.1080/13563460500494867
- Florida, R., (1997). The globalization of R&D: Results of a survey of foreign-affiliated R&D laboratories in the USA. Research Policy, 26 (1), 85–103. doi:https://doi.org/10.1016/S0048-7333(97)00004-8
- Fors, G., & Zejan, M. (2012). Overseas R&D by multinationals in foreign centers of excellence. IUI Working Paper. https://www.econstor.eu/handle/10419/94800
- Ganghof, S. (2006). The politics of income taxation: A comparative analysis. ECPR Press.
- Garcia-Bernardo, J., Fichtner, J., Takes, F. W., & Heemskerk, E. M., (2017). Uncovering offshore financial centers: Conduits and sinks in the global corporate ownership network. Scientific Reports, 7(1), 6246. doi:https://doi.org/10.1038/s41598-017-06322-9
- Garcia-Bernardo, J., & Takes, F. W., (2017). The effects of data quality on the analysis of corporate board interlock networks. Information Systems, 78, 164–172. doi:https://doi.org/10.1016/j.is.2017.10.005
- Genschel, P. (2001). Globalization, tax competition, and the fiscal viability of the welfare state. https://www.ssoar.info/ssoar/handle/document/36356
- Genschel, P., & Schwarz, P., (2011). Tax competition: A literature review. Socio-Economic Review, 9(2), 339–370. doi:https://doi.org/10.1093/ser/mwr004
- Genschel, P., & Seelkopf, L., (2016). Winners and losers of tax competition. In P. Dietsch & T. Rixen (Eds.), Global tax governance: What is wrong with it and how to fix it (pp. 55–75). ECPR Press.
- Gereffi, G., Humphrey, J., & Sturgeon, T. (2005). The governance of global value chains. Review of International Political, 12(1), 78–104. doi:https://doi.org/10.1080/09692290500049805
- Globerman, S., & Shapiro, D., (2002). Global foreign direct investment flows: The role of governance infrastructure. World Development, 30(11), 1899–1919. doi:https://doi.org/10.1016/S0305-750X(02)00110-9
- Guimón, J., (2009). Government strategies to attract R&D-intensive FDI. The Journal of Technology Transfer, 34(4), 364–379. doi:https://doi.org/10.1007/s10961-008-9091-1
- Haftel, Y. Z., (2010). Ratification counts: US investment treaties and FDI flows into developing countries. Review of International Political Economy, 17(2), 348–377. doi:https://doi.org/10.1080/09692290903333103
- Harrison, A., & Rodríguez-Clare, A. (2010). Trade, foreign investment, and industrial policy for developing countries. In D. Rodrik & M. Rosenzweig (Eds.), Handbook of development economics (Vol. 5, pp. 4039–4214). Elsevier.
- Hejazi, W., & Safarian, A. E., (1999). Trade, foreign direct investment, and R&D spillovers. Journal of International Business Studies, 30(3), 491–511. doi:https://doi.org/10.1057/palgrave.jibs.8490080
- Hines, J. R., (1994). No place like home: Tax incentives and the location of R&D by American multinationals. Tax Policy and the Economy, 8, 65–104. doi:https://doi.org/10.1086/tpe.8.20061819
- Jensen, N. M., (2003). Democratic governance and multinational corporations: Political regimes and inflows of foreign direct investment. International Organization, 57(3), 587–616. doi:https://doi.org/10.1017/S0020818303573040
- Jensen, N. M. (2008). Nation-states and the multinational corporation: A political economy of foreign direct investment. Princeton University Press.
- Johannesen, N., Tørsløv, T., & Wier, L. (2016). Are less developed countries more exposed to multinational tax avoidance? Method and evidence from micro-data. (WIDER Working Paper 2016/10). UNU-Wider. doi:https://doi.org/10.35188/UNU-WIDER/2016/053-9
- Jones, C., & Temouri, Y., (2016). The determinants of tax haven FDI. Journal of World Business, 51(2), 237–250. doi:https://doi.org/10.1016/j.jwb.2015.09.001
- Karkinsky, T., & Riedel, N., (2012). Corporate taxation and the choice of patent location within multinational firms. Journal of International Economics, 88(1), 176–185. doi:https://doi.org/10.1016/j.jinteco.2012.04.002
- Keen, M., & Konrad, K. A., (2013). The theory of international tax competition and coordination. In A. J. Auerbach, R. Chetty, M. Feldstein & E. Saez (Eds.), Handbook of public economics (pp. 257–328). Elsevier.
- Kerste, M., Baarsma, B., Weda, J., Rosenboom, N., Rougoor, W., & Risseeuw, P. (2013). Uit de Schaduw van Het Bankwezen: Feiten En Cijfers over Bijzondere Financiële Instellingen En Het Schaduwbankwezen (SEO rapport 2018-86). SEO Economisch Onderzoek.
- Kim, S., & Park, J., (2017). Foreign direct investment and international R&D spillovers in OECD countries revisited. Journal of Institutional and Theoretical Economics, 173(3), 431–453. doi:https://doi.org/10.1628/093245616X14664894246884
- Kleinbard, E. D. (2013). Through a latte, darkly: Starbucks's stateless income planning (USC CLEO Research Paper No. C13-9; USC Law Legal Studies Paper No. 13–10). Tax Notes, pp. 1515–1535. https://ssrn.com/abstract=2264384
- Kogut, B. (1983). Foreign direct investment as a sequential process. In C. P. Kindleberger & D. Audretsch (Eds.), The multinational corporation in the 1980s (pp. 38–56). MIT Press.
- Lewin, A. Y., & Peeters, C., (2006). Offshoring work: Business hype or the onset of fundamental transformation? Long Range Planning, 39(3), 221–239. doi:https://doi.org/10.1016/j.lrp.2006.07.009
- Lewin, A. Y., & Volberda, H. W., (2011). Co-evolution of global sourcing: The need to understand the underlying mechanisms of firm-decisions to offshore. International Business Review, 20(3), 241–251. doi:https://doi.org/10.1016/j.ibusrev.2011.02.008
- Li, Q., (2006). Democracy, autocracy, and tax incentives to foreign direct investors: A cross-national analysis. The Journal of Politics, 68(1), 62–74. doi:https://doi.org/10.1111/j.1468-2508.2006.00370.x
- Lodefalk, M., (2013). Servicification of manufacturing–evidence from Sweden. International Journal of Economics and Business Research, 6(1), 87–113. doi:https://doi.org/10.1504/IJEBR.2013.054855
- Maine, J. A., & Nguyen, X.-T. (2017). The intellectual property holding company: Tax use and abuse from Victoria’s secret to apple. Cambridge University Press.
- Malecki, E. J., (1987). The R&D location decision of the firm and ‘creative’ regions—A survey. Technovation, 6(3), 205–222. doi:https://doi.org/10.1016/0166-4972(87)90023-X
- McIvor, R. (2010). Global services outsourcing. Cambridge University Press.
- Mooij, R. A., de, S., & Ederveen, (2003). Taxation and foreign direct investment: A synthesis of empirical research. International Tax and Public Finance, 10(6), 673–693. doi:https://doi.org/10.1023/A:1026329920854
- Myant, M., & Drahokoupil, J. (2011). Transition economies. Political Economy in Russia, Eastern Europe, and Central Asia. USA. https://www.researchgate.net/profile/Jan_Drahokoupil/publication/260434539_Transition_Economies_Political_Economy_in_Russia_Eastern_Europe_and_Central_Asia/links/00463531d7e5818f28000000/Transition-Economies-Political-Economy-in-Russia-Eastern-Europe-and-Central-Asia.pdf
- Nielsen, B. B., Asmussen, C. G., & Weatherall, C. D., (2017). The location choice of foreign direct investments: Empirical evidence and methodological challenges. Journal of World Business, 52(1), 62–82. doi:https://doi.org/10.1016/j.jwb.2016.10.006
- Nölke, A., & Vliegenthart, A., (2009). Enlarging the varieties of capitalism: The emergence of dependent market economies in East Central Europe. World Politics, 61(4), 670–702. doi:https://doi.org/10.1017/S0043887109990098
- Olney, W. W., (2013). A race to the bottom? Employment protection and foreign direct investment. Journal of International Economics, 91(2), 191–203. doi:https://doi.org/10.1016/j.jinteco.2013.08.003
- Oman, C. P. (2000). Policy competition for foreign direct investment. OECD Publishing.
- Papke, L. E., (1991). Interstate business tax differentials and new firm location: Evidence from panel data. Journal of Public Economics, 45(1), 47–68. doi:https://doi.org/10.1016/0047-2727(91)90047-6
- Patel, P., & Pavitt, K., (1991). Large firms in the production of the world’s technology: An important case of ‘non-globalisation’. Journal of International Business Studies, 22(1), 1–21. doi:https://doi.org/10.1057/palgrave.jibs.8490289
- Porter, M. E. (1990). The competitive advantage of nations: With a new introduction. Free Pr.
- Regan, A., & Brazys, S., (2018). Celtic phoenix or leprechaun economics? The politics of an FDI-led growth model in Europe. New Political Economy, 23(2), 223–238. doi:https://doi.org/10.1080/13563467.2017.1370447
- Rixen, T., (2011). Tax competition and inequality: The case for global tax governance. Global Governance: A Review of Multilateralism and International Organizations, 17(4), 447–467. doi:https://doi.org/10.1163/19426720-01704004
- Saggi, K., (2002). Trade, foreign direct investment, and international technology transfer: A survey. The World Bank Research Observer, 17(2), 191–235. doi:https://doi.org/10.1093/wbro/17.2.191
- Schwartz, H. M., (2017). Club goods, intellectual property rights, and profitability in the information economy. Business and Politics, 19(2), 191–214. doi:https://doi.org/10.1017/bap.2016.11
- Seabrooke, L., & Wigan, D., (2017). The governance of global wealth chains. Review of International Political Economy, 24(1), 1–29. doi:https://doi.org/10.1080/09692290.2016.1268189
- Slangen, A. H. L., Baaij, M., & Valboni, R., (2017). Disaggregating the corporate headquarters: Investor reactions to inversion announcements by US firms. Journal of Management Studies, 54(8), 1241–1270. doi:https://doi.org/10.1111/joms.12286
- Stopford, J. M., Strange, S., & Henley, J. S. (1991). Rival states, rival firms: Competition for world market shares. Cambridge University Press.
- Stöwhase, S., (2005). Tax-rate differentials and sector-specific foreign direct investment: Empirical evidence from the EU. FinanzArchiv, 61(4), 535–558. doi:https://doi.org/10.1628/001522105776072807
- Swank, D., (1998). Funding the welfare state: Globalization and the taxation of business in advanced market economies. Political Studies, 46(4), 671–692. doi:https://doi.org/10.1111/1467-9248.00161
- Swank, D., (2016). Taxing choices: International competition, domestic institutions and the transformation of corporate tax policy. Journal of European Public Policy, 23(4), 571–603.
- Thomas, K. P. (2011). Investment incentives and the global competition for capital. https://doi.org/10.1057/9780230302396
- Vitali, S., Glattfelder, J. B., & Battiston, S., (2011). The network of global corporate control. PloS One, 6(10), e25995. doi:https://doi.org/10.1371/journal.pone.0025995
- Voget, J., (2011). Relocation of headquarters and international taxation. Journal of Public Economics, 95(9-10), 1067–1081. doi:https://doi.org/10.1016/j.jpubeco.2010.11.019
- Weichenrieder, A. J., & Mintz, O. (2008). What determines the use of holding companies and ownership chains. Centre for Business Taxation Working Paper WP08/03. Oxford University.
- Weyzig, F., (2013). Tax treaty shopping: structural determinants of foreign direct investment routed through the Netherlands. International Tax and Public Finance, 20(6), 910–937. doi:https://doi.org/10.1007/s10797-012-9250-z
- Wilson, J. D. (1999). Theories of tax competition. National Tax Journal, 52(2), 269–304.
- Wilson, M. I. (1995). The office farther back: Business services, productivity, and the offshore back office. In P. T. Harker (Ed.), The service productivity and quality challenge (pp. 203–224). Springer.
- Wójcik, D., (2013). Where governance fails: Advanced business services and the offshore world. Progress in Human Geography, 37(3), 330–347. doi:https://doi.org/10.1177/0309132512460904
- Yu, J., & Walsh, J. P. (2010). Determinants of foreign direct investment: A sectoral and institutional approach. International Monetary Fund. doi:https://doi.org/10.5089/9781455202218.001