
 ?Mathematical formulae have been encoded as MathML and are displayed in this HTML version using MathJax in order to improve their display. Uncheck the box to turn MathJax off. This feature requires Javascript. Click on a formula to zoom.
Abstract
The paper contributes to the recent growth models debate through a cross-country analysis of growth drivers before and after the 2008 Global Financial Crisis (GFC). It argues that the widely used dichotomy of export-led versus (debt-financed) consumption-led growth has lost its usefulness since the GFC. Specifically, identifying growth models through growth contributions can give misleading results when the drivers of economic growth change. The paper contends that Comparative Political Economy (CPE) has neglected the unstable nature of financial growth drivers, effectively ignores fiscal policy, and overemphasizes price competitiveness as a growth driver. It shows empirically that, first, debt-financed growth is cyclical and financial booms come with busts and debt overhang; second, post-GFC growth dynamics are strongly shaped by the fiscal policy reaction; third, price competitiveness through wage deflation has played a negligible role in driving growth. We conclude that CPE needs to broaden its analysis of growth drivers in order to understand how the GFC transformed growth models.
Introduction
Since the 2008 Global Financial Crisis (GFC), there has been a shift within Comparative Political Economy (CPE) from a focus on static institutional equilibria (in particular in the Varieties of Capitalism (VoC) approach) toward demand-oriented analyses of growth models (Baccaro & Pontusson, Citation2016; Hall, Citation2018; Hope & Soskice, Citation2016; Johnston & Regan, Citation2018; Schwartz & Tranøy, Citation2019). Similarly, in International Political Economy (IPE), Blyth and Matthijs (Citation2017) proposed the concept of Macroeconomic Regimes that links growth models to different economic policy regimes. The period before the GFC has been characterized in CPE as one of two divergent growth models (GMs): a competitive export-led regime and a domestic demand-led regime, whose co-existence generated severe macroeconomic imbalances (Iversen et al., Citation2016, Johnston & Regan, Citation2016, Hall, Citation2018). Several authors pointed to the role of asset price inflation and private debt for consumption in the Anglo-liberal domestic demand-led regime (Crouch, Citation2009, Hay, Citation2009, Hay & Smith, Citation2013), and post-Keynesian macroeconomists highlighted the instability of the export-led and debt-led GMs in the form of rising export-dependence and financial fragility (Hein, Citation2012, Citation2019, Stockhammer, Citation2016).
We embrace the focus on aggregate demand put forth by the GM approach but argue that the extant CPE literature has been unduly concerned with the classification of countries into export-led versus (debt-financed) consumption-led regimes. Part of the attractiveness of these concepts lies in their intuitive appeal: a genuinely export-led GM is one where the dynamism of exports translates into high economic growth underpinned by a political coalition. Conversely, in the consumption-led GM private consumption, typically financed by household debt, is considered the main driver of growth.Footnote1 Methodologically, many authors use the growth contributions of net exports, private consumption, and sometimes investment and public consumption to identify GMs (Baccaro & Pontusson, Citation2016, Hall, Citation2018, Hein, Citation2019, Hein et al., Citation2020). These are then often combined with additional information, e.g. sectoral financial balances (Hein, Citation2019, Hein et al., Citation2020). In Baccaro and Pontusson (Citation2016) this leads to a distinction between export-led and consumption-led GMs, which Behringer and van Treeck (Citation2019) and Hassel et al. (Citation2020) expand on. Hein et al. (Citation2020) qualify these two regimes further by differentiating between ‘export-led mercantilist’ and ‘weakly export-led’ GMs on the one hand, and ‘domestic demand-led’ and ‘debt-led private demand boom’ models on the other, where the latter is characterised by debt-financed consumption.
However, there is a danger that the typology of export-led and (debt-financed) consumption-led growth that was useful to describe the pre-2008 boom, hampers CPE’s understanding of the growth experience after the GFC. We contend that the GFC exacerbated inherent contradictions of the pre-crisis GMs that render the export-led/consumption-led dichotomy inappropriate for the post-GFC period. Consider the case of Spain and other previously debt-led GMs, where the GFC induced households to deleverage, while the government pursued austerity. The result is a sharp recession and then stagnation, which results in improved current account positions. Based on growth contributions, Spain could thus be classified as an export-led GM in the post-crisis period (e.g. Hein et al., Citation2020 classify it as ‘weakly export-led’). We question whether many countries adopted a genuinely export-led model after the GFC. Instead, we will argue that many formerly debt-financed consumption-led models underwent a debt- and austerity-driven depression, whereas most previously export-led models failed to generate sustained growth through exports.
As an alternative to growth contributions, our paper advances the notion of growth drivers, which are factors that are hypothesized to cause changes in the components of aggregate income. Viable GMs rely on a relatively stable set of growth drivers (as well as on political support); thus any analysis of GMs has implicit assumptions about the relevant growth drivers. Analyses of the pre-GFC period mostly considered price competitiveness and real wage growth as sources of export and consumption demand, respectively (Hall, Citation2014, Baccaro & Pontusson, Citation2016, Johnston & Regan, Citation2016). We contend that the current debate takes too narrow a view of what drives aggregate demand and fails to acknowledge how growth drivers change in response to global crises. Specifically, CPE and the GM approach neglect the unstable nature of financial growth drivers, effectively ignore fiscal policy, and overemphasize price competitiveness as a growth driver.
The contribution of this paper is both theoretical and empirical. On the theoretical side, we provide an analysis of several growth drivers that have hitherto received less or incomplete attention in the GM literature. Drawing mostly on debates in post-Keynesian economics (PKE), we broaden the theoretical foundations of GMs. Firstly, prior to the GFC private demand was boosted by asset price inflation in several countries (Crouch, Citation2009, Hay, Citation2009, Hay & Smith, Citation2013). More generally, the financialisation debate regards the increasing role of finance as a secular process in which many countries became more dependent on private debt. However, the US subprime crisis triggered a global bust of asset prices and household deleveraging. To understand this phenomenon, we integrate the Minskyan notion of financial cycles (Palley, Citation2011, Guttmann, Citation2016) into the GM analysis. In this view, debt-led regimes will not only have periods of debt-financed growth, but also phases of debt-driven depression, where debt overhang and house price busts depress private spending. Secondly, public demand management through fiscal policy has largely been absent from the GM debate; arguably because there had been relatively little variation across countries prior to the GFC. However, countries differed strongly in their fiscal response to the GFC, so that fiscal policy potentially became a strong growth driver; especially since fiscal multipliers rise during recessions (Delong & Summers, Citation2012, Gechert & Rannenberg, Citation2018). While large parts of the political elite have advocated austerity even in a recession (backed by the notion of expansionary austerity, see Alesina & Perotti, Citation1997), Keynesians and political economists argue that austerity worsens recessions and has negative long-run effects (Blyth, Citation2013; Fontana & Sawyer, Citation2011; Truger, Citation2013). For the analysis of GMs, this means that fiscal policy has to be considered in its impact on growth. Thirdly, CPE emphasizes the role of price competitiveness and wage inflation for export demand (Hall, Citation2014, Johnston et al., Citation2014, Baccaro & Pontusson, Citation2016). After the GFC, many countries aimed to boost their export performance through wage deflation. However, from a structuralist post-Keynesian perspective, non-price competitiveness may be a more important source of export demand (Simonazzi et al., Citation2013, Storm & Naastepad, Citation2016, Gräbner et al., Citation2020). We examine how successful wage deflation has been compared to efforts to improve competitiveness through quality upgrading.
The empirical contribution of this paper shifts the attention away from a classification of GMs toward the drivers of growth. We conduct a cross-country analysis of macroeconomic growth drivers for 30 OECD countries before and in the decade after the GFC. We consider property prices, structural fiscal balances, real effective exchange rates, and export sophistication. Our empirical strategy is simple and comparative. We compare bivariate cross-country correlations of these potential growth drivers with national growth rates in the pre- and post-crisis period, which allows us to identify changes in growth drivers across countries. We also conduct a multivariate cross-country regression of growth drivers to assess their relative empirical support. To be clear, these correlations do not establish causality, but they provide useful insights into the relevance and temporal change of different factors highlighted in the theoretical literature; and a substantive correlation is a necessary, if not sufficient, condition for causality. Overall, our empirical results suggest that: (i) house prices are a strong but cyclical driver of growth and thus periodically turn debt-led growth into debt-driven stagnation; (ii) discretionary fiscal spending has become an important growth driver after the GFC; and (iii) price competitiveness has failed to stimulate growth through foreign demand.
Our argument has important implications also for IPE. It ties into Blyth's and Matthijs' (Citation2017) use of Keynesian macroeconomics to examine different Macroeconomic Regimes throughout history. However, unlike dysfunctional policy targets like price stability, we link the crisis of the neoliberal regime to the inherent contradictions of the export-led and consumption-led GMs. The export-led model relies on export demand from the consumption-led model, which broke away after the GFC. Left with excessive trade surpluses that no longer translate into high growth rates, the model faces international political tensions in the form of trade wars. We agree with Matthijs (Citation2020) that the USA have partly acted as a hegemon by supporting global demand, and we highlight fiscal stimulus in this regard, but we also document an improvement in its current account balance through suppressed import demand. Political contradictions also stem from the debt-financed consumption-led model where house price deflation can feed populism, and where countries with political constraints on fiscal expansion will further be confronted with social discontent from austerity. Overall, we see the breakdown of the neoliberal regime as discussed in Blyth and Matthijs (Citation2017) as marked by the inherent contradictions of the export-led/consumption-led GMs out of which new GMs have not yet emerged.
The remainder of the paper is structured as follows. Section 2 discusses analytical shortcomings in CPE that impede an understanding of the post-crisis experience and introduces the role of finance, fiscal policy, and non-price competitiveness as drivers of growth. Section 3 gives an overview of growth performances before and in the decade after the GFC, and illustrates that improving current account balances in many countries do not reflect genuine export-led growth. Section 4 examines the empirical relevance of different growth drivers in the pre- and post-GFC period. Section 5 concludes and discusses implications of our analysis for CPE and IPE.
Growth models and growth drivers in CPE
Our analysis builds on the GM approach to CPE but argues that it suffers from theoretical and methodological shortcomings that impede an understanding of the post-GFC experience. We first provide our assessment of the existing literature and then present the ingredients for an extension of the analysis of economic growth.
Some analytical shortcomings of CPE
The VoC approach, which has been dominant in CPE until recently, is centered on the concept of competitiveness, which is the reference point for the viability of the different types of capitalism. The initial conception of competitiveness was a broad one, allowing for competitive pressure on labor markets in liberal market economies (LME), as well as training and skill orientation for incremental innovation in coordinated market economies (CME). However, in analyses of the Eurozone crisis this narrowed down to price competition (Hall, Citation2014; Iversen et al., Citation2016; Johnston et al., Citation2014; Johnston & Regan, Citation2016). It was argued that CMEs were able to control wage growth due to coordinated wage bargaining systems, whereas in (Mediterranean) Mixed Market Economies (MME) uncoordinated unions in the non-tradable sectors pushed up wages, which led to inflationary pressures that undermined price competitiveness. VoC’s reference to competitiveness also led to a focus on corporate finance. Household lending and real estate booms have not featured in first generation VoC analyses, but since the crisis have been added as features of MME (Hall, Citation2018) without a systematic theory of financial instability. Likewise, while debates around the use of fiscal policy in Europe are acknowledged, the role of fiscal policy as a source of demand is not theorized (Hall, Citation2018).
Baccaro and Pontusson (Citation2016) introduced the GM perspective into CPE as an alternative to the supply-side focused VoC. The GM approach builds on PKE’s theory of income distribution as a source of demand formation. Methodologically, Baccaro and Pontusson (Citation2016) used growth contributions, which indicate how much of the growth in aggregate income can be attributed to growth in net exports, consumption, and other income-components. Applying this perspective to Germany, Italy, Sweden and the United Kingdom, they argued that pre-crisis growth in Germany was driven by wage suppression in favor of export growth, while the United Kingdom boosted domestic demand through real wage growth and debt (but without an explicit analysis of finance). Sweden enjoyed more balanced growth, while Italy failed to stimulate aggregate demand. The GM perspective is a promising one, as it allows for a greater consideration of dynamics and divergence compared to the earlier VoC approach. However, it shares VoC’s strong focus on competitiveness. Especially price competitiveness through wage suppression has been identified as a major factor for European growth dynamics, but limited attention is paid to other drivers of demand, such as property price dynamics and fiscal policy.
The GM approach to CPE was critically discussed and refined in several contributions (Hope & Soskice, Citation2016, Hall, Citation2018, Johnston & Regan, Citation2018, Behringer & van Treeck, Citation2019, Hassel et al., Citation2020, Hein et al., Citation2020). Hein et al. (Citation2020) explicitly consider private borrowing and public spending, and thereby overcome some of the blind spots mentioned above. They combine GDP-growth contributions of all income-components with an analysis of the financial balances of the private, public, and external sector. They distinguish ‘export-led mercantilist’ GMs with both current account surpluses and positive growth contributions of net exports, ‘weakly export-led’ models with only one of the two, ‘debt-led private demand boom’ models with strong growth contributions of consumption and private net borrowing, and finally a ‘domestic demand-led’ model in which domestic demand is the key source of growth and households are net lenders. With respect to the post-2008 period, Hein et al. (Citation2020, p.21) report a ‘tendency toward export-led mercantilist or weakly export-led regimes, on the one hand, and … domestic demand-led regimes stabilized by government deficits on the other hand’.
All these extensions build on the distinction between an export-led and a domestic demand-led GM. We contend that this distinction is of limited use for an understanding of the post-2008 period. First, consider a country where households deleverage after a financial bust, and the government pursues austerity. The result is a collapse in domestic demand and an improving current account. The growth contribution of net exports will thus be positive, and the country may be classified as export-led. For example, Hein et al. (Citation2020) classify 80% of their 30 countries as (mercantilist or weakly) export-led in the post-crisis period. We will question below that this a useful characterization of that period. While the authors discuss that the improvement in current accounts may be largely due to a contraction in import demand, partly induced by austerity, their classification framework does not reflect this. Second, the use of growth contributions is not well equipped to deal with the cyclical nature of certain GMs. While many analyses allow for a debt-led GM in which debt-financed consumption drives growth during the boom, the methodology is less suitable for identifying contractionary deleveraging in the financial bust.
In our view, the GM approach would benefit from a broader consideration of growth drivers and their dynamics. To clarify terminology: growth contributions identify the most dynamic components of aggregate income (consumption, investment, government spending, and net exports). Growth models can then be regarded as different institutional and political configurations that foster the dominance of either of these components. However, growth contributions as such say little as to why a certain component has grown. By contrast, growth drivers are distinct factors that are not themselves part of aggregate income but influence the growth of its components. Indeed, CPE does consider certain growth drivers, especially price competitiveness and wage growth as sources of export-led and consumption-led growth, respectively. However, not only has the set of growth drivers been relatively narrow, but there has also been limited attention to the question how growth drivers change over time. The implicit assumption seems to be that growth drivers are as stable as the institutional environment that make up a GM. We argue that this has impeded CPE’s ability to understand growth drivers in the decade since the 2008 crisis.
To broaden the analysis of growth drivers, we introduce several concepts from macroeconomics, especially PKE, into the GM approach. According to PKE, capitalist economies are normally characterised by unemployment and excess capacities (Lavoie, Citation2014, Stockhammer, Citation2021). As a result, expenditures stimulate economic production. The question then is what motivates different economic actors to spend. We highlight the role of (i) finance as a source of cyclical changes in private demand, (ii) discretionary fiscal policy as a source of public demand, and (iii) non-price competitiveness as a source of export demand.
Finance, financial cycles and private demand
In PKE, the private component of aggregate demand, i.e. consumption and investment, is strongly affected by finance. Asset price inflation, e.g. in real estate markets, has expansionary effects as it raises the wealth of households (Stockhammer & Wildauer, Citation2016) and stimulates construction. If households further use real estate as collateral to finance their expenditures through credit, property price bubbles are accompanied by rising household debt. PKs argued that prior to the GFC, property price bubbles and rising household debt turned some countries into unstable debt-led growth regimes, especially in southern Europe (Hein, Citation2012, Stockhammer et al., Citation2016). Similarly, CPE analyses of ‘privatized Keynesianism’ (Crouch, Citation2009) identified property price bubbles as key drivers of consumption demand that led to rising household debt; especially in the ‘Anglo-liberal growth models’ (Hay, Citation2009, Hay & Smith, Citation2013). Schwartz (Citation2008) argued that housing institutions like homeownership rates, high levels of mortgage debt, easy access to mortgage refinancing, and securitization determined whether the low interest rates prior to the GFC had notable growth-effects. In his view, the financialisation of households is expansionary only in countries with US-style housing markets. Recently, it was shown that financialised GMs are not confined to LMEs, but also appear in CMEs like Denmark, Sweden, and the Netherlands (Anderson & Kurzer, Citation2020), as well as Dependent Market Economies in eastern Europe, such as Hungary and the Baltics (Bohle, Citation2014, Citation2018).
We share the focus on finance as a driver of private demand. However, we argue that the CPE literature has failed to acknowledge the cyclical nature of debt-led growth. Recent macroeconomic research examines financial cycles, which are periodic ups and downs in private credit and property prices. These cycles are longer than regular business cycles (on average over 16 years) and are much more volatile than fluctuations in output (Borio, Citation2014). The existence of such financial cycles accords well with the Minskyan branch of PKE, which interprets financial crises as the result of endogenous boom-bust cycles. During economic booms, actors successively adopt riskier financial positions to finance expenditures, so that financial fragility in the macroeconomy increases. Eventually, rising fragility drags down spending and thus aggregate demand; cash flows decline, and a contractionary deleveraging process sets in. While Minsky’s (Citation2016) original analyses focused on corporate debt and stock prices, recent formal models extend his framework to household debt and property price cycles (e.g. Ryoo, Citation2016). There is also a more institutionalist Minskyan literature that argues that these cycles can assume the form of long waves, as financial innovation and deregulation allow for extended upswings (Guttmann, Citation2016, chap. 2; Palley, Citation2011). Accordingly, property price-driven growth episodes will be followed by sustained downturns that drag down private demand (Hein, Citation2019).
Fiscal policy, austerity and public demand
While there is an extensive CPE debate on welfare regimes, fiscal policy has received relatively little attention as a potential growth driver. Fiscal multipliers and government spending as an autonomous source of demand feature prominently in PKE but this has not informed GM analyses. The importance of fiscal policy came to the fore in the post-crisis period, which was characterised by fierce debates about the effects of fiscal austerity. A prominent argument within mainstream economics claims negative effects of high public debt ratios on economic growth (Reinhart & Rogoff, Citation2010) and expansionary effects of fiscal consolidation (Alesina & Perotti, Citation1997). These ideas were highly influential in the US-American and European policy debate after the crisis and provided intellectual support for fiscal austerity after the 2008 crisis.
Political economists, post-Keynesians, as well as some New Keynesian mainstream economists have been highly critical of austerity. Blyth (Citation2013) traces the historical and intellectual origins of austerity and presents several historical cases where austerity amplified downturns. From a Keynesian perspective, fiscal spending is expansionary through multiplier effects and can drive long-run growth as an autonomous source of aggregate demand (Allain, Citation2015, Hein, Citation2018). A substantial amount of econometric research finds that fiscal multipliers are larger during recessions compared to normal times (e.g. Blanchard & Leigh, Citation2014; see Gechert & Rannenberg, Citation2018 for a meta-analysis). Delong and Summers (Citation2012) argue that stronger output-effects of fiscal policy in a recession are due to the absence of supply constraints. Besides larger multiplier effects in the short run, fiscal policy in a recession may also have long-run effects on economic growth through hysteresis (Delong & Summers, Citation2012, Fatás & Summers, Citation2018, Gechert et al., Citation2019). Temporary falls in output can have permanent effects due to the deskilling of workforces and a decline in capital productivity. From this perspective, austerity in the post-crisis period worsened the recession and is likely to have permanently negative effects on growth (Fontana & Sawyer, Citation2011, Truger, Citation2013).
Non-price competitiveness and foreign demand
Besides price competitiveness through wage restraint, the quality and uniqueness of exports can be an important source of export demand. The relevance of such non-price competitiveness has been emphasized, among others, by structuralist post-Keynesian macroeconomists that theorize the role of (uneven) productive structures for growth performance (Simonazzi et al., Citation2013, Storm & Naastepad, Citation2016, Gräbner et al., Citation2020). They present evidence that the price elasticities of exports of major Eurozone countries are low and that net exports are mostly driven by domestic and foreign demand. In times where emerging markets increasingly dominate low-technology export markets, countries that are specialized in complex goods are more successful in securing their export market shares. Prior to the GFC, southern European countries were specialized in sectors with low productivity and little innovation potential. These sectors produce goods with a low income elasticity of export demand, whose export markets have therefore grown less rapidly than the markets for high-technology goods. Northern European countries, by contrast, managed to develop innovative sectors and thereby conquered the highest value-added segments of the export market. In this view, uneven development and industrial policies play a more prominent role that cost differentials.
This perspective has some similarity with earlier contributions in VoC on diversified quality production (Sorge & Streeck, Citation1988), but these have been side-lined by recent VoC analyses of the Eurozone crisis. In VoC, the institutional configuration of CMEs fosters incremental innovation through close links between technical universities and research systems, vocational training, and co-operative employer-employee relations that are conducive to investment in skills and high-value added production (Hall, Citation2018; Iversen et al., Citation2016). Recently, Vermeiren (Citation2017) argues that especially for CMEs, non-price competitiveness in the production of quality-differentiated goods is important as these goods tend to be price-inelastic.
Growth before and after the GFC: Domestic versus foreign components
We start our empirical analysis by a general assessment of economic growth and its domestic and foreign components before the GFC (between 2000 and 2007), and during and after the GFC (2008 to 2017). We are interested in how growth drivers have changed since 2008, how this has translated into cross-country differences in growth, and what this means for the GM approach, rather than in classifying GMs. The 2008 GFC was a truly global crisis that emanated from the financial center USA and then led to a global recession in 2009; triggering a reversal in growth and financial dynamics in many countries. By contrast, the subsequent 2010-12 Eurozone crisis was a regionally confined crisis in government bond markets that took place against the macroeconomic backdrop of the GFC. Accordingly, we divide our sample along the GFC.Footnote2 Notably, our ‘post-GFC’ period purposefully includes the GFC (and the Eurozone crisis), as we are interested in how the crisis affected growth drivers and growth performance.
Our sample of 30 high-income OECD countries includes the English-speaking Pacific, North America, and Europe (Australia, New Zealand; Canada, USA; Ireland, United Kingdom); the Nordic countries (Denmark, Finland, Iceland, Norway, Sweden); the Benelux countries (Belgium, the Netherlands, Luxembourg); the German-speaking countries (Austria, Germany, Switzerland); southern Europe (France, Greece, Italy, Portugal, Spain); the Visegrád eastern European countries (Czech Republic, Hungary, Poland, Slovakia) plus Slovenia; and the Baltics (Estonia, Latvia, Lithuania).
reports key macroeconomic indicators for the pre-GFC (2000-2007) and the post-GFC period (2008-2017). The first column contains the average real gross national income (GNI) growth rate. GNI is defined as gross domestic product (GDP) plus net income received from abroad. GNI thus measures the final income that accrues to the households, corporations and the government of an economy (see also Behringer & van Treeck, Citation2019). For many countries, the difference between GNI and GDP is trivial; but there are a few exceptions. For example, Ireland and Luxembourg, but also Czech Republic and Poland host many large multinational corporations that distribute profits to foreign owners, so that their GNI is smaller than their GDP.Footnote3 In addition, many southern European countries faced significant external debt service costs in the post-crisis period, which is better accounted for by GNI than GDP.
Table 1. Macroeconomic performance, 2000-2007 and 2008-2017.
The pre-GFC period was a phase of high but uneven income growth (3.6% on average). While some countries’ growth performance was modest and stayed below 2% on average (Germany, Switzerland, Italy, Portugal), many countries grew between 2% and 4%, including southern Europe’s Greece and Spain, as well as Poland, Czech Republic and Slovenia in eastern Europe. Exceptional economic booms took place in Iceland, Ireland, Slovakia and the Baltics, which grew on average by more than 4%. By contrast, the post-crisis period is characterised by a pervasive convergence on much more sluggish growth rates (1.1% on average). Again, there is some heterogeneity with some countries performing especially poorly as reflected in negative or stagnant growth (Greece, Luxembourg, Italy, Portugal). Overall, the period after the GFC is thus one of comparatively slow growth but with notable cross-country heterogeneity.
To relate our analysis to the existing GM literature, columns 2 and 3 of report the growth contributions of the current account and domestic income (consumption, investment, government spending) for the two periods.Footnote4 On average, the current account growth contribution was negative in the pre-crisis period, reflecting the fact that many advanced countries worsened their current account positions during the pre-GFC boom. Exceptions are well-known export-led countries such as Norway, Sweden, Netherlands, Austria, Germany, and Switzerland. In the post-crisis period, many countries that had negative current account contributions prior to the crisis now exhibit positive ones. Countries in which this pattern is particularly pronounced are Ireland, Spain, Greece, the Baltics, and Iceland, which were commonly classified as debt- (or consumption-)led prior to the GFC.
Finally, column 4 reports the current account to GNI ratio. The gray-shading indicates an improvement in the current account position compared to the pre-crisis period. More than two thirds of the countries in the sample improved their current account position after the GFC. Indeed, many countries that had large negative current account positions during the pre-crisis period substantially reduced these deficits, while surplus countries such as Austria, Denmark, Germany, and the Netherlands further increased their surpluses.
Taken at face value, these results may be interpreted as a shift toward export-led growth for most countries. Indeed, in Hein et al. (Citation2020; Table 6) 24 out of 30 countries are classified as either ‘export-led mercantilist’ or ‘weakly export-led’; only North America, New Zealand, France, and Finland are classified as domestic demand-led. However, a closer look casts doubt on this interpretation. First, column 3 of shows that the domestic growth contribution has substantially increased not only for the English-speaking countries (except Ireland), but also for several countries previously known for their strong export-orientation; notably Norway, Sweden, Austria, Switzerland, and Germany. These countries continue to exhibit large and, in some cases, growing current account surpluses and thereby contribute to global imbalances (Hein, Citation2019), but in what sense can their domestic growth still be meaningfully called export-led?
Second, and more importantly, a decomposition of the growth contribution of the current account into imports and exports casts further doubt on the view that export-orientation has generally increased (). This exercise is especially interesting for the countries that substantially reduced their current account deficits in the post-crisis period, i.e. southern Europe (except France), the Baltics, Iceland, and Ireland. Within this group, Greece and Spain are extreme cases that achieved a highly unusual positive growth-contribution of imports due to a brutal reduction in imports. While not as extreme, the other countries also substantially slowed down the growth of their imports. The last column of compares the relative size of the change in the growth contribution of exports and imports over the two periods. It turns out that for all countries except for Ireland,Footnote5 the improvement in the import contribution dominates that of the export contribution. This suggests that the strong improvement in the growth contribution of current accounts was largely driven by a reduction in import demand rather than an increase in exports.
Table 2. Growth contributions of exports and imports, 2000-2007 and 2008-2017.
In our view, the combination of a widespread improvement in the current account position with a general slowdown in economic growth reflects the internal and external contradictions of the export-led and the debt-led GMs, rather than a general shift toward export-led growth. Internally, while many deficit-countries sought to boost their net exports, current accounts were mainly improved by slashing imports in the wake of weak aggregate demand. We will show that this contraction in aggregate demand is especially relevant in those countries that underwent debt-led booms in the pre-crisis period. Externally, the contraction in debt-led countries manifested itself in falling export demand in the previously export-led countries. Consequently, domestic demand components gained importance despite the fact that these countries still exhibit substantial surpluses. These results question the usefulness of the concept of export-led growth for the post-crisis experience.
Growth drivers before and after the GFC: Finance, fiscal policy, and competitiveness
To assess the role of finance, fiscal policy, and competitiveness for growth, we examine the association of proxies for these growth drivers with economic growth in the pre- and post-GFC period (see ).Footnote6 We utilize scatterplots which (i) allow for a cross-country comparison, (ii) reveal changes in growth drivers between the two periods, and (iii) indicate how, and how strongly, these drivers are linked to growth. We also conduct a multivariate regression analysis.
Table 3. Overview of key growth drivers.
Finance: Debt-led growth and financial cycles
To capture sources of finance-driven private demand, we use the growth rate of real house prices, which is expected to stimulate consumption and residential investment through wealth effects. We also examine the change in household debt-to-income ratios. The pre-crisis period is characterised by a strong increase in house prices and household debt, especially in English-speaking countries such as Ireland, Australia, and the UK; southern European countries like Spain; the Baltics, but also Denmark and Norway. In these countries, both house prices and household debt grew by 50% or more between 2000 and 2007. These figures are in line with a rich CPE literature on the financialisation of households prior to the crisis (see, e.g. Bohle, Citation2014, Citation2018 on Hungary and the Baltics; Hay & Smith, Citation2013 on the UK and Ireland; and Anderson & Kurzer, Citation2020 on Denmark, Sweden, and the Netherlands). Fuller (Citation2015) documents that liberal housing institutions such as widespread homeownership, loan-to-value ratios, mortgage subsidies and the size of secondary markets for securitized loans fostered the increase in private debt in these countries.
The scatter plots in the left column of demonstrate a positive link between property price inflation and growth on the one hand, and between household debt and house prices on the other. Notably, the link between house prices and growth is fairly tight and statistically significant (and does not hinge on the extreme case of Lithuania).Footnote7 The fit of the regression line is comparatively good ( suggesting that growth-effects of house prices are in principle not limited to countries with liberal housing institutions. However, our scatterplots also reveal that it was predominantly countries with liberal housing institutions, in which strong house price inflation was economically significant in the pre-crisis period.
Figure 1. House prices and GNI growth (upper panel), house prices and household debt (lower panel); before and after 2008.
Data sources: OECD, BIS; authors' calculations. See Supplementary material, Table A1, for data definitions and data restrictions.
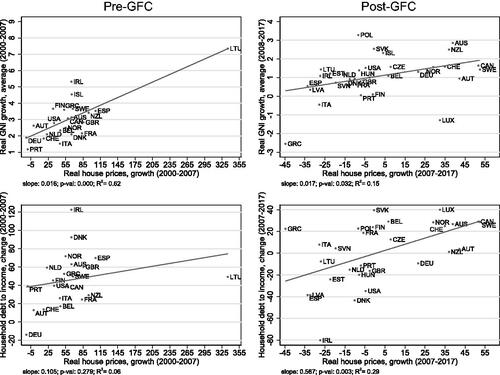
The GFC came with a dramatic reversal in housing dynamics in many countries.Footnote8 Overall, it is a period of falling real estate prices and household deleveraging. The countries that previously experienced booms, i.e. Ireland, Denmark, Spain, the Baltics, the US and the UK, are now going through severe busts. A few countries undergo rising household debt ratios (notably Luxembourg and Slovakia) and experience some house price inflation (e.g. Sweden, Canada, and Austria), but the magnitudes are nowhere near the pre-crisis period. The second column of shows that the link between house prices and growth is still statistically significant in the post-GFC period: countries that underwent housing busts (e.g. Greece, Italy, Latvia, Spain) performed poorly, whereas output in countries with strong house price growth grew comparatively fast (e.g. Canada and Sweden).
The dynamics of household debt in the post-crisis period are again positively correlated with house prices, and the relationship is now statistically significant. Most countries that experienced a fall in house prices also underwent household deleveraging, especially Ireland (-80.2%-pts), Spain (-38.6%-pts), and Latvia (-38.5%-pts).
In our view, the changing dynamics of housing and finance between the pre- and the post-GFC period are an expression of the financial cycle (Palley, Citation2011, Borio, Citation2014, Guttmann, Citation2016). Those countries that experienced a surge in household debt prior to 2008, underwent strong household deleveraging during the post-GFC period (). By the same token, countries that avoided surging household debt in the pre-crisis period either exhibit more stable household debt ratios in the post-crisis period or continue on a modest household debt growth path. Interestingly, these are often countries with more regulated housing markets like Austria, Germany, Italy and Slovenia (Fuller, Citation2015; Schwartz, Citation2008).
Figure 2. The financial cycle: change in household debt before and after 2008.
Data sources: OECD, BIS; authors’ calculations. See Supplementary material, .
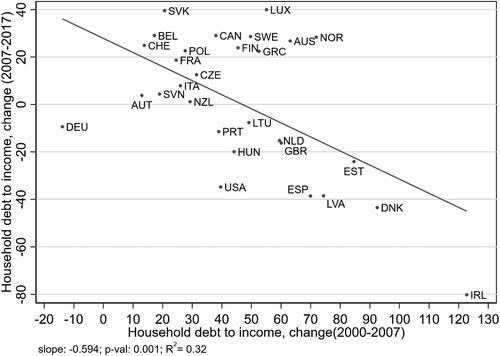
In sum, our results show that growth dynamics are strongly related to the financial cycle, both in the pre- and post-crisis period. Those countries that underwent a house price bust after the GFC experienced a stronger reduction in growth, especially some southern European and English-speaking countries, as well as the Baltics.
Fiscal policy: Short expansion, sustained austerity
To capture fiscal policy as a driver of public demand, we use the cyclically adjusted primary fiscal balance (i.e. before interest payments), also known as the structural fiscal balance. Unlike the financial balance of the public sector considered in Hein et al. (Citation2020), the ‘cyclically adjusted’ balance is adjusted for those types of fiscal expenditures and revenues that are sensitive to the business cycle, e.g. income taxes and unemployment benefits (the so-called automatic stabilisers). It is a proxy for discretionary fiscal policy actions and therefore less sensitive to econometric endogeneity problems. For the same reason, it is normalized by potential rather than actual output. A potential weakness is its reliance of an estimate for potential output, which is defined as the maximum output that is compatible with a stable inflation rate, i.e. it incorporates contested concepts like the NAIRU (Non-Accelerating Inflation Rate of Unemployment). In the past years it may understate potential output substantially. Despite its shortcomings, the structural fiscal balance is a commonly used measure of the fiscal stance, both in the EU’s fiscal surveillance framework and in recent GM studies (Behringer & van Treeck, Citation2019).
The period prior to the GFC yields a heterogeneous picture: expansionary fiscal policy can be observed in many eastern European countries (especially Slovakia, Hungary, Czech Republic, Lithuania), but also in Norway. By contrast, the Benelux countries, many Nordic countries (Denmark, Finland, Iceland, Sweden) and southern Europe’s Italy and Spain ran structural surpluses. Indeed, it is well-known that not all countries that were affected by sovereign debt problems after the GFC were previously running fiscal deficits. The upper panel of displays a theoretically expected negative, but statistically insignificant link between budget balances and growth for the pre-crisis period.
Figure 3. Cyclically adjusted fiscal balance (to potential output) and GNI growth, 2000-2007 and 2008-2017.
Data source: IMF; authors’ calculations. See Supplementary material, .
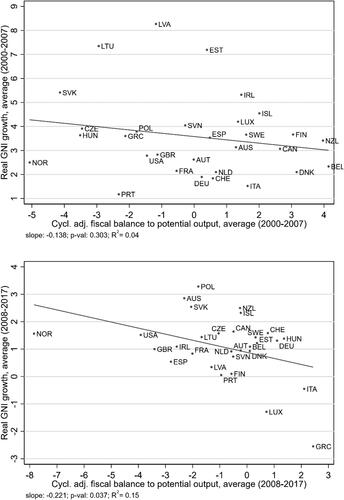
During the GFC, almost all countries responded with a strong initial fiscal expansion. Many countries then embarked on gradual fiscal consolidation from 2010 onwards by gradually raising their fiscal balances (see in the Supplementary material). Indeed, the period is known for the harsh austerity that was attached with official financial assistance of the troika in Ireland, Greece, Spain, and Portugal (Perez & Matsaganis, Citation2018) despite the fact that these countries were in a recession. Fiscal retrenchment also took place under the Coalition government in the UK (Lavery, Citation2018) but this was during a period of weak recovery.
For the relationship between discretionary fiscal policy and economic growth, the structural fiscal balance over the whole post-crisis period matters. After all, according to the Keynesian theories discussed in section 2, fiscal stimulus during recessions is expected to have sustained positive effects on growth. The lower panel of shows that in absolute terms, structural fiscal expansion was especially strong in the English-speaking countries (USA, UK, Ireland, Australia), but also in Norway and Spain. By contrast, some countries overall engaged in severe fiscal contraction; above all Greece and Italy, but also Hungary, Germany, Switzerland and Luxembourg. Notably, the fitted line suggests that the link between economic growth and public demand has become tighter in the post-crisis period, as reflected in a steeper slope that becomes statistically significant at the 5% level. This result is consistent with higher fiscal multipliers during recessions and negative hysteresis effects (Fatás & Summers, Citation2018, Gechert et al., Citation2019).
Indeed, it is precisely those countries that enacted vigorous austerity policies to attain a positive structural balance (e.g. Greece: 2.4%; Italy: 2.1%, Luxembourg: 0.72%) that are at the bottom of the post-crisis growth performances. Austerity after the Great Recession was thus indeed highly counterproductive (Blyth, Citation2013, Stockhammer et al., Citation2019). By contrast, countries that enacted a more intense initial fiscal expansion, such as the United States (-3.91%) and the United Kingdom (-3.41%), display markedly better growth rates
Competitiveness: Labour costs versus export sophistication
We finally consider competitiveness as a driver of foreign demand. Our proxy for price competitiveness is the real effective exchange rate based on unit labor cost in manufacturing (REERMANUF). The effective exchange rate is a trade-weighted average over a basket of exchange rates. It is deflated by the domestic relative to foreign unit labor costs in manufacturing. This proxy thus captures changes in the relative price competitiveness of an economy as determined by excess nominal wage growth over productivity growth in the manufacturing sector. Given that manufactured goods make up 87.4% of all exports of the median country in our sample (88.5% in the pre-crisis and 86.3% in the post-crisis period),Footnote9 we consider this to be a good proxy for the price competitiveness of exports, but we note that it does not account for service exports.Footnote10
In line with VoC analyses (Hall, Citation2014; Iversen et al., Citation2016; Johnston et al., Citation2014; Johnston & Regan, Citation2016), the pre-GFC period came with a worsening of price competitiveness for many countries, especially in southern Europe (e.g. Greece +23.6% and Spain +19.4%). However, in , upper panel, the fitted line between the growth rate of REERMANUF and GNI growth has a statistically insignificant positive slope. Thus, there is little evidence that a worsening of price competitiveness was a drag on growth.
Figure 4. Growth of real effective exchange rate in manufacturing (REERMANUF) and average GNI growth rate, before and after 2008.
Data source: OECD; authors’ calculations; See Supplementary material, .
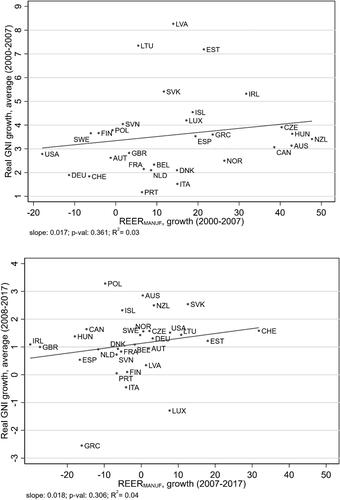
For many countries, the post-crisis period came with a reversal of REERMANUF dynamics. Many countries underwent a real depreciation in manufacturing; the UK, Ireland, Hungary, Spain and Greece by more than −15%. For the latter four, this is undoubtedly due to heavy structural reforms in the context of official financial assistance (Perez & Matsaganis, Citation2019). However, the fitted line in the lower panel of again exhibits a positive but statistically insignificant coefficient. The reason for this phenomenon is that many countries that did improve their relative price competitiveness after the crisis, simply did not enjoy higher growth rates. Overall, this casts doubt on the importance of price competitiveness as a key driver of growth.
As a measure of non-price competitiveness, we use the average economic complexity index (ECI). The ECI is based on disaggregated data on trade in products and captures two dimensions: the diversity of a country’s exported products (the number of distinct products it exports)Footnote11 and their ubiquity (the total number of countries that export these products) (Hidalgo & Hausmann, Citation2009). A country that exports a diverse range of products that few other countries can produce will get a high ECI score. It is thus quality, not price that determines ECI scores. Hausmann et al. (Citation2007) show that the complexity of exports is a good predictor of growth.Footnote12 A drawback of the ECI is that it does not account for service exports. However, as noted above, manufactured products are the lion’s share in exports, and this has barely changed over the two periods. An alternative approach is to estimate the price-elasticity of total exports (Baccaro & Benassi, Citation2017; Baccaro & Pontusson, Citation2016). A low price elasticity can then be interpreted as non-price competitiveness being important. The ECI has the advantage that it condenses descriptive information embodied in the network of product-level trade data. Unlike a price-elasticity, the ECI is not a statistical estimate and is thus not sensitive to the details of the estimation.
The average values of the ECI prior to the crisis broadly reflect conventional wisdom about productive structures. Export-led countries like Germany, known for its specialization in medium-high technology exports (Storm & Naastepad, Citation2016, Gräbner et al., Citation2020), Switzerland and Sweden are at the top with ECI scores between 2 and 3.1. The USA and UK also exhibit relatively high scores, illustrating that a country can be externally highly competitive (e.g. through the export of cars and aircrafts), but still exhibit current account deficits. The Visegrád and Benelux countries hold a middle ground, whereas Greece and Portugal, the Baltics, New Zealand and Australia appear at the bottom.
plots the ECI against growth performance. In the upper panel, the average level of export sophistication is negatively correlated with growth prior to the GFC. This unexpected relationship appears to be related to the previously discussed finance-driven boom that occurred in countries with low export sophistication, such as the Baltics, New Zealand and Greece. At the same time, countries with high export sophistication such as Germany and Switzerland only exhibited modest growth rates prior to the crisis.
Figure 5. Export complexity index (ECI) and GNI growth, 2000-2007 and 2008-2017.
Data source: OEC; authors’ calculations. See Supplementary material, .
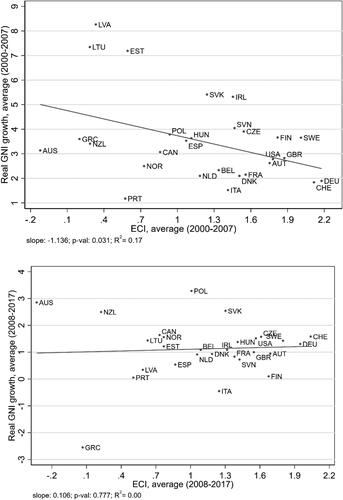
In the post-crisis period, only Norway and the eastern European countries (except Slovenia) exhibit a higher ECI compared to before the crisis. This is likely to reflect technological upgrading through foreign direct investment (FDI) that already began prior to the GFC, when transnational corporations from northern Europe relocated parts of their production to eastern Europe. FDI allowed these countries to develop or deepen segments of high-tech manufacturing (e.g. cars, electronics, and pharmaceutical industries) (Stockhammer et al., Citation2016, Bohle, Citation2018). This stands in sharp contrast to southern Europe, which further reduced its already low level of non-price competitiveness. If structural reforms imposed by the troika were ever intended to increase non-price competitiveness, they failed spectacularly.
The correlation between the ECI and growth becomes positive in the period after the GFC but is not statistically significant (lower panel of ). Additional tests suggest a more reliable link: when excluding the outliers Australia and New Zealand, whose dynamics are partly driven by their trade linkages with booming China, the correlation becomes strongly positive and statistically significant at the 5% level.
It can be argued that competitiveness should directly impact the current account. Thus a plot of our competitiveness variables against the current account balance may constitute a better test (see Supplementary material, ). These plots support our findings. Prior to the GFC, REERMANUF exhibits the expected negative relationship with the current account, but the coefficient is not statistically significant. In the period after the GFC, this correlation unexpectedly becomes positive and statistically significant. This suggests a failure of real depreciation to stimulate foreign demand. By contrast, when plotting the ECI against the current account balance, we find a positive and statistically significant link in both time periods.
Overall, this suggests that non-price competitiveness may be a more important source of foreign demand than price competitiveness. The latter seems to have lost relevance for net exports in the period after the GFC. Structural reforms reduced labor cost in many countries that previously had debt-led booms, but this had little impact on growth. In fact, they may have further worsened non-price competitiveness. Storm and Naastepad (Citation2016, p. 63) argue that labor market flexibility can be harmful for productivity and innovation, as they disincentivise firms to invest in workers’ firm-specific human capital and labor-saving technical change. By contrast, countries with a high export sophistication, especially northern Europe and the Visegrád economies, better managed to sustain growth in an environment of overall diminished international trade.
An econometric test
We finally check whether the main results from the bivariate scatterplots hold up in a multivariate regression (). Due to limited degrees of freedom and a potential simultaneity bias, the results have to be taken with some caution. Compared to the bivariate scatterplots, the advantage of the multivariate regression is that it controls for all four growth drivers simultaneously. In the pre-crisis period, only house prices growth (HPR) is statistically significant (at the 1% level) and positively related to GNI growth, in line with the notion of debt-led growth. In the post-crisis period, the coefficient on HPR remains positive and statistically significant. In addition, the slope coefficient on the structural fiscal balance (FISBAL) becomes negative and statistically significant at the 5% level, consistent with Keynesian theories of fiscal policy. By contrast, our proxies for price and non-price competitiveness are statistically insignificant in both periods. Overall, this confirms the importance of house price dynamics and the increasing relevance of fiscal policy for economic growth in the post-crisis period.
Table 4. Multivariate regression.
Discussion: Implications for comparative and international political economy
Our analysis has shown that the post-crisis period came with improved current accounts for most countries, but importantly this was associated with weak growth or stagnation. Wage deflation intended to improve current account balances but did not turn out to be a successful growth driver. Overall, there has been no shift toward genuinely export-led growth. Instead, macroeconomic performances in many countries are associated with changes in growth drivers triggered by the GFC, specifically the downturn of a financial cycle and crisis management though fiscal policy. In some countries, especially the English-speaking ones, financial busts were cushioned by strong fiscal expansion during the recession. Other countries, especially in southern Europe, worsened their recessions through fiscal austerity and ended up at the bottom of post-GFC growth performances.
We abstain from classifying GMs based on our analysis of growth drivers. First, our analysis showed that growth drivers, for example house prices and fiscal policy, changed considerably in response to a major crisis in the global political economy. By extension, the subsequent dynamics of GMs may change drastically. Second, we showed that growth has overall been poor since the GFC. We thus do not think that new GMs are in place. Rather we are in an interregnum where growth drivers have become diversified, and we see the contradictions of the old GMs unfold. However, our analysis still allows us to draw out some implications for the GM debate.
At the theoretical level, we argue for a more prominent role of the financial cycle and government demand policies, and we think that price competitiveness is overrated. First, property price cycles are an important driver of private demand, even in the downturn. While debt-financed consumption-led growth (also known as privatized Keynesianism or the Anglo-liberal GM) has featured prominently in CPE (Crouch, Citation2009, Hay, Citation2009, Hay & Smith, Citation2013), the cyclical nature of this GM has not been fully appreciated. Minskyan asset price bubbles may drive up growth and household debt for sustained periods, but this will be followed by debt-led depressions (Palley, Citation2011, Borio, Citation2014, Guttmann, Citation2016, Hein, Citation2019). While widespread homeownership and liberal housing institutions highlighted in CPE (Schwartz, Citation2008, Fuller, Citation2015) seem to make countries more prone to such financial cycles, the growth-effects of house prices are relatively similar across countries. Second, fiscal policy strongly shaped domestic demand-led GMs in the post-crisis period, albeit in two very different forms: as a stabilizer in some countries, but as contractionary austerity in others. Fiscal multipliers are larger in recessions and austerity can permanently reduce productivity (Fatás & Summers, Citation2018; Gechert et al., Citation2019), which means that government spending and taxation must be considered as a key driver of GMs. In CPE, welfare state regimes have received a lot of attention, but the growth effects of fiscal policy feature less prominently. Third, the relevance of price competitiveness has been overstated in CPE (Johnston et al., Citation2014, Baccaro & Pontusson, Citation2016, Johnston & Regan, Citation2016). Internal devaluation improved current accounts after the crisis, but not growth. By contrast, especially the eastern European Visegrád countries improved their export competitiveness through quality upgrading and accomplished above-average growth rates. This calls for a shift in attention from labor market institutions and wage coordination toward the institutional and political determinants of productivity and economic complexity, as highlighted in structuralist PKE and, partly, VoC (Simonazzi et al., Citation2013, Storm & Naastepad, Citation2016, Vermeiren, Citation2017, Gräbner et al., Citation2020).
Methodologically, we contend that the dichotomy of export-led vs (debt-financed) consumption-led GMs via growth contributions, which had proven useful for the period prior to the GFC, may give misleading results for the period after. The most apparent case in point is that most of the observed positive growth contributions of net exports in the post-crisis period are dominated by a slowdown in import growth (mostly due to weak domestic demand) rather than fast growing exports. Based on growth contributions, these countries may appear ‘export-led’, but neither did they deliver a notable export performance nor did their exports lead to growth. Similarly, growth contributions are unhelpful to detect the key role of financial busts in the debt-led GM. A bust may show up as a decline in private domestic demand and thus suggest a change in the GM, where in fact such cyclical behavior is inherent to the debt-led model. Thus, we suggest basing the analysis of GMs on growth drivers rather than growth contributions. This brings problems of causal identification which are more challenging than in the analysis of growth contributions, and potentially opens a pandora’s box of manifold potential growth drivers. We hope to have demonstrated that the post-Keynesian theory of demand-formation offers an analytical framework to broaden and operationalize relevant growth drivers.
Finally, our analysis also has implications for debates in IPE. In a recent contribution, Blyth and Matthijs (Citation2017) criticize a narrow microeconomic focus in IPE since the 1990s and argue in favor of stronger Keynesian macro-foundations. They introduce the notion of a Macroeconomic Regime, which is defined as a set of institutions that are geared toward specific policy targets: full employment in the postwar period and price stability since the 1980s. Macroeconomic Regimes are stable for a while, but then endogenously undermine themselves through unintended outcomes like high inflation or financial instability that trigger political pressures toward regime change. Our approach is consistent with Blyth and Matthijs (Citation2017)’s call for Keynesian macroeconomic foundations and endogenous instability. However, in our view, inherent contradictions are specifically related to the export-led and debt-led GMs that were in place prior to the GFC, rather than a policy target such as price stability that has been common across GMs.
Prior to the GFC, the export-led and debt-led model were in a symbiotic relationship whereby the latter would absorb the exports of the former. This symbiosis broke down after the GFC, when import demand in the consumption-led model contracted due to household deleveraging. More generally, export-led growth through current account surpluses is a beggar-thy-neighbour policy that cannot succeed globally (Hein, Citation2019). As argued in Matthijs (Citation2020) with reference to Kindleberger’s Hegemonic Stability Theory, during a global crisis, dominant states must provide global demand as a public good in order to stabilize the international system. Matthijs' (Citation2020) claim that the USA but not Germany were willing to play that role during the GFC is in line with our findings with respect to public demand, but less so with external demand: even the USA improved their current account balance by slowing down import growth. On the political side, the pervasive pursuit of export-orientation is likely to induce retaliation from trade partners. A prime example for such a response is the ongoing trade war between China and the USA. Trump has also repeatedly criticised Germany’s current account surpluses and threatened to introduce tariffs on German cars. Given these constraints, we doubt that multiple countries will be able to successfully pursue export-led growth over longer periods.
Similarly, there have also been futile attempts to revive the debt-led GM that was in place prior to the GFC; most blatantly the ‘help to buy’ programmes in the UK that enable high loan-to-value ratios for first-time buyers via state-sponsored loan guarantees. However, our analysis points to the riskiness of such policies, as asset price-driven growth eventually gives way to debt-driven depressions. There are also political constraints to this model. Recent research shows that regions that were excluded from house prices gains were more likely to vote for Brexit (Adler & Ansell, Citation2020). The volatility of house prices inherent to debt-led GMs is therefore likely to trigger social discontent that may undermine their political stability. In addition, the ability to use fiscal policy to mitigate financial busts depends on specific (supranational) political constraints: while countries like the USA and UK could support their fiscal expansions through monetary policy, EMU membership and ECB conditionality severely constrained the policy space of southern Europe. Southern Europe was thus compelled to pursue austerity leading to rising poverty, inequality, and social protests (Perez & Matsaganis, Citation2018), which further compromise the political underpinning of debt-led growth.
This paper’s attempt to identify growth drivers after the GFC is based on data that precede the COVID-19 pandemic. Similar to the GFC, the pandemic is a global crisis that hits different GMs at the same time. We conjecture that it will give more prominence to the factors we have highlighted: the financial cycle and fiscal policy. Lockdowns have created arrears in rent and mortgage payment that may impact housing markets. However, as of now it appears that the pandemic may shift the main source of financial instability from households to firms, which will come out of the crisis with high debt burdens. At the same time, fiscal policy has become an even more important growth driver, with fiscal expansions at an unprecedented scale. In the Eurozone, this has revived tensions between surplus and deficit countries over fiscal transfers, which were eventually resolved in favor of a €750bn collective recovery package. The decisive use of fiscal expansion in the pandemic may increase the acceptance of public demand management as an alternative to export-led and debt-led growth. While it is too early to tell, the GM literature might soon enough add a ‘state-led’ GM to its conceptual toolbox.
Supplemental Material
Download PDF (677.1 KB)Acknowledgements
We are grateful to Louis Daumas for excellent research assistance at an early stage of this project. We also thank Lucio Baccaro, Philipp Heimberger, Jakob Kapeller, Inga Rademacher, Alen Toplišek, James Wood, three anonymous referees, and the editors for helpful comments. The paper also benefited from comments by participants at the Forces and Fractures in the World Economy workshop at King’s College London in September 2019, the 23rd FMM conference in Berlin in November 2019, and the 2020 Allied Social Science Association conference in San Diego in January 2020. All remaining errors are the authors’.
Disclosure statement
No potential conflict of interest was reported by the author(s).
Additional information
Notes on contributors
Karsten Kohler
Karsten Kohler is a lecturer at King’s College London. His research interests are business and financial cycles; exchange rates and macroeconomic volatility in emerging markets; as well as financialisation, income distribution, and growth models in advanced countries. Most of his work can be found at https://karstenkohler.com/
Engelbert Stockhammer
Engelbert Stockhammer is Professor of International Political Economy at King’s College London. His research areas include macroeconomics, financialisation, growth and distribution and economic policy in Europe. He has published more than 70 articles in peer-refereed journals and co-edited Wage-Led Growth. An Equitable Strategy for Economic Recovery (Palgrave).
Notes
1 We will use the terms ‘consumption-led’ and ‘debt-led’ interchangeably.
2 This periodisation is supported by a formal analysis of the turning points in real gross national income over the period 2000-2017. For the majority of countries, the years 2007-08 constitute the peak in real GNI in this period (see Table A2 in the Supplementary material).
3 In the case of Ireland, a change in the residency of several large multinational corporations in 2015 distorted the measurement of GDP, leading to a GDP growth rate of 26%. The national statistical office of Ireland now reports an adjusted figure that corrects for these distortions, but this is only available for GNI, which constitutes another motivation to use GNI in this paper (see Table A1 in the Supplementary material).
4 In line with our use of GNI instead of GDP, we use the current account instead of the net export contribution.
5 Brazys and Regan (Citation2017) convincingly argue that the Irish recovery from the GFC had nothing to do with fiscal consolidation and structural reforms, but rather with a state-led enterprise policy that managed to attract FDI in high-tech computer and information services. This is likely to be the source of Ireland's comparatively strong export performance.
6 The corresponding data can be found in the Supplementary material (Tables A2-A4).
7 When dropping Lithuania from the sample, the estimated slope coefficient in the upper-left panel remains statistically significant at the 5% level and the slope coefficient in the lower-left panel, in fact, becomes statistically significant (see note below Figure 1 for details).
8 This is confirmed by a formal turning point analysis of house prices (see Table A2 in the Supplementary material).
9 Own calculations based on World Bank’s TCdata360 database.
10 We checked the robustness of our results by using the aggregate real effective exchange instead, but this makes little difference.
11 The number of distinct exported products is measured by revealed comparative advantage. Whenever the share of an exported good in a countries’ total exports exceeds the good’s share in total world exports, the country is said to have a revealed comparative advantage in this good.
12 The ECI has also been used as a measure of technological capabilities in the comparative study on the Eurozone by Gräbner et al. (2020).
References
- Adler, D., & Ansell, B. (2020). Housing and populism. West European Politics, 43 (2), 344–365. https://doi.org/10.1080/01402382.2019.1615322
- Alesina, A., & Perotti, R. (1997). The welfare state and competitiveness. The American Economic Review, 87 (5), 921–939.
- Allain, O. (2015). Tackling the instability of growth: A Kaleckian-Harrodian model with an autonomous expenditure component. Cambridge Journal of Economics, 39 (5), 1351–1371. https://doi.org/10.1093/cje/beu039
- Anderson, K. M., & Kurzer, P. (2020). The politics of mortgage credit expansion in the small coordinated market economies. West European Politics, 43 (2), 366–389. https://doi.org/10.1080/01402382.2019.1596421
- Baccaro, L., & Benassi, C. (2017). Throwing out the ballast: growth models and the liberalization of German industrial relations. Socio-Economic Review, 15 (1), 85–115.
- Baccaro, L., & Pontusson, J. (2016). Rethinking comparative political economy: The growth model perspective. Politics & Society, 44 (2), 175–207. https://doi.org/10.1177/0032329216638053
- Behringer, J., & van Treeck, T. (2019). Income distribution and growth models: A sectoral balances approach. Politics & Society, 47 (3), 303–332. https://doi.org/10.1177/0032329219861237
- Blanchard, O. J., & Leigh, D. (2014). Learning about fiscal multipliers from growth forecast errors. IMF Economic Review, 62 (2), 179–212. https://doi.org/10.1057/imfer.2014.17
- Blyth, M. (2013). Austerity: The history of a dangerous idea. Oxford University Press.
- Blyth, M., & Matthijs, M. (2017). Black Swans, Lame Ducks, and the mystery of IPE’s missing macroeconomy. Review of International Political Economy, 24 (2), 203–231. https://doi.org/10.1080/09692290.2017.1308417
- Bohle, D. (2014). Post-socialist housing meets transnational finance: Foreign banks, mortgage lending, and the privatization of welfare in Hungary and Estonia. Review of International Political Economy, 21 (4), 913–948. https://doi.org/10.1080/09692290.2013.801022
- Bohle, D. (2018). European integration, capitalist diversity and crises trajectories on Europe’s eastern periphery. New Political Economy, 23 (2), 239–253. https://doi.org/10.1080/13563467.2017.1370448
- Borio, C. (2014). The financial cycle and macroeconomics: What have we learnt? Journal of Banking & Finance, 45, 182–198. https://doi.org/10.1016/j.jbankfin.2013.07.031
- Brazys, S., & Regan, A. (2017). The politics of capitalist diversity in Europe: explaining Ireland's divergent recovery from the Euro Crisis. Perspectives on Politics, 15 (2), 411–427.
- Crouch, C. (2009). Privatised keynesianism: An unacknowledged policy regime. The British Journal of Politics and International Relations, 11 (3), 382–399. https://doi.org/10.1111/j.1467-856X.2009.00377.x
- Delong, J. B., & Summers, L. H. (2012). Fiscal policy in a depressed economy. Brookings Papers on Economic Activity, 2012 (1), 233–297. https://doi.org/10.1353/eca.2012.0000
- Fatás, A., & Summers, L. H. (2018). The permanent effects of fiscal consolidations. Journal of International Economics, 112, 238–250. https://doi.org/10.1016/j.jinteco.2017.11.007
- Fontana, G., & Sawyer, M. (2011). Fiscal austerity: Lessons from recent events in the British Isles. Challenge, 54 (2), 42–60. https://doi.org/10.2753/0577-5132540202
- Fuller, G. W. (2015). Who’s Borrowing? Credit encouragement vs. credit mitigation in national financial systems. Politics & Society, 43 (2), 241–268. https://doi.org/10.1177/0032329215571288
- Gechert, S., & Rannenberg, A. (2018). Which fiscal multipliers are regime-dependent? A meta-regression analysis. Journal of Economic Surveys, 32 (4), 1160–1182. https://doi.org/10.1111/joes.12241
- Gechert, S., Horn, G., & Paetz, C. (2019). Long‐term effects of fiscal stimulus and Austerity in Europe. Oxford Bulletin of Economics and Statistics, 81 (3), 647–666. https://doi.org/10.1111/obes.12287
- Gräbner, C., Heimberger, P., Kapeller, J., & Schütz, B. (2020). Is the Eurozone disintegrating? Macroeconomic divergence, structural polarisation, trade and fragility. Cambridge Journal of Economics, 44 (3), 647–669. https://doi.org/10.1093/cje/bez059
- Guttmann, R. (2016). Finance-led capitalism. Shadow banking, re-regulation and the future of global markets. Palgrave Macmillan US.
- Hall, P. A. (2014). Varieties of capitalism and the Euro crisis. West European Politics, 37 (6), 1223–1243. https://doi.org/10.1080/01402382.2014.929352
- Hall, P. A. (2018). Varieties of capitalism in light of the euro crisis. Journal of European Public Policy, 25 (1), 7–30. https://doi.org/10.1080/13501763.2017.1310278
- Hassel, A., Palier, B., & Avlijaš, S. (2020). The pursuit of growth. Growth regimes, growth strategies and welfare reforms in advanced capitalist economies. Stato e Mercato, (1), 41–77. https://www.rivisteweb.it https://doi.org/10.1425/97509
- Hausmann, R., Hwang, J., & Rodrik, D. (2007). What you export matters. Journal of Economic Growth, 12 (1), 1–25. https://doi.org/10.1007/s10887-006-9009-4
- Hay, C. (2009). Good inflation, bad inflation: The housing boom, economic growth and the disaggregation of inflationary preferences in the UK and Ireland. The British Journal of Politics and International Relations, 11 (3), 461–478. https://doi.org/10.1111/j.1467-856X.2009.00380.x
- Hay, C., & Smith, N. (2013). The story of a North Sea bubble: The strange demise of the Anglo-liberal growth model in the United Kingdom and Ireland. European Political Science Review, 5 (3), 401–430. https://doi.org/10.1017/S1755773912000185
- Hein, E. (2012). The macroeconomic of finance-dominated capitalism - and its crisis. Edward Elgar.
- Hein, E. (2018). Autonomous government expenditure growth, deficits, debt, and distribution in a neo-Kaleckian growth model. Journal of Post Keynesian Economics, 41 (2), 316–338. https://doi.org/10.1080/01603477.2017.1422389
- Hein, E. (2019). Financialisation and tendencies toward stagnation: The role of macroeconomic regime changes in the course of and after the financial and economic crisis 2007-9. Cambridge Journal of Economics, 43 (4), 975–999. https://doi.org/10.1093/cje/bez022
- Hein, E., Meloni, W. P., & Tridico, P. (2020). Welfare models and demand-led growth regimes before and after the financial and economic crisis. Review of International Political Economy, 1–36. https://doi.org/10.1080/09692290.2020.1744178
- Hidalgo, C. A., & Hausmann, R. (2009). The building blocks of economic complexity. Proceedings of the National Academy of Sciences of the United States of America, 106 (26), 10570–10575. https://doi.org/10.1073/pnas.0900943106
- Hope, D., & Soskice, D. (2016). Growth models, varieties of capitalism, and macroeconomics. Politics & Society, 44 (2), 209–226. https://doi.org/10.1177/0032329216638054
- Iversen, T., Soskice, D., & Hope, D. (2016). The Eurozone and political economic institutions. Annual Review of Political Science, 19 (1), 163–185. https://doi.org/10.1146/annurev-polisci-022615-113243
- Johnston, A., & Regan, A. (2016). European monetary integration and the incompatibility of national varieties of capitalism. Jcms: Journal of Common Market Studies, 54 (2), 318–336. https://doi.org/10.1111/jcms.12289
- Johnston, A., & Regan, A. (2018). Introduction: Is the European Union capable of integrating diverse models of Capitalism? New Political Economy, 23 (2), 145–159. https://doi.org/10.1080/13563467.2017.1370442
- Johnston, A., Hancké, B., & Pant, S. (2014). Comparative institutional advantage in the European sovereign Debt Crisis. Comparative Political Studies, 47 (13), 1771–1800. https://doi.org/10.1177/0010414013516917
- Lavery, S. (2018). The Legitimation of Post-crisis Capitalism in the United Kingdom: Real Wage Decline, Finance-led Growth and the State. New Political Economy, 23 (1), 27–45. https://doi.org/10.1080/13563467.2017.1321627
- Lavoie, M. (2014). Post-keynesian economics: New foundations. Edward Elgar.
- Matthijs, M. (2020). Hegemonic leadership is what states make of it: Reading Kindleberger in Washington and Berlin. Review of International Political Economy, 1–28. https://doi.org/10.1080/09692290.2020.1813789
- Minsky, H. P. (2016). The financial instability hypothesis: A restatement. In Can ‘It’ happen again? Essays on instability and finance. Routledge.
- Palley, T. I. (2011). A theory of Minsky super-cycles and financial crises. Contributions to Political Economy, 30 (1), 31–46. https://doi.org/10.1093/cpe/bzr004
- Perez, S. A., & Matsaganis, M. (2018). The political economy of austerity in southern Europe. New Political Economy, 23 (2), 192–207. https://doi.org/10.1080/13563467.2017.1370445
- Perez, S. A., & Matsaganis, M. (2019). Export or Perish: Can internal devaluation create enough good jobs in southern Europe? South European Society and Politics, 24 (2), 259–285. https://doi.org/10.1080/13608746.2019.1644813
- Reinhart, C. M., & Rogoff, K. S. (2010). Growth in a time of debt. American Economic Review, 100 (2), 573–578. https://doi.org/10.1257/aer.100.2.573
- Ryoo, S. (2016). Household debt and housing bubbles: A Minskian approach to boom-bust cycles. Journal of Evolutionary Economics, 26 (5), 971–1006. https://doi.org/10.1007/s00191-016-0473-5
- Schwartz, H. M. (2008). Housing, Global Finance, and American Hegemony: Building Conservative Politics One Brick at a Time. Comparative European Politics, 6 (3), 262–284. https://doi.org/10.1057/cep.2008.11
- Schwartz, H. M., & Tranøy, B. S. (2019). Thinking about Thinking about Comparative Political Economy: From Macro to Micro and Back. Politics & Society, 47 (1), 23–54. https://doi.org/10.1177/0032329218796197
- Simonazzi, A., Ginzburg, A., & Nocella, G. (2013). Economic relations between Germany and southern Europe. Cambridge Journal of Economics, 37 (3), 653–675. https://doi.org/10.1093/cje/bet010
- Sorge, A., & Streeck, W. (1988). Industrial relations and technical change: The case for an extended perspective. In W. Streeck and R. Hyman (Eds.), New Technology and Industrial Relations (pp. 19–44). Blackwell.
- Stockhammer, E. (2016). Neoliberal growth models, monetary union and the Euro crisis. A post-Keynesian perspective. New Political Economy, 21 (4), 365–379. https://doi.org/10.1080/13563467.2016.1115826
- Stockhammer, E. (2021). Post-Keynesian macroeconomic foundations for Comparative Political Economy. Politics & Society, forthcoming.
- Stockhammer, E., & Wildauer, R. (2016). Debt-driven growth? Wealth, distribution and demand in OECD countries. Cambridge Journal of Economics, 40 (6), 1609–1634. https://doi.org/10.1093/cje/bev070
- Stockhammer, E., Durand, C., & List, L. (2016). European growth models and working class restructuring: An International post-Keynesian Political Economy perspective. Environment and Planning A: Economy and Space, 48 (9), 1804–1828. https://doi.org/10.1177/0308518X16646373
- Stockhammer, E., Qazizada, W., & Gechert, S. (2019). Demand effects of fiscal policy since 2008. Review of Keynesian Economics, 7 (1), 57–74. https://doi.org/10.4337/roke.2019.01.05
- Storm, S., & Naastepad, C. W. M. (2016). Myths, Mix-ups, and Mishandlings: Understanding the Eurozone Crisis. International Journal of Political Economy, 45 (1), 46–71. https://doi.org/10.1080/08911916.2016.1159084
- Truger, A. (2013). Austerity in the euro area: The sad state of economic policy in Germany and the EU. European Journal of Economics and Economic Policies: Intervention, 10 (2), 158–174. https://doi.org/10.4337/ejeep.2013.02.02
- Vermeiren, M. (2017). One-size-fits-some! Capitalist diversity, sectoral interests and monetary policy in the euro area. Review of International Political Economy, 24(6), 929–957. https://doi.org/10.1080/09692290.2017.1377628