Abstract
This study aimed to characterise and compare the thermophysiological adaptation of goats and camels to water deprivation under hot environmental conditions. A total of five male Aardi goats (25±3.2 kg BW; 10±2 months old) as well as five male Majaheem camels (340±16.6 kg; 22±2 months old) were used in this study. This study was performed during summer season and lasted for 6 weeks. During the De-hydration period, water was withheld for 72 hours. The results revealed that core body temperature (T c) of both species had monophasic circadian rhythms with a rhythm's oscillation of 0.67°C in goats and 0.45°C in camels during the Eu-hydration period. Water deprivation accompanied with heat stress affected the circadian rhythm of T c in both species, but the effect was delayed in camels compared to goats. In addition, camels exhibited smaller oscillation of T c rhythm (0.98oC) than goats (1.53oC), which might indicate a better thermoregulatory system of camels. Water deprivation for 72 hours increased most of the measured haematological and biochemical parameters in both species, but camels exhibited smaller percentage changes compared to goats. These results demonstrate the greater capability of camels, compared to goats, to tolerate water deprivation under hot environmental conditions.
Introduction
Extended periods of high temperature and drought that last for more than 6 months with erratic precipitation and brief eruption of feeding forages are clearly describe climate of any arid environment. Goats and camels are suitable desert animals that can inhabit such harsh conditions. Based on the fact that metabolic heat production scales with body mass (McNab Citation1983); camels would have smaller surface area to volume ratio compared to goats. As a result, camels may face more physiological challenges to prevent hyperthermia due to the small effective surface area available for heat dissipation in comparison with goats.
Thermophysiological mechanisms that enabled desert animals to cope with water deprivation are well documented (Al-Haidary Citation2005, Citation2006; Alamer Citation2006; Al-Tamimi Citation2007; Abdoun et al. Citation2010). Generally, they resorted to reduce their water loss and thermogenic mechanisms and to recruit their water conservation and thermolytic mechanisms. Thereby, noticeable changes can be observed in their body temperature and biophysiological responses. Therefore, the current study was designed to describe and compare the circadian rhythm of T c in goats and camels subjected to water deprivation under heat stress conditions, and to estimate the combined effect of water deprivation and heat stress on some haematological and biochemical parameters, which may explain the adaptation characteristics to water deprivation under hot environment.
Materials and methods
Animals, management and experimental design
Current study was conducted during summer season (July/August) at the Experimental Station affiliated to the Department of Animal Production, College of Food and Agriculture Sciences, King Saud University. A total of five male Aardi goats (Capra aegagrus hircus), with mean body weight of 25±3.2 kg and 10±2 months old, in addition to five male Majaheem camels (Camelus dromedarius), with mean body weight of 340±16.6 kg and 22±2 month of age were used in this study. Animals were individually housed under shaded pens, and fed twice a day (07:00h and 16:00h) at 3% of their body weights. Goats were offered a commercial mix formulated diet (Al-WAFI, ARASCO, KSA) containing 130 g crude protein and 100 g crude fibre/kg feed, while camels were given a mixture of ad libitum hay in addition to commercial concentrate (160 g crude protein/kg feed). Animals feed intake was determined daily before fresh meals were introduced in the morning by weighting the residues of previous day. Except during water deprivation period, water was offered ad libitum.
The present study was lasted for 6 weeks; the first 4 weeks served as a preliminary period during which animals were surgically implanted with telemetric temperature transmitters and their incisions were healed. Measurements of T c and other physiological parameters were conducted during the 72 hours of Eu-hydration period in the fifth week, consecutively followed by 72 hours of De-hydration period in the sixth week. It is worth to note that no apparent discomfort of animals was observed during De-hydration periods. Study design in addition to handling and restraining of camels were pre-approved by the faculty ethics committee, King Saud University.
Meteorological measurements
Ambient temperature (T a) and relative humidity (RH) were recorded continuously at 30 min interval using two data loggers (HOBO Pro Series data logger, Model H08-032-08, ONSET Co., USA) mounted at a height of approximately 2 m from the ground, and placed away from direct sources of heat, sunlight and water. Special data logging software (BoxCar Pro 4, ONSET Co., USA) was applied for programming the loggers and for data analysis. Temperature-humidity index (THI) was calculated, thereafter, to estimate the environmental severity on the animals using the equation [THI = T a – [(0.55 – 0.55x RH).(T a – 58)]] adapted from West (Citation1994), where T a is the ambient temperature in °F and RH is the relative humidity in%.
Surgical implantation of radio telemetry system
Calibrated telemetric temperature transmitters (MiniMitter Co. Inc.; Model VHF-T-1; Sun River, OR, USA) with a dimension of 20×30×70 mm and a weight of 90 g were used for monitoring animal's T c at 30 minutes intervals throughout the study. Prior to calibration, the transmitters were placed in a water bath with a magnetic stirrer and precision thermometer. The transmitters were placed one inch apart to avoid possible signals interference. Temperature calibration coefficients were generated by collecting time interval data from the transmitters at known temperatures. Two different temperature points were required, low and high points. The low temperature was approximately 26oC and the high temperature was 45oC. The whole system was well functioning at the commencement of the study without any disturbances.
The surgical operations were performed by a licensed veterinary doctor. Each animal was surgically implanted intraperitoneally with a temperature transmitter. One day pre-surgery, all transmitters were sterilised with 70% alcohol solution. Each animal had received intramuscular injection of Oxytetracycline (5 mg/kg) and fasted for at least 12 hours pre-surgery. On the surgery day, surgical areas were prepared by shaving the hair in right flank and paralumber regions, and by scrubbing these areas with 0.5% chlorhexidine and then with 70% alcohol. In goats, sedation was conducted by intramuscular injection of xylazine (0.1 mg/kg), and local anaesthesia was conducted via infiltration of 15 ml lidocaine along the surgical incision. Meanwhile, the surgery was performed in camels, after restraining, under only the local anaesthesia of the surgical areas. Right side flank approach was used to implant the transmitters. Surgical incisions of 10–15 cm were made, by vertically traverses the abdominal musculature. One transmitter was placed inside the abdominal cavity, and then the incision was closed. Animals had received intramuscular injection of Oxytetracycline (5 mg/kg) and Flunixin meglumine (2.2 mg/kg) for three consecutive days. During the preliminary period, animals were observed closely by checking their surgical wound, rectal temperature, in addition to their rumen motility. Ten days post-surgery, incisions were healed and sutures were removed.
Haeamatological and biochemical measurements
Blood samples were collected at the morning after 72 h of both Eu- and De-hydration periods. Blood samples were withdrawn from each animal via jugular venipuncture into EDTA tubes for haematological analysis, and into plain tubes for serological analysis. Collected samples were placed inside an ice box and transferred to the laboratory. Within 1 h after collection, samples were analysed for packed cell volume (PCV). The serum was prepared by centrifugation of plain tubes at 5°C and 3000 rpm for 10 min. Then, sera were transferred into eppendorf tubes and stored at –20°C until further analysis. Serum concentrations of total protein, albumin, sodium (Na+), potassium (K+), calcium (Ca++) and glucose were determined using commercial kits (United Diagnostics Industry, Dammam, KSA). Serum globulin level were calculated as the difference between measured total protein and albumin concentrations. Serum osmolality was estimated using an Osmometer (Vapor Pressure Osmometer 5520, Wescor, Logan UT, USA).
Statistical analysis
Study data were analysed using Proc GLM; the general linear models procedure for analysis of variance (ANOVA) of the Statistical Analysis System (SAS Citation2002). Completely randomised design was utilised to analyse study data. The statistical model included the influence of study animals, treatments, days in addition to all possible interactions. Statistical means were compared, thereafter, using Duncan's multiple range tests. Overall level for statistical significance was set at P<0.05. All values were expressed as statistical means±standard error (SEM) of the means, unless otherwise specified. Animal T c data were analysed for the following rhythm's parameters: mesor (mean level or midline estimating statistic of rhythm), zenith (rhythm's maximum value), nadir (rhythm's minimum value), acrophase (time of the rhythm's zenith), trough (time of the rhythm's nadir), amplitude (the difference between rhythm's zenith and mesor values) and range of oscillation (the difference between rhythm's zenith and nadir values) in a 24 h interval period.
Results
Meteorological measurements
Daily means of T a, RH and THI during the study were 38.23°C±0.16 (SD), 10.45%±0.21(SD) and 79.74°C±0.22 (SD), respectively. According to overall mean of THI, animals were under heat stress conditions (West Citation1994). Moreover, overall mean of T a exhibited a monophasic circadian rhythm with minimum values recorded early at the morning (04:00–05:00 h), then gradually increased to reach their maximum values at middle of the day (13:00–14:00 h). Meanwhile, overall mean of RH had showed the reverse trend.
Circadian rhythm of Tc
The overall means of 30 min interval daily recorded T c rhythms of 72 hours euhydrated and 72 hours dehydrated goats and camels are plotted in . During the Eu-hydration period, T c of both species had distinguished monophasic circadian rhythms attaining minimum values early in the morning (05:00–06:00 h) and maximum values at end of the day (16:00–19:00 h). Further analysis of T c circadian rhythm for both species is presented in . Across all individuals, statistical analysis showed that T c rhythm of the euhydrated animals had a rhythm's minimum value occurred at 05:00–06:00 h in both species. However, the rhythm's maximum had occurred earlier in camels (16:00–17:00 h) compared to goats (18:00–19:00 h). In addition, goats exhibited larger daily oscillation of T c rhythm (1.53oC) than camels (0.98oC) ().
Figure 1. The overall means (solid lines) and standard errors (spotted lines) of 30 min interval daily recorded core body temperature (°C) circadian rhythm of water deprived goats (A) and camels (B).
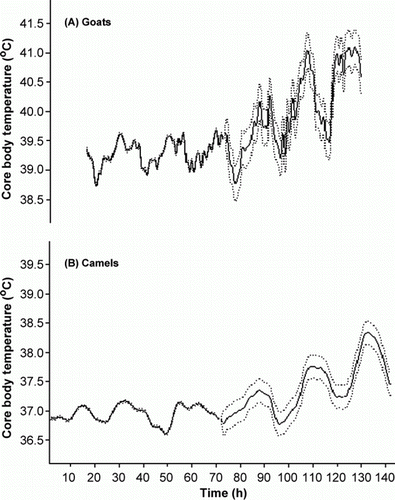
The combined effect of water deprivation during exposure to heat stress had affected T c of both species (; ). Overall mean, maximum, minimum, and oscillation range of T c had significantly (P<0.05) increased in both species. This effect was insignificant during the first 12 and 24 hours following water deprivation in goats and camels, respectively (). However, from 20 to 32 hours onward T c was significantly increased in goats and camels, respectively. Water deprivation also caused a forward shift in the occurrence time of T c maximum values to 19:00–20:00 h and 17:00–18:00 h in goats and camels, respectively. Meanwhile, a backward shift in the occurrence time of T c minimum values to 04:00–05:00h was occurred only in T c of water-deprived camels (). Furthermore, the oscillation range of T c was increased during the De-hydration period by 0.86 and 0.53°C in goats and camels, respectively ().
Table 1. Characteristics of the core body temperature (T c) circadian rhythm of water-deprived goats and camels (Mean±SEM).
Physiological measurements
Water deprivation for 72 hours resulted in a significant (P<0.05) decrease in overall means of daily feed intake starting from the first 24 hours. Feed intake was completely ceased after 48 and 72 hours of water deprivation in goats and camels, respectively. In both species, the corresponding reduction in daily feed intake was estimated to be 80% of their Eu-hydration level.
shows the effect of 72 hours water deprivation on some haematological and biochemical parameters in both species. Dehydration in goats significantly (P<0.05) increased overall means of PCV in addition to serum osmolality (69%) and serum concentrations of Na+, K+, total protein, albumin, globulin and glucose, whereas serum Ca++ concentration was significantly (P<0.05) decreased (). In camels, overall means of PCV, serum osmolality and serum concentration of Na+, total protein and albumin were significantly (P<0.05) increased, whereas overall mean of serum glucose concentration was significantly (P<0.05) decreased due to water deprivation (). Furthermore, serum K+ concentration was insignificantly increased, while serum globulin and Ca++ concentrations were insignificantly decreased ().
Table 2. Effects of water deprivation on some haematological and biochemical parameters in goats and camels (Mean±SEM).
Discussion
Desert animals were documented to be thermally adapted and can tolerate several days of water deprivation in their natural habitat. This conclusion was based on the finding that these animals had similar changes in their body weight and blood haematology after 3–4 days (in goats) and 7–10 days (in camels) of water deprivation during different seasons (Ayoub and Saleh Citation1998; Al-Haidary Citation2005, Citation2006). Moreover, these animals were able to lower their feed intake, urine volume and faeces water content (Pesce and Pesce Citation1984; Alamer Citation2006), and were able to elevate their body temperature indicating their thermolabile capability (El-Nouty et al. Citation1989; Al-Haidary Citation2005).
The presented results revealed the presence of a clear circadian rhythm of T c in euhydrated goats and camels maintained under natural environmental heat stress condition. West (Citation1994) classified THI values for dairy cattle as follow; up to 74 as ‘normal’, from 75 to 78 as ‘alert’, from 79 to 83 as ‘danger’, 84 and more as ‘emergency’. Calculated THI mean values showed that animals used in the present study were in the ‘danger’ area. However, as far as we know, no THI index has been addressed for camels and there is no study we are aware of describing the actual or the conservative thermoneutral zone for any kind of camelidea species. Thus, it is possible at this point to state that both species used in this study were under heat stress conditions.
A distinct rhythm of body temperature has been reported in cattle, sheep and goats (Al-Haidary Citation2000). Temperature rhythms are basically classified as monophasic, diphasic or polyphasic (Refinetti and Piccione Citation2005). Results obtained during the Eu-hydration period revealed that T c circadian rhythms of both species are best described as monophasic; attaining their minimum values (38.93°C in goats and 36.71°C in camels) at the early morning (05:00–06:00 h) and their maximum values (39.59°C in goats and 37.08°C in camels) at end of the day (16:00–19:00 h), with a daily oscillation range of 0.67 and 0.45°C for goats and camels, respectively. It indicates that these animals would be in a ‘heat gain’ mode when their T c rising in the morning, and in a ‘heat loss’ mode at the evening when their T c is falling. Moreover, the mesor values of camels T c rhythm (36.95±0.02°C) were low compared with goats (39.29±0.03°C). Nevertheless, these values fell within the range of temperatures measured in earlier studies on the body (rectal) temperatures of goats (El-Nouty et al. Citation1990; Torrao et al. Citation2011) and camels (Ayoub and Saleh Citation1998; Al-Haidary Citation2005, Citation2006). The fact that the large terrestrial mammals inhabit arid and semi-arid environment had consistently a lower average mesor values as a way of adaptation to the thermal constraints of their large body size seems to support this notion (Kinahan et al. Citation2007). Furthermore, Aschoff (Citation1982) suggested that larger mammals should have lower rhythm's oscillation than smaller mammals due to their high body thermal inertia. Notably, the measured overall mean of camels T c rhythm's oscillation are actually lower than those measured in goats.
The combined effects of water deprivation and heat stress affected the circadian rhythm of T c in both species, but the effect was delayed in camels compared to goats (). Moreover, camels exhibited smaller oscillation of T c rhythm than goats (0.98°C vs. 1.53°C) after 72 hours of water deprivation, which might indicate a better thermoregulatory system of camels. Schmidt-Nielsen et al. (Citation1957) showed that camels are not a strict homeothermic animal since their circadian body (rectal) temperatures could vary by 2–3°C in euhydrated animals and by 6°C when dehydrated. The presented results demonstrate a circadian variation of 0.45°C in the T c of euhydrated and heat stressed dromedary camels with a rise to 0.98°C when dehydrated. These results indicate that camels, similar to other farm animals, are homoeothermic animals that can maintain a near constant body temperature under their natural environmental conditions. Nevertheless, allowing T c to increase indicates that both species are thermolabile.
In ruminants, the progress of dehydration was divided into two phases (Maloiy et al. Citation2008). During phase I, feed intake and salivation are still high enough to allow normal fermentation in the rumen, while feed intake, salivation and rumen content were fall severely within phase II. In the current study, an extreme decrease in daily feed intake was recorded from the first day of dehydration in both species, and completely ceased at 48 and 60 hours of water deprivation in goats and camels, respectively. Thereby, appearance of phase II was delayed in camels compared to goats. Camels might utilise most of the water left in their rumen, which could enable them to stand longer than goats.
Haematological and biochemical analysis of blood are indispensable tools in water deprivation studies. Variable responses were observed between goats and camels in the determined parameters due to water deprivation. However, our results generally confirm the earlier reports on goats (Alamer Citation2006; Mengistu et al. Citation2006) and on camels (Ayoub and Saleh Citation1998; Al-Haidary Citation2005). Serum hyperproteinemia is largely contributes in the maintenance of blood volume by inducing water movement into the vascular system (Alamer Citation2006). The observed hyperalbuminemia could indicate an adjustable mechanism to maintain blood hydrostatic pressure in both species. This response is mainly attributed to blood hemoconcentration (Ayoub and Saleh Citation1998). However, since no measurement was made for the serum volume, it is not possible at this point to determine whether these increases were due to hemoconcentration, or in fact it represented an actual hyperalbuminemia by the liver as an attempt to maintain proper blood volume during dehydration.
Concerning the changes in PCV, it seems that camels were less affected by water deprivation than goats (11% vs. 37%), which could indicate less hemoconcentration in camels. A similar trend was observed in the previous studies on goats (El-Nouty et al. Citation1990) and camels (Al-Haidary Citation2005).
Hyperosmolality during de-hydration was considered to be the major factor that could modulate the homeostatic responses under water deprivation (Abdoun et al. Citation2010). One of the major determinants of serum osmolality is the concentration of serum Na+. As an adaptation response to de-hydration, Renin-Angiotensin-Aldosterone systems are activated (Wittenberg et al. Citation1986; Abdoun et al. Citation2010). Consequently, hypernatremia as well as hypokalemia would be expected (Duncan et al. Citation1994). In the current study, serum osmolality of both species was increased in parallel with the increase in their serum Na+ concentration during the De-hydration period, but with smaller percentage changes in camels (6%) compared with goats (69%). Nevertheless, the observed hyperkalemia in this study contradict the earlier reports. Jaber et al. (Citation2004) recorded a decrease in serum K+ concentration of Awassi sheep when subjected to intermittent watering once every 4 days. Additionally, Aardi goats in particular also exhibited a decrease in serum K+ concentration after 2 days and more after 4 days of water deprivation (El-Nouty et al. Citation1990). The same author returned the reason to deprivation-induced low daily feed intake. In the present study, animals had a significant decrease in their daily feed intake; however, serum hyperkalemia was observed. Thus, this response would be basically attributed to the hyperosmolality, where hypertonicity can produce a shift in K+ status from intracellular to extracellular fluids (Duncan et al. Citation1994).
A significant (P<0.05) hyperglycemia up to 93% was observed in goats, while a significant hypoglycemia by 20% was observed in camels. Serum hypoglycemia during dehydration in camels was most likely a result of the decrease in feed intake in order to reduce the endogenous metabolic heat production, and thereby reduce water required for the evaporative cooling. Despite the fact that both species had showed significant reduction of daily feed intake during dehydration, the observed hyperglycemia in goats might be attributed to an increase in blood levels of corticosteroid and triiodothyronine hormones which are known to stimulate liver gluconeogenesis and glycogenolysis pathways, and consequently increase blood glucose level (Duncan et al. Citation1994). The possibility of mobilisation of body fat reserves in response to increased energy demand associated with higher respiratory rate in Aardi goats is of further interest (Srikandakumar et al. Citation2003).
A state of hypocalcaemia was observed in both goats and camels serum after 72 hours of dehydration (). This is mostly attributable to the drastic decrease in both animals’ daily feed intake. However, the influence of dehydration was intense (P<0.05) in goats (). Under heat stress, small ruminants rely mainly on panting to keep their body temperature within certain limits (Silanikove Citation2000). This mechanism might endanger another homeostatic system, namely the acid–base balance system. Goats are more prone to let their thermoregulatory mechanisms predominate over their homeostatic control of acid–base balance (Olsson et al. Citation1997). Conceptually, this would leads to state of respiratory alkalosis, which is a common cause of hypocalcaemia particularly in ruminants (Duncan et al. Citation1994). This came in concordant with the findings of El-Nouty et al. (Citation1989) in Aardi goats.
Conclusion
This study sheds basic light upon the thermo-physiological adaptation of goats and camels to water deprivation under hot environmental conditions. These conditions affected the T c circadian rhythm of both species, but the effect was delayed in camels compared to goats. Camels exhibited smaller oscillation of T c rhythm than goats, which might indicate a better thermoregulatory system of camels. Water deprivation for 72 hours increased most of the measured haematological and biochemical parameters in both species. However, camels exhibited smaller percentage changes compared to goats. Current results demonstrate the greater capability of camels to tolerate water deprivation under hot environmental conditions compared to goats.
Acknowledgements
This study was supported by the National Plan for Science and Technology (NPST) programme by King Saud University under project number 09-BIO 885-02.
Related Research Data
References
- Abdoun , KA , Alameen , A , Elmagbol , W , Makkawi , T and Al-Haidary , A . 2010 . Effects of hydration status on osmolality and minerals profile of serum and forestomach liquor in dromedary camel (Camelus dromedaries) . Journal of Camel Practice and Research , 17 : 235 – 240 .
- Alamer , M . 2006 . Physiological responses of Saudi Arabia indigenous goats to water deprivation . Small Ruminant Research , 63 : 100 – 109 . doi: 10.1016/j.smallrumres.2005.02.004
- Al-Haidary , AA . 2000 . Effect of heat stress on some thermoregulatory responses of cattle, sheep and goat . Zagazig Veterinary Journal , 1 : 101 – 110 .
- Al-Haidary , AA . 2005 . Effect of dehydration on core body temperature of young Arabian camels (Camelus dromedaries) . Journal of King Saud University (Agricultural Sciences) , 18 : 1 – 7 .
- Al-Haidary , AA . 2006 . Seasonal variation in thermoregulatory and some physiological responses of Arabian camel (Camelus dromedaries) . Journal of the Saudi Society of Agricultural Sciences , 5 : 30 – 41 .
- Al-Tamimi , HJ . 2007 . Thermoregulatory response of goat kids subjected to heat stress . Small Ruminant Research , 7 : 280 – 285 . doi: 10.1016/j.smallrumres.2006.04.013
- Aschoff , J . 1982 . “ The circadian rhythm of body temperature as a function of body size ” . In A comparison for animal physiology , Edited by: Taylor , R , Johanson , K and Bolis , L . 173 – 189 . Cambridge : Cambridge University Press .
- Ayoub MA , Saleh AA. 1998 . A comparative physiological study between camels and goats during water deprivation . Proceedings of the 3rd Annual Meeting for Animal Production under Arid Conditions, Al-Ain, UAE , 2–3 May , 71 – 87 .
- Duncan , JR , Prasse , KW and Mahaffey , EA . 1994 . Veterinary laboratory medicine , 3rd ed , Ames , IO : Iowa State University Press .
- El-Nouty , FD , Al-Haideray , AI and Basmaeil , SM . 1990 . Physiological responses, feed intake, urine volume and serum osmolality of Aardi goats deprived of water during spring and summer . Australian Journal of Animal Science , 3 : 331 – 336 .
- El-Nouty , FD , Alsobayel , AA and Gameil , MH . 1989 . Effects of season and water deprivation on blood cellular and non-cellular components of the Aardi goat . Arab Gulf Journal of Scientific Research , 7 : 27 – 36 .
- Jaber , S , Habre , A , Rawda , M , Barbour , K and Hamadeh , S . 2004 . The effect of water restriction on certain physiological parameters in Awassi sheep . Small Ruminant Research , 54 : 115 – 120 . doi: 10.1016/j.smallrumres.2003.11.004
- Kinahan , AA , Inge-moller , R , Bateman , PW , Kotze , A and Scantlebury , M . 2007 . Body temperature daily rhythm adaptations in African savanna elephants (Loxodonta africana) . Physiology and Behaviour , 92 : 560 – 565 . doi: 10.1016/j.physbeh.2007.05.001
- Maloiy , GM , Kanui , TI , Towett , PK , Wambugu , SN , Miaron , JO and Wanyoike , MM . 2008 . Effects of dehydration and heat stress on food intake and dry matter digestibility in East African ruminants . Comparative Biochemistry and Physiology-Part A , 151 ( 2 ) : 185 – 190 . doi: 10.1016/j.cbpa.2008.06.019
- McNab , BK . 1983 . Energetics, body size and the limits to endothermy . Journal of Zoology (London) , 199 : 1 – 29 .
- Mengistu , U , Dahlborn , K and Olsson , K . 2006 . Effects of intermittent watering on growth, thermoregulation and behaviour of Ethiopian Somali goat kids . Small Ruminant Research , 72 : 214 – 220 . doi: 10.1016/j.smallrumres.2006.10.012
- Olsson K , Dahlborn K , Benlamlih S , Hossaini-Hilali J . 1997 . Regulation of fluid balance in goats and sheep from dry areas . In : Lindberg JE , Gonda HL , Ledin I , editors. Recent advances in small ruminant nutrition, Proceedings of the seminar of the FAO-CIHEAM Network of Cooperative Research on Sheep and Goats, 24–26 October 1996 , 159 – 171 .
- Pesce , A and Pesce , E . 1984 . Marvel of the desert. The camel in Saudi Arabia , 9 – 53 . Jeddah , , Saudi Arabia : IMMEL Publishing .
- Refinetti , R and Piccione , G . 2005 . Intra- and inter-individual variability in the circadian rhythm of body temperature of rats, squirrels, dogs, and horses . Journal of Thermal Biology , 30 ( 2 ) : 139 – 146 . doi: 10.1016/j.jtherbio.2004.09.003
- SAS . 2002 . SAS user's guide: statistics, version 8 edition . Cary , NC : SAS Institute, Inc .
- Schmidt-Nielsen , KB , Schmidt-Nielsen , SA and Haupt , TR . 1957 . Body temperature of the camel and its relation to water economy . American Journal of Physiology , 188 : 103 – 112 .
- Silanikove , N . 2000 . The physiological basis of adaptation in goats to harsh environments . Small Ruminant Research , 32 : 181 – 193 . doi: 10.1016/S0921-4488(99)00096-6
- Srikandakumar , A , Johnson , H and Mahgoub , O . 2003 . Effect of heat stress on respiratory rate, rectal temperature and blood chemistry in Omani and Australian Merino sheep . Small Ruminant Research , 49 : 193 – 198 . doi: 10.1016/S0921-4488(03)00097-X
- Torrao , NA , Hetem , RS , Meyer , LC and Fick , LG . 2011 . Assessment of the use of temperature-sensitive microchips to determine core body temperature in goats . Veterinary Record , 168 ( 12 ) : 328 doi: 10.1136/vr.c6200
- Wittenberg , C , Choshniak , I , Shkolnik , A , Thurau , K and Rosenfeld , J . 1986 . Effect of dehydration and rapid rehydration on renal function and plasma renin and aldosterone levels in the black Bedouin goat . Pflugers Arch , 406 : 405 – 408 . doi: 10.1007/BF00590944
- West JW. 1994 . Managing and feeding lactating dairy cows in hot weather . In : Management of dairy cattle in hot and humid weather . St. Louis , MO : Monsanto Company .