
Abstract
The leptin gene could be considered as a hotspot gene. Its role in meat and milk production makes it a candidate for the search of molecular markers related to meat production and meat quality in goats. Leptin gene polymorphism has not been thoroughly studied in Indian goat breeds. Thus for the first time, we report complete gene sequence, its variation including single nucleotide polymorphism (SNPs) in indigenous goats. In the present study, we discovered seven novel SNPs which were never reported previously by direct sequencing of gene in a panel of seven goat breeds differing in phenotype (weight and size) and geographical distribution. Whole leptin gene sequence of 4.8 kb of indigenous goat has been submitted in NCBI database (accession number GU944974). Bioinformatics analysis of the genomic sequences identified a total of 22 variations as compared to exotic goat (AM 114397.2) of which seven were SNPs. These novel SNPs were found in Exon 2 (g.1029T > C), Intron 2 (g.1621G > A) and 3′UTR (g.3968T > C, g.3971C > T, g.4026G > A, g.4105G > A and g.4225T > C). These leptin gene variants can be screened in the larger goat population for association studies with meat quality traits and marker-assisted selection.
Introduction
Goat as a source of meat is highly popular in developing countries like India. Goat plays a major role in the livelihoods of Indian farmers by providing food security as well as source of income to poor people. Improvement of economically important traits of goat directly influences these farmers. Goat meat, being a high-quality protein source, is the choicest meat in the domestic market. It is leaner than other red meats and the fat has desirable fatty acids (Kumar Citation2007). Thus, the production of goat exhibiting superior meat quality is a foremost aim of goat breeders in India. Although genes affecting polygenic traits such as carcass and meat qualities are unknown in goat, a number of potential candidate genes have been identified and selected on the basis of known relationships between physiological or biochemical processes and economically important traits of cattle.
The versatile hormone leptin is one of the key factors regulating meat quality traits. Numerous studies show close relationships between leptin gene polymorphisms and carcass and meat quality traits of beef cattle (Buchanan et al. Citation2002). Leptin Single Nucleotide Polymorphisms (SNPs) in cattle have been significantly associated with serum leptin concentration as well as with backfat thickness, marbling score and live and hot weight at slaughter (Nkrumah et al. Citation2005). Chung et al. (Citation2008) have also shown a close relationship between leptin gene polymorphisms and carcass and meat quality trait of Korean beef cattle. In fact, markers in the leptin gene are already part of commercial genotyping panels designated for Marker-Assisted Selection (MAS) in beef cattle. Barzehkar et al. (Citation2009) have reported associations of A113G polymorphism in leptin gene with marbling in Iranian sheep.
In spite of these observations on leptin gene effects, similar studies in goat are lacking. Thus the present study was conducted to identify SNPs in the complete leptin gene, as a first step for initiating a breeding programme based on molecular MAS for improvement in goat meat production as well as quality.
Materials and methods
Sample collection
Animals belonging to seven breeds of Indian goat (Barbari, Beetal, Ganjam, Black-Bengal, Sirohi, Osmanabadi and Malabari) from different geographic and agro-climatic parts of country, which differs in weight and size were sampled for this study (, ). Six unrelated animals per breed were selected at random by picking up only two samples per herd per village. Blood samples were collected from jugular veins into vacutainer tubes containing EDTA (B.D. Bioscience, Germany).
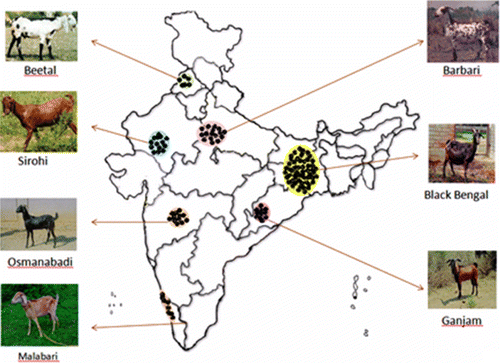
Table 1. Distribution and physical characteristics of selected Indian goat breeds.
DNA isolation and amplification
DNA was isolated from blood samples following standard procedures (Sambrook et al. Citation1989). PCR was carried out in a total volume of 25 µl containing about 50–100 ng genomic DNA using iCycler thermocylcer (Biorad USA). The reaction mixture consisted of 200 µM of each dNTPs, 1.5 mM MgCl2, 50 pmol primer, 0.5 U Taq polymerase (Bangalore Genei Pvt Ltd., Bangalore, India) and Taq buffer. The PCR reaction cycle was accomplished by denaturation for 1 min at 94°C, 30 cycles of ‘94°C for 1 min, precise annealing temperature of primer for 1 min, 72°C for 1 min’ and finally extension at 72°C for 5 min. The PCR product was checked on 1.8% agarose gel, enzymatically purified and sequenced by ABI-3100 Automated DNA Sequencer (Applied Biosystems, USA).
Sequence analysis and SNP identification
Thirteen overlapping primer sets were designed () covering the whole bovine leptin gene (AM 114397.2) using PRIMERSELECT programme of LASERGENE software (DNASTAR, Inc., Madison, WI, USA). The full gene was PCR amplified and directly sequenced. A possible nucleotide change in transcription factor binding site was studied using MATCH software (Kel et al. Citation2003). Sequence variants were verified by chromatograms. Nucleotide sequence of complete leptin gene (4842 bp) in Indian goat (Sirohi) was submitted to NCBI GenBank (GU944974). Multiple sequence alignments for 42 sequences of seven Indian goat breeds were performed with MegAlign programme to identify SNPs. Cluster analysis of Indian goat leptin sequence with other species was performed following Neighbour-Joining procedure using CLC Free Workbench software. The BLAST algorithm was used to search the NCBI GenBank (http://www.ncbi.nlm.nih.gov) databases for homologous sequences. The coding DNA sequences of exonic regions were translated to amino acid sequences using EDITSEQ programme of LASERGENE software.
Table 2. Primers designed for sequencing and SNPs identification in indigenous goat leptin gene.
Results and discussion
The sequenced leptin gene in Indian goat is of 4842 bp. It consisted of 913 bp of 5′UTR, two exons (exon 2 and 3) with corresponding intron and 1587 bp of 3′UTR. Analysis of 42 sequences of 7 Indian goat breeds revealed 22 variations as compared to sequence from Garganica goat of Italy (AM 114397.2) of which seven were SNPs, which were distributed throughout the leptin gene (). One SNP each was located in exon 2 and intron 2, whereas five SNPs were observed in 3′UTR. Rate of transitions (47.6%) was higher than transversions (42.8%). Information on the possible mutations in the promoter region of the leptin gene can be useful to elucidate the regulatory mechanisms of this gene, which affects body fat mass, fat deposition and adiposity of livestock. Thus promoter region may be one of the potential sites that control carcass traits or the gene may be linked to some quantitative trait loci (QTL) that affect carcass traits in Indian goat populations. This region had six variations compared to exotic goat which may alter the function of 5′UTR. Several putative transcription factor binding sites (TFBSs) identified in 5′UTR are Evi-1(Ecotropic Viral Integration Site 1), Nkx2-5 (an autoimmune regulator), v-myb (viral transcriptional regulator) and Pax-4 (diabetes linked transcription factor) with MATCH online tool (http://www.gene-regulation.com/pub/programs.html#match). However, none of the observed variations affected these TFBSs. Stachowiak et al. (Citation2007) reported four novel polymorphisms, changing TFBSs in 245 bp fragment of the promoter in pig. However, no such polymorphic site was detected in 5′UTR, which is highly conserved in Indian goats.
Table 3. Variations in leptin gene in Indian goat breeds compared with exotic goat. The shaded regions indicate the identified SNPs.
Eight variations including six transversions, single transition and a deletion were recorded in the intronic region. Deletion of thymine at g.1418 resulted in decreased nucleotide length of intron 2 of leptin gene in Indian goats. In contrast, exonic region (145 bp) differed from exotic goat at single nucleotide position in exon 2 of Beetal and Malabari goat populations. It is important to report here that no variation was found in exon 3 of this gene. On the contrary, seven novel variations in 3′UTR were observed of which five were SNPs.
Seven novel SNPs were identified and among these, only one was in exonic region (exon 2). This non-synonymous (g.1029 T > C) mutation changed amino acid (Val > Ala) at position 39 of 48 amino acid conceptualised protein sequence. It was a conserved substitution as both amino acids had non-polar aliphatic R-group. In all the goat breeds tested, the TT genotype was predominant. CT genotype was observed only in Beetal and Malabari goat breeds with heterozygote frequency of 0.33, whereas Barbari, Ganjam, Sirohi, Black Bengal and Osmanabadi were monomorphic with presence of only T allele. Caprine exon 2 presumably revealed recent polymorphism with genotype frequency of 0.9 for TT and 0.1 for TC, with allele frequency of 0.95 for T allele and 0.05 for C allele.
Majority of the observed SNPs (6) were in the non-coding region of leptin gene. Non-coding DNA sequences are important for regulatory functions. Single SNP has been identified in the intronic region, and 780 bp downstream from the start sequence (). However, this SNP should not affect the splicing process, as potential splicing sites do not extend more than 20–30 bases into the intron (Garrigan & Edwards Citation1999). Several SNPs have been previously reported in introns and exons of the leptin gene among different breeds of cattle (Schenkel et al. Citation2005). Associations of polymorphisms in leptin with carcass and meat quality traits were also reported in Iranian sheep (Barzehkar et al. Citation2009) and exon 3 of pigs (Amills et al. Citation2007). Our results prove the presence of single polymorphic site in exon 2 and intron 2 each, different from the SNP reported by Singh et al. (Citation2009). Thus these SNPs can act as potential markers for association with meat quality traits in Indian goats. Five unique SNPs in 3′UTR of indigenous goat may be equally important because 3′UTR plays a pivotal role in the regulation of mRNA 3′end formation, stability/degradation, nuclear export, subcellular localization, etc. (Liu et al. Citation2011), and thus is particularly rich in cis-acting regulatory elements (Kubiac et al. Citation2010). It is possible that SNPs identified in the present study may influence these processes thereby resulting in altered functions. Two of the seven SNPs (g3968T > C and g4105G > A in 3′UTR) of leptin gene were associated with all three genotypes, that is, both the homozygotes and heterozygotes in Indian goats. The remaining five SNPs exhibited only two genotypes, one homozygote and one heterozygote. Genotype frequency of homozygotes was always higher than that of heterozygotes. Furthermore, mutant allele frequency was less than the wild type at all polymorphic sites except g1621G > A.
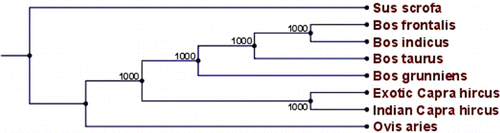
The coding region of the leptin gene showed more or less global similarity (~100%) with exotic goat and bovine sequences, instead of non-coding regions, which differed by 1% with its complementary exotic goat and 5% with bovine sequence. Both UTR regions (2500 bp) shared about 94% nucleotide identity with the bovine leptin gene. The BLAST result revealed that caprine leptin gene shows homology of 99% with exotic goat, 97% with Ovis aries, 95% with Bos taurus, Bos grunniens, Bos frontalis and 81% with Sus scrofa. A phylogenetic tree, constructed based on bootstrap method, using leptin gene, revealed the clustering of large and small ruminants on different node (), while the tree showed that caprine leptin is nearest to the ovine and pig formed an altogether different node.
Conclusion
This is the first study in Indian goat reporting variations and SNPs in the whole leptin gene (4842 bp) after complete sequencing (accession number GU944974). The present investigation resulted in the identification of seven novel SNPs in the leptin gene which might explain a portion of the variation of meat quality and tenderness in Indian goat population. Considering the economic importance of the meat quality trait to the livestock industry, the new leptin polymorphisms described here provide a basis for future rigorous studies of association between leptin genotype and performance.
Acknowledgement
This work was financially supported by the Network Project on Animal Genetic Resources, Indian Council of Agricultural Research (ICAR).
References
- Acharya RM. 1982. Sheep and goat breeds of India. FAO animal production and health paper 30. Rome, Italy: FAO of United Nations.
- Amills M, Villalba D, Tor M, Mercadé A, Gallardo D, Cabrera B, Jiménez N, Noguera JL, Sànchez A, Estany J. 2007. Plasma leptin levels in pigs with different leptin and leptin receptor genotypes. J Anim Breed Genet. 125:228–233. 10.1111/j.1439-0388.2007.00715.x
- Barzehkar R, Salehi A, Mahjoubi F. 2009. Polymorphism of the ovine leptin gene and its association with growth and carcass traits in three Iranian sheep breeds. Iran J Biotechnol. 7:241–246.
- Buchanan FC, Fitzsimmons CJ, Van-Kessel AG, Thue TD, Winkelman-Sim DC, Schmutz SM. 2002. Association of a missense mutation in the bovine leptin gene with carcass fat content and leptin mRNA levels. Genet Sel Evol. 34:105–116. 10.1186/1297-9686-34-1-105
- Chung ER, Shin SC, Shin KH, Chung KY. 2008. SNP discovery in leptin promoter gene and association with meat quality and carcass traits in Korean cattle. Asian Aust JAnim Sci. 21:1689–1695.
- Garrigan D, Edwards SV. 1999. Polymorphism across an exon-intron boundary in an avian mhc class II B gene. Mol Biol Evol. 16:1599–1606. 10.1093/oxfordjournals.molbev.a026072
- Kel AE, Gobling E, Reuter I, Cheremushkin E, Kel-Margoulis OV, Wingender E. 2003. MATCH. A tool for searching transcription factor binding sites in DNA sequences. Nucleic Acids Res. 31:3576–3579. 10.1093/nar/gkg585
- Kubiac EJ, Flisikowski K, Wicinska K. 2010. A new SNP in the 3′UTR region of the bovine calpain small subunit CAPNS1 gene. Mol Biol Rep. 37:473–476. 10.1007/s11033-009-9654-8
- Kumar S. 2007. Commercial goat farming in India: an emerging agri-business opportunity. Agric Econ. 20:503–520.
- Liu D, Hu Y, Yang X, Liu Y, Wei Y. 2011. Identification and genetic effects of a novel polymorphism in the distal promoter region of porcine leptin gene. Mol Biol Rep. 38:2051–2057. 10.1007/s11033-010-0330-9
- Nkrumah JD, Li C, Yu J, Hansen C, Keisler DH, Moore SS. 2005. Polymorphisms in the bovine leptin promoter associated with serum leptin concentration, growth, feed intake, feeding behavior, and measures of carcass merit. J Anim Sci. 83:20–28.
- Sambrook J, Fritsch EF, Maniatis T. 1989. Molecular cloning: a laboratory manual, Cold Spring Harbour, NY: Cold Spring Harbour Lab. Press.
- Schenkel FS, Miller SP, Ye X, Moore SS, Nkrumah JD, Li C, Yu J, Mandell IB, Wilton JW, Williams JL. 2005. Association of single nucleotide polymorphisms in the leptin gene with carcass and meat quality traits of beef cattle. J Anim Sci. 83:2009–2020.
- Singh SK, Rout PK, Agarwal R, Mandal A, Singh SK, Shukla SN, Roy R. 2009. Characterization of exon 2 and intron 2 of leptin gene in Indian goats. Anim Biotechnol. 20:80–85. 10.1080/10495390902823885
- Stachowiak M, Mackowski M, Madeja Z, Szydlowski M, Buszka A, Kaczmarek P, Rubis B, Mackowiak P, Nowak KW, Switonski M. 2007. Polymorphism of the porcine leptin gene promoter and analysis of its association with gene expression and fatness traits. Biochem Genet. 45:245–253. 10.1007/s10528-006-9070-x