
Abstract
An osteometric study was carried out on the skulls of 70 adult female goats belonging to the Rasquera White (Blanca de Rasquera) breed. A total of 38 linear measurements and 11 indices or ratios were analysed. This study provided a statistical insight into skull measurements (neuro- and viscerocranium) for this breed using the bivariate and principal components (PC) techniques. The first two PCs provide a good quantitative approach to their study. A selection of the most relevant measurements was established based on variation, allowing the number of variables to be reduced from 38 to 4. The breed exhibited a fairly low degree of individual variation, but no significant clustering was observed in any of the plots. Evaluation of all quantitative data may also be useful for comparison with other present-day and extinct goat breeds. It is recommended to use a uniform craniometric evaluation system for the assessment of all goat breeds.
1. Introduction
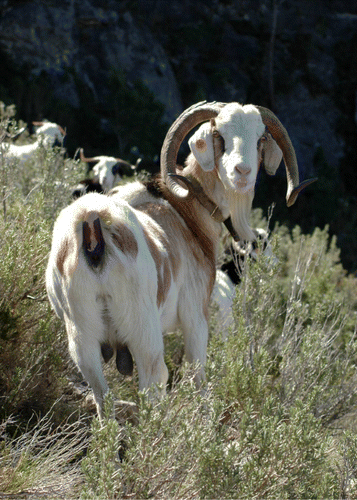
Animal morphology shows considerable variation with respect to breed, age, sex, nutritional condition and environmental factors, among others. Thus, measurements are important tools for comparison. In order to achieve a more objective racial assessment, numerous metrical studies have been carried out (Künzel et al. Citation2003; Brombin et al. Citation2009). Within goat breeds, we virtually find hundreds of breeds which look different and also have different properties in terms of productivity. Using these properties as characteristics, goat breeds can be classified into a number of groups. The shape and appearance of the head are important in determining the nature of an animal (Dyce et al. Citation1996), but only a few morphometric characteristics of the skull have been documented for the goat by Olopade (Citation2003), Olopade and Onwuka (Citation2005, Citation2007), Zvychainaya and Puzachenko (Citation2009) and Morales-delaNuez et al. (Citation2012). These data can be important in anthropology (Bokonyi Citation1974), regional anaesthesiology (Olopade & Onwuka Citation2005), taxonomy, (Habel Citation1982) and comparative anatomical studies between and within breeds (Olopade et al. Citation2006). They are also important for classification, as the phenotypic appearance of an animal's head has been reported to depend on the shape of the skull and is strongly related to breed-specific skeletal features (Künzel et al. Citation2003). In an effort to provide more descriptive data on the skull of goats and to build a discriminant function, we performed morphological studies on the bones of the skull of Rasquera White goats. This breed is a unique autochthonous caprine population located in Catalonia, where it constitutes the easternmost breed of the so-called Celtiberian group. It is a mediolineal, medium-sized breed with mainly a straight profile and a coat which is either solid white or has dominant black spots on a white background (). This goat breed also shows strong sexual dimorphism, as well as remarkable structural variability within genders (Carné et al. Citation2007). The horns' shape is also a characteristic, with the ‘prisca’ and ‘wheel-shaped’ types being the most frequent (Carné et al. Citation2007). While their shape may vary, the horns are always long. Biometric data of morphological, craniometric or orbitometric aspects in this breed are not available. This is partially due to a lack of knowledge about appropriate measuring procedures. The aim of the present study has therefore been to characterise the skull quantitatively by means of standardised parameters. Moreover, the detailed osteometric measurements studied also provide an opportunity to compare present-day goats and archaeological goat remains. This will facilitate a more detailed analysis of the Rasquera White with regard to other breeds.
2. Materials and methods
Seventy dry skulls of adult Rasquera White specimens aged 18 months and older were collected from five different local farms and studied. The age was determined on the basis of the growth of the third molar tooth (Dyce et al. Citation1996). It is worth mentioning that although the specimens came from scattered locations, they had all lived in the same eco-climatic environment. Bearing in mind that the process of skull formation and ossification starts as early as embryogenesis and fully develops during postnatal life (Baranowski et al. Citation2009), with sexual hormones playing an important part, it was decided to examine only the skulls of female goats with varying degrees of phenotypic purity. All specimens used for this study showed no cranial deformities or scars, as the skulls under review were from animals that died of natural causes and were not slaughtered in an abattoir. The total series included all specimens collected. No ethical permission was considered necessary as the materials used were collected post-mortem.
The method described by Von den Driesch (Citation1976) was used for assessing cranial (neuro- and viscerocranium) linear measurements (), as it is commonly used in other osteometric studies (e.g. Onar et al. Citation2005). A total of 38 linear measurements were analysed (). Lower jaws and horns were not included in this study. Basic descriptive statistics were calculated for all samples and no size adjustment was applied. For descriptive purposes, 11 indices or ratios were calculated according to Baranowski et al. (Citation2009), Miller et al. (Citation1964), Miramontes et al. (Citation2010), Parés et al. (Citation2010) and Sarma (Citation2006):
Skull/cephalic index: greatest frontal breadth (34)/total length of the skull (1)×100.
Cranial index (neurocranium index): greatest neurocranium breadth (var. 33)/median frontal length (var. 8)×100.
Area of the foramen magnum: by using the formula ¼ πbh; where b=breadth (var. 29) and h =height (var. 30) of the foramen magnum.
Foramen magnum index: height of the foramen magnum (var. 30)/greatest breadth of the foramen magnum (var. 29)×100.
Orbital index: orbital inner width (var. 24)/orbital inner height (var. 25)×100.
Orbital area: πab; where a and b are the halves of orbital inner width (var. 24) and height (var. 25), respectively.
Facial index: facial width (var. 36)/facial length (var. 12)×100.
Frontal index: least breadth between the orbits (var. 35)/frontal length (var. 10)×100.
Nasal index: greatest breadth across the nasals (var. 37)/greatest length of the nasals (var. 15)×100.
Index 1: euryon-euryon (var. 33)/akrokranion-prosthion (var. 1)×100
Index 2: euryon-euryon (var. 33)/basion-prosthion (var. 3)×100
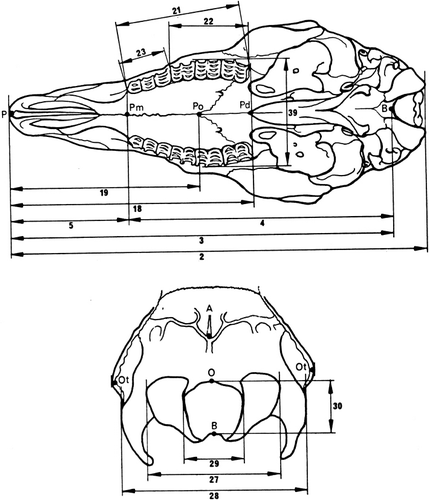
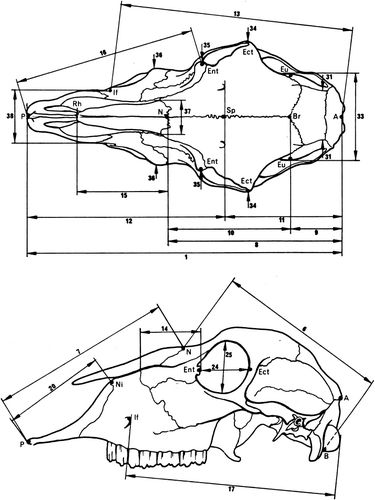
Table 1. Studied parameters (nomenclature according to Von den Driesch 1976).
The purpose of the indices calculated, used as biometric criteria, was to obtain a proper morphological evaluation, while at the same time neutralise the effect of skull size. It also makes it possible to compare the results obtained between animals of different sizes (Baranowski et al. Citation2009). Given the large number of variables, a selection of the most relevant parameters was ultimately made using a multivariate principal components analysis (PCA). The PCs were extracted from the covariance matrix. The number of variables did not exceed the number of observations. The loadings within the individual eigenvectors for each PC were used to form contrasts in order to describe the skulls numerically. Only those with the highest values were retained for this process. In order to search for significant ontogenetic trends or clustering, the two variables with the lowest loading values on the first PC were used to compute a bivariate regression. The measurements were performed using 0.1 mm calipers and all measurements were taken by the authors. The data recorded were subsequently analysed statistically in customary fashion using PAST® (v. 1.94b) software (http://palaeoelectronicaorg/2001_1/past/issue1_01.html).
3. Results and discussion
3.1. Univariate analysis
Mean values, standard deviation, coefficient of variation, maximum and minimum values of all skull parameters and indices recorded in the present investigation on skulls are shown in and All craniometric data were used for statistical calculation.
Table 2. Basic descriptive statistics (linear measurements) (n=70).
Table 3. Basic descriptive statistics (indexes of all samples; n=70).
3.2. Principal component analysis
The PCA axes were calculated for all linear skull measurements (). The first two axes (PC1 and PC2) represent 99.5% of the total observed variations for the sample. Since this value exceeds 80%, the PCA results are interpretable. The PCA scatter diagram is presented in . The plot of PC1 versus PC2 is presented in and the bivariate regression in .
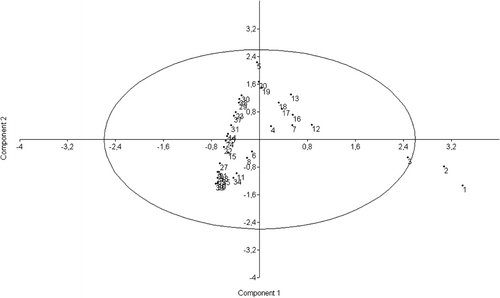
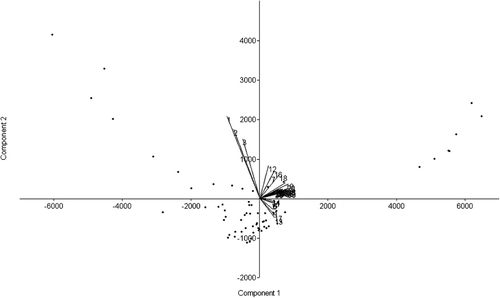
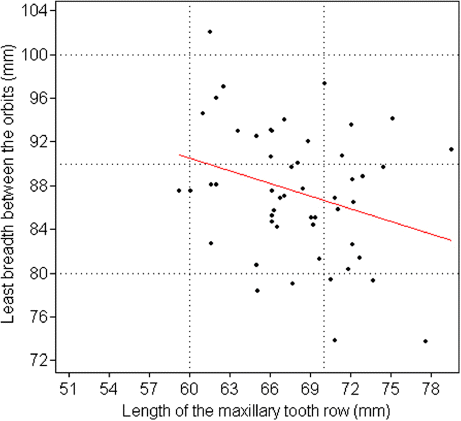
Table 4. Multivariate statistics. The PCA is extracted from the co-variance matrix.
4. Conclusion
The morphological data examined in this study fall within the limits in the literature (Carné et al. Citation2007). Consequently, the data obtained from this material can be considered valid. The breed exhibits fairly low polymorphism (2.3–14.6% of coefficients of variation). The total length of the cranial base (var. 3), premolar-prosthion length (var. 5) and upper length of the viscerocranium (var. 7) revealed the least degree of variation (2.3–2.9% of coefficients of variation). The largest variation (10.0–14.6%) was found in the greatest length of the lacrimal bone (var. 14), length of the premolar row (var. 23), greatest breadth at the bases of the paracondylar processes (var. 28), height of the foramen magnum (var. 30) and greatest breadth across the nasal bones (var. 37). Intermediate variation (3.1–9.3%) was observed in the remaining characteristics. The facial length (153.6±7.22 cm) was longer than the median frontal length (126.2±6.77 cm) and the skull appeared wide but short. The mean length of the skull was found to be 231.7±11.01 cm, with the frontal breadth of the magnitude 86.5±6.46 cm and a relatively high skull/cephalic index (46.2±2.78%). The orbit was slightly almond-shaped (horizontal diameter greater than vertical) and appeared smaller than in the Kagani goat (Sarma Citation2006). The almond-like form of the foramen magnum differs significantly from the circular shape described in other species such as the chinchilla (Baranowski et al. Citation2009), while it was smaller and had a lower area compared to some African caprine breeds, such the Kagani (Sarma Citation2006) and Sahelian (Olopade & Onwuka Citation2007), thus producing a much lower foramen magnum index. Although the boundaries between the skull/cephalic and cranial index as categories were somewhat arbitrary, the breed can be classified as mesocephalic and mesocranial. Distinct patterns are observed in the loadings of the first two PCs (). In PC1, all the loadings are significant and positive, indicating that this component forms a major characteristic as it represents 98.7% of the observed variation. The total length of the skull, condylobasal length and total length of the cranial base (vars. 1, 2 and 3, respectively) differed from the rest of the characteristics. PC2 is primarily defined by premolar-prosthion length (var. 5). It describes an inverse relationship between premolar-prosthion length and the total length of the skull, the condylobasal length. Increasing values of PC2 reflect that the skull mass becomes larger while skull length is constant and muzzle length increases. Another 0.9% of the observed variation can be attributed to this component. Bivariate regression failed to reveal any significant trend. The complete biometric skull analysis in the present study provides new insights into the biological characteristics of the Rasquera White breed. The statistical analysis of Rasquera White goat skulls has established their craniometric values. The breed exhibits a fairly low degree of individual variation and no significant clustering is observed in any of the plots. As the sample size increases, the relations are not expected to change significantly, and the results probably do not support the presence of variation between animals of different farms. As the sample size was not small, the variation can be attributed to systematic differences. The analysis of the skulls of adult male animals would also make it possible to identify parameters of the caprine skull that are subject to sexual dimorphism and may become manifest after the onset of sexual maturity (Brombin et al. Citation2009). These craniometric measurements could also improve our understanding of the visible morphology of goats derived from osteoarchaeological material. Some of parameters studied do not resemble those reported earlier for the breed (Carné et al. Citation2007). Linear parameters and indices as instruments for comparing breeds cannot be used if the points of measurement involved differ from researcher to researcher, as comparable craniometric values should be obtained for all goat breeds. Internationally accepted craniometric dimensions such as those in the study by Von den Driesch (Citation1976) should be used. It should be noted that measurements obtained from live animals can differ from those obtained from skulls, as the external soft tissue of the skull increases the value. Knowledge of caprine populations may be considerably enhanced if data-sets from other Celtiberian breeds would become available. Moreover, as traces of gene flow between goat populations from the Maghreb and the Iberian Peninsula have been identified (Pereira et al. Citation2009), indicating a common origin for goat patrilines in both Mediterranean coastal regions (Pereira et al. Citation2009), a phylogeographic survey including North African breeds would be required. This study would make it possible to augment our current knowledge of goat diversity, although it would be challenging and expensive because certain key regions may also be the most inaccessible. Today, the Rasquera White goat population is around 5500 females and 200 males (Vidilla, pers. com.2010). The breed is therefore facing the risk of extinction in the immediate future. Under such conditions, studies of the breed must rely on the widest choice of methods. Detailed study of the skull offers new insights into the biological characteristics of the breed. Refining methodologies and techniques and further harvesting male skulls will improve the data gathered on this endangered breed.
Acknowledgements
I thank all those farmers from the county who provided osseous material for the study. I also thank Irina Kucherova for her translation of Russian manuscripts into Catalan.
References
- Baranowski P, Wróblewska M, Wojtas J. 2009. Morphology and morphometry of the nuchal plane of breeding chinchilla (Chinchilla laniger, Molina 1782) skulls allowing for sex and litter size at birth. Bull Vet Inst Pulawy. 53:291–298.
- Bokonyi S. 1974. History of domestic mammals in Central and Eastern Europe. Budapest: Akademiai kiado.
- Brombin C, Mo G, Zotti A, Giurisato M, Salmaso L, Cozzi B. 2009. A landmark analysis-based approach to age and sex classification of the skull of the Mediterranen monk seal (Monachus monachus) (Hermann, 1779). Anat Histol Embryol. 38:382–386.10.1111/j.1439-0264.2009.00958.x
- Carné S, Roig N, Jordana J. 2007. La cabra blanca de rasquera. caracterización morfológica y faneróptica. Archivos de Zootecnia [The Blanca De Rasquera goat breed: morphological and phaneroptical characterization]. 56:319–330.
- Von den Driesch A. 1976. A guide to the measurement of animal bones from archaelogical sites. Peabody Mus Bull. 1:1–135.
- Dyce KM, Sack WO, Wensing CJG. 1996. Textbook of veterinary anatomy. Philadelphia: Saunders.
- Guintard C, Fouché S. 2008. Etude ostéométrique de têtes osseuses de moutons (Ovis aries, L.). Revue de Médecine Vétérinarie. 159:603–661.
- Habel RE. 1982. Ruminant introduction. In: Sisson and Grossman, editors. The anatomy of the domestic animals. Philadelphia: Saunders; p. 821–822.
- Künzel W, Breit S, Oppel M. 2003. Morphometric investigations of breed-specific features in feline skulls and considerations on their functional implications. Anatomia Histologia Embryologia. 32:218–223.10.1046/j.1439-0264.2003.00448.x
- Miller MS, Christensen GV, Evans HE. 1964. Anatomy of dog. 2nd ed. WB. Philadelphia: Saunders Co.
- Miramontes LC, Palanca N, Palanca A. 2010. Development of a new anatomic tool for the study of the occipital region in Delphinus delphis. Mar Mammal Sci. 26:982–989.10.1111/j.1748-7692.2010.00382.x
- Morales-delaNuez A, Rodríguez C, Santana M, Hernandez-Castellano LE, Niño T, Reyes-Chacon RJ, Moreno-Indias I, Castro N, Capote J. 2012. Morphological measurements and indexes as a tool to support molecular genetic studies: an example in Canary Islands. J Appl Anim Res. 40:215–221.10.1080/09712119.2012.658062
- Olopade JO. 2003. The Morphometry of the craniofacial and maxillofacial regions of the West African dwarf goat (Capra hircus) [M.Sc. thesis]. Ibadan, Nigeria: Department of Veterinary Anatomy, University of Ibadan.
- Olopade JO, Onwuka SK, Kwari HD, Oke BO. 2006. Caudofrontal depression on the cornual end of the temporal line of the skull of goat breeds in Nigeria. Int J Morphol. 24:349–350.10.4067/S0717-95022006000400009
- Olopade JO, Onwuka SK. 2005. Some aspects of the clinical anatomy of the mandibular and maxillofacial regions of the West African dwarf goat in Nigeria. Int J Morphol. 23:33–36.
- Olopade JO, Onwuka SK. 2007. Morphometric analysis of the skull of the Sahel goat breed. Int J Morphol. 25:407–410.10.4067/S0717-95022007000200027
- Onar V, Belli O, Owen PR. 2005. Morphometric examination of red fox (Vulpes vulpes) from the Van-Yoncatepe necropolis in Eastern Anatolia. Int J Morphol. 23:253–260.10.4067/S0717-95022005000300011
- Parés PM, Sarma K, Jordana J. 2010. On biometrical aspects of the cephalic anatomy of Xisqueta Sheep (Catalunya, Spain). Int J Morphol. 28:347–351.
- Pereira F, Queirós S, Gusmâo L, Nijman IS, Cuppen E, Lenstra JA, Econogene Consortium, Davis SJM, Nedmeddine F, Amorim A. 2009. Tracing the history of goat pastoralism: new clues from mitochondrial and Y chromosome DNA in North Africa. Mol Biol Evol. 26:2765–2773.10.1093/molbev/msp200
- Sarma K. 2006. Morphological and craniometrical studies on the skull of Kagani goat (Capra hircus) of Jammu region. Int J Morphol. 24:449–455.10.4067/S0717-95022006000400025
- Zvychainaya E, Puzachenko A. 2009. Cranial variability of species of the genus Capra (Artiodactyla, Bovidae). Zoologičeskij Zurnal. 88:607–622.