
Abstract
The coloration (relative area covered by blue/sky-blue hue) and spottiness (number of dark spots, compactness of dark spots, regularity of dark spots, and the relative dorsal-to-lateral line position of the dark spots) of the dorsal skin were analyzed in nine stages (from 282 to 447 days post fertilization) in a group of juvenile Blue Back (BB) rainbow trout to characterize the origin of these attributes. A group of non-Blue Back (NBB) rainbow trout was used for comparison. These parameters were studied by computer-based image analysis. The percentage of blue/sky-blue hue on the skin of the BB group was significantly higher than the NBB group (P < 0.05). Only the BB group exhibited a constant value for blue/sky-blue hue through the nine stages analysed, in contrast with the NBB group, which experienced decreasing values at final stages. The mean number of spots, the compactness, and the relative dorsal-to-lateral line position of the dark skin markings were not significantly different between the BB and NBB groups (P > 0.05); however, the irregularity of spottiness was higher in the BB group [coefficient of variation (CV) = 40.6–47.5%] when compared to the NBB group (CV = 29.1–32.3%) at final stages. The correlation between the number of spots and the percentage of blue/sky-blue hue at the final stage was slightly negative for both groups, with no statistical significance (r = −0.16 and r = −0.12, respectively, P > 0.05). The inter-individual variation in the number of spots on the skin was large in the BB and the NBB groups, a result that agrees with the variation reported in this species for this parameter.
1. Introduction
Rainbow trout shows an extensive intra-specific variation naturally in skin pigmentation (Islam et al. Citation1973; Kause et al. Citation2003; Colihueque Citation2010; Colihueque et al. Citation2011) that may vary in coloration, spottiness, and darkness, which can give rise to distinctive phenotypes. One of these phenotypes classes corresponds to the blue-colored phenotypes, characterized by a blue color on their backs, a whitish belly, and a conspicuous silvery body. Phenotypes of this class, whose genetic basis depends on a Mendelian control, have been reported in many cultured populations around the world and include the “cobalt” variant (Yamazaki Citation1974), the iridescent metallic blue variant (Kincaid Citation1975), and the new blue variant (Blanc et al. Citation2006). However, other blue-colored phenotypes with continuous variation in the different characters that compose the phenotypes have been also reported (Colihueque et al. Citation2011). Studies on the genetics (Blanc et al. Citation2006), productive performance (Kincaid Citation1975), and histological (Oguri Citation1974; Yamazaki Citation1974; Oguri Citation1983) and physiological (Oguri Citation1976; Kaneko et al. Citation1993; Yada et al. Citation2002) aspects have been reported for different blue-colored variants of rainbow trout. However, data over time assessing the moment at which the different attributes that characterize this phenotype are established during development remain largely unclear. Recently, we analysed the skin color pattern of adult trout from the Blue Back (BB) strain (Colihueque et al. Citation2011), and we observed that trout with this phenotype possess particular characteristics when compared to trout with other phenotypes commonly found in commercial farms (trout with yellowish and greenish backs), such as an intense BB, a reduced number, and size of dark spots both on the back and flanks, and a less intense lateral red band. Therefore, to better understand the timing and differentiation of this phenotype at early development stages, we examined the skin color and spottiness over time of a group of BB juveniles and compared these results to those obtained from a group of non-Blue Back (NBB) juveniles. Given that the BB phenotype is an important trait for the improvement of the external appearance of farmed rainbow trout, its silvery blue color is considered an attractive trait, especially in some markets (Colihueque et al. Citation2011), this information could be useful in assisting in the selection process for this particular characteristic at an early development stage. Moreover, the blue-colored phenotypes of rainbow trout are also of interest for culture purposes (Colihueque et al. Citation2011) because they can present higher growth rates (+23%) than other skin color phenotypes with lower commercial value (Kincaid Citation1975).
Here, we present the results of both skin color and spottiness analysis for BB juveniles during development to characterize the origin of some of the attributes that define this phenotype. We also applied a computer-based image analysis to calculate a more objective measurement of color, thereby providing an efficient method to obtain the detailed characterization of skin color for rainbow trout.
2. Materials and methods
2.1. Fish used for analysis
The BB group (n = 9) and the NBB group (n = 15), aged between 282 days post fertilization (dpf) and 447 dpf, were obtained from the fish farm Huililco Ltda. (39°14′29.5″ S 71°50′09.8″ W), Pucón district, La Araucanía Region, Chile. These specimens belonged to an F1 progeny obtained by crossing 21 Steelhead females with five Aquagen neomales on 25 August 2006. To establish the two groups of fish studied in this work, a sample of specimens from the F1 progeny (n = 50) were marked with passive integrated transponders when they had achieved a weight of 5.0 g for unambiguous identification during photographic recording. Next, they were cultured as a pool at a temperature that ranged from 9 to 11°C with a constant flow of water at 0.33 L/s and a culture density of 28 kg/m3 in a circular 250 L tank with a green background. A photographic record was kept at nine post fertilization stages between June and November 2007: 282 dpf [stage 1, 2538 accumulated thermal units (ATU = days * °C above 0°C), 303 dpf (stage 2, 2727 ATU), 326 dpf (stage 3, 2934 ATU), 344 dpf (stage 4, 3096 ATU), 365 dpf (stage 5, 3285 ATU), 385 dpf (stage 6, 3465 ATU), 407 dpf (stage 7, 3663 ATU), 426 dpf (stage 8, 3834 ATU), and 447 dpf (stage 9, 4023 ATU)]. At stage nine, the fish were sorted according to their back color (Colihueque et al. Citation2011) and categorized into a BB group if the blue/sky-blue hue was higher than 50% of the area covered or in a NBB group if this color was lower than 50% of the area covered. The initial and final mean weight was 39.39 ± 7.15 g and 176.44 ± 25.16 g for the BB group, respectively, and 36.37 ± 10.72 g and 174.90 ± 50.70 g for the NBB group, respectively. The fish feed was comprised of extruded food free of pigment (BIOMAR, Golden Trucha) and composed of 50% protein, 14% fat, 10% ash, and 1.5% crude fiber. The food was delivered by hand at a daily rate of 1.5%. During the study period, the fish were subjected to a natural photoperiod regime typical of the latitude where the fish farm (Valdebenito et al. Citation1995) is located (9.5 hours of light and 14.5 hours of darkness for the winter solstice, and 14.5 hours of light and 9.5 hours of darkness for the summer solstice).
2.2. Photography and image analysis
Briefly, the methods of photography and image analysis (Colihueque et al. Citation2011) involved the entire trout photographed from a dorsal view (from back to lateral line) using a 7.0 Mpx digital camera under a lighting system with color temperature, and digital photographs were stored at 24-bit RGB resolutions per pixel on a memory card to be transferred to a computer for color analysis. Skin color was analysed for the blue/sky-blue hue by selecting a 1.5 × 1.5 cm area from the photograph (in front of the dorsal fin) using the color map function assisted by the color threshold tool in the SigmaScan Pro version 5.0 software. The density of spottiness of the skin (dark skin markings) was measured in grayscale by Image J version 1.38 using this software's particle analysis tool. In these analyses, the blue/sky-blue hue measurement was represented as the percentage of the area covered by the color within the area analysed [(number of matching pixels/total number of pixels) × 100] and for the spottiness as the number of dark spots by area (number of spots/cm2).
2.3. Characterization of skin color and spottiness throughout the development
To assess changes in the blue/sky-blue color and spottiness over time for both the BB and non-BB groups, these parameters were determined individually at each stage as indicated above. Next, the mean and standard deviation for these parameters were obtained at each stage for each group. For spottiness, additional parameters (Parichy & Turner Citation2003) were considered: (1) the compactness of the spottiness was measured by calculating the nearest-neighbor distances between spots (for this parameter, shorter distances indicate higher compactness); (2) the regularity of spottiness by calculating the coefficients of variation (CV) for nearest-neighbor distances between spots (for this parameter, higher CV reflects high irregularity of spot arrangements); and (3) the relative dorsal-to-lateral line position of the dark spots on the flank, where 0% represents the back-most edge of the flank and 100% represents the lateral line-most of the flank.
2.4. Statistical analysis
The distribution of variables, whether normal or not, was determined according to the Kolmogorov-Smirnov test. Differences between means were calculated by Student's t-test for independent samples. Differences between means throughout development for each parameter were calculated by a two-way analysis of variance (ANOVA) using Tukey's multiple-comparison test to carry out a post hoc pairwise comparison of means (Sokal & Rohlf Citation1995). Percentage data were arcsine-transformed prior to the analysis to better conform to the assumptions of the statistical tests. Pearson product-moment correlation analyses were also carried out to determine the relationship between the percentage of area covered by the blue/sky-blue color and number of spots by area. The variables were analysed for fitting the assumptions of the test (Sokal & Rohlf Citation1995) related to normal distribution, homogeneity of variance, and absence of correlation between means and variances. All statistical analyses were carried out using the Statistica program version 5.1.
3. Results
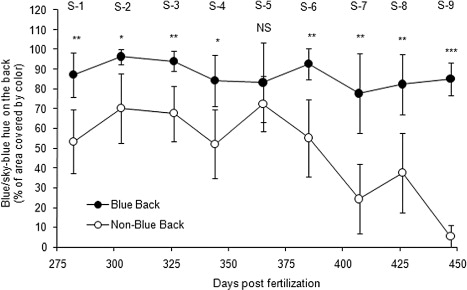
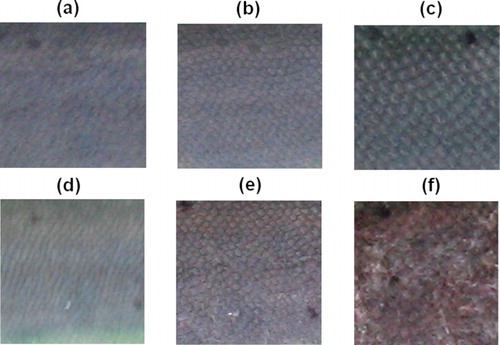
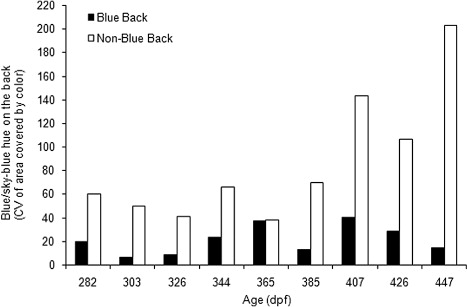
The percentage of blue/sky-blue hue on the skin of the BB group was significantly higher in each stage when compared to the NBB group (Student's t-test, stage 1: P = 0.0059, stage 2: P = 0.0254, stage 3: P = 0.0090, stage 4: P = 0.0254, stage 6: P = 0.0066, stage 7: P = 0.0018, stage 8: P = 0.0040, stage 9: P = 0.0000), with the exception of stage 5 (P = 0.2019) (). Also, within the BB group, these values were constant (P > 0.05) through the different stages (from 85.03% to 87.12%, ANOVA: F = 1.03, df = 8, P = 0.4204). In contrast, in the NBB group, the frequency of this color experienced a significant decrease in the final stage (to 5.36%) when compared to the first six stages, which showed much higher values (between 53.36% and 55.17%; ANOVA: F = 7.82, df = 8, P = 0.0000). This decrease in the blue/sky-blue skin color was clearly reflected in individuals of the NBB group when compared to the BB group (). Moreover, the variability of this blue/sky-blue hue across all stages was moderate to high in the BB group (CV = 6.14–39.74%) when compared to the NBB group, which experienced a much higher variation (CV = 37.89–202.34%) that was most evident in the final three stages (CV = 143.44–202.34%; ).
Note: *P < 0.05; **P < 0.01; ***P < 0.001. Error bars, 95% confidence intervals. Closed circles, BB juveniles; Open circles, NBB juveniles; NS, not significant; S, stage.
Note: Closed bars, BB juveniles; open bars, NBB juveniles. X axis shows each development stages in dpf.
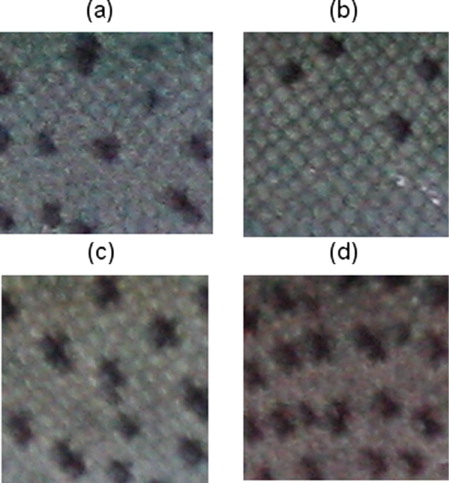
The density of spottiness was not significantly different for each stage (P > 0.05) between the BB and NBB groups (Student's t-test, stage 1: P = 0.7606, stage 2: P = 0.6366, stage 3: P = 0.7426, stage 4: P = 0.1337, stage 5: P = 0.1701, stage 6: P = 0.6685, stage 7: P = 0.4793, stage 8: P = 0.6931, stage 9: P = 0.5879). Both groups displayed a spot pattern with similar increases in the number of spots throughout development (from 0.64 to 1.58 spots/cm2 and from 0.80 to 1.96 spots/cm2, respectively). In addition, the BB group exhibited a marked increase in the number of spots, from 1.58 spots/cm2 in stage three (326 dpf) to 3.21 spots/cm2 in stage four (344 dpf). However, the difference from the mean recorded in stage three was not statistically significant (P > 0.05; ANOVA: F = 1.13, df = 8, P = 0.3491). Moreover, the inter-individual variation in the number of spots on the skin was large in the BB and NBB groups, ranging from 0 to 10.67 spots/cm2 and from 0 to 8.89 spots/cm2, respectively (). In the final stage, the individuals with an extreme number of spots on their skin were clearly distinguished from one another ().
Table 1. Density of spottiness (number of dark spots/cm2) on the back skin of the BB and NBB groups of rainbow trout during juvenile development.
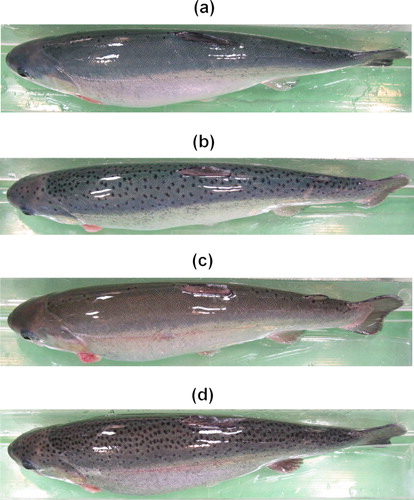
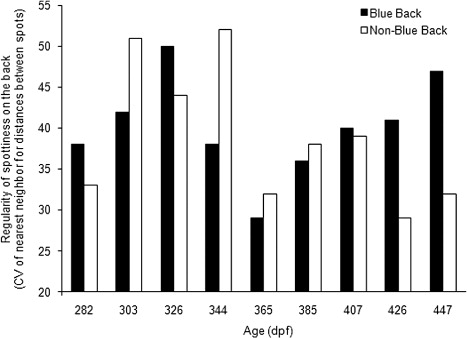
The level of compactness of the spots at each stage was not significantly different (P > 0.05) between the BB and NBB groups (Student's t-test, stage 1: P = 0.0582, stage 2: P = 0.3469, stage 3: P = 0.9687, stage 4: P = 0.7123, stage 5: P = 0.2710, stage 6: P = 0.1118, stage 7: P = 0.0585, stage 8: P = 0.9357, stage 9: P = 0.6767); moreover, in both cases, there was a slight decrease in the level of compactness between the initial and final stages (from 0.55 to 0.63 cm and from 0.47 to 0.61 cm, respectively). Meanwhile, the regularity of spottiness presented a similar pattern among the BB and NBB groups from stage 1 to stage 7. This value increased in the last two stages, reaching almost 50% greater irregularity in the former (CV = 40.6–47.5%) than the latter (CV = 29.1–32.3%; ). Most of the irregular spottiness found on specimens within the BB group was clearly observed in the final two stages ().
Note: Closed bars, BB juveniles; open bars, NBB juveniles. X axis show each development stages in dpf.
The relative dorsal-to-lateral line position of the dark spots on the flank at 282, 344, and 447 dpf was not significantly different (P > 0.05) between the BB and NBB groups (Student's t-test, 282 dpf = 48.77 vs. 50.99%, P = 0.6612; 344 dpf = 32.86 vs. 38.84%, P = 0.2040, 447 dpf = 33.76 vs. 36.18%, P = 0.7162). Moreover, as the juveniles grew, the relative positions of the spots were smaller at 344 and 447 dpf compared to 282 dpf for the BB group (ANOVA: F = 5.06, df = 2, P = 0.0075) as well as for the NBB group (ANOVA: F = 5.32, df = 2, P = 0.0056), i.e., the position of the spots in both groups was increasingly dorsal. This result was also reflected in terms of the distribution of the spots, given that 68.27% (mean ± 1 SD) presented a more dorsal location at 447 dpf.
Finally, the correlation analysis of the final stage between the spot number and the percentage of blue/blue-sky hue on the skin showed a slightly negative correlation in both the BB group and in the NBB group, but with no statistical significance (P > 0.05) in either group (Student's t-test, r = −0.16, P = 0.6750 and r = −0.12, P = 0.6731, respectively).
4. Discussion
The BB phenotype of rainbow trout is characterized by various attributes such as an intense BB, a reduced number, and size of dark spots both on the back and flanks and a less intense lateral red band (Colihueque et al. Citation2011). Our results indicate that in this strain the blue color on the back appears early during juvenile stage (282 dpf). This timing of expression agrees with data reported for other blue-colored phenotypes called iridescent metallic blue (Kincaid Citation1975) given that the blue color on the body in these trout appears at 240 days post hatching. However, earlier emergence of the blue color on the body has been also reported in the blue-colored phenotypes of rainbow trout (6–7 weeks post hatching), in particular, in the blue variant reported in France (Blanc et al. Citation2006); given that this blue-colored phenotype has a Mendelian control, it is likely that the different expression in color between the blue variant and the BB could be related to the different genetic basis of trait. Moreover, we also observed that the blue color on the back of the BB trout was very constant throughout the different developmental stages studied. This result is in accordance with Blanc et al. (Citation2006) who observed a constancy of the blue color during all rearing periods (from fingerling to adult stage) in blue variant trouts. Further analyses from juvenil to adult stages will be necessary to ascertain whether the blue color in the BB trout remains at more advanced development stages, as occurs in the blue variant trouts.
It has been reported that, in comparison with other color phenotypes reported for this species, the BB trout presents differences in dark spot patterns at adult stage (Colihueque et al. Citation2011). This is reflected in a reduction in the number and size of dark skin markings. In this study, we analysed another spottiness parameter related to the regularity of dark spot arrangements; application of this analysis showed the existence of higher irregularity of the spottiness in BB trout than in NBB trout, especially at the final developmental stages. Therefore, this result along with other data from previous studies, led us to conclude that BB trout display a specific spot pattern. The existence of this particular spot pattern in the BB trout may have different origins; to date, studies on genetic factors underlying variability in the number of spots on rainbow trout support the existence of a polygenic control for this trait in this strain, with an important genetic determination (h2 = 0.16, Díaz et al. Citation2011); in common rainbow trout a significant genetic determination for this trait has been reported (h2 = 0.45, Kause et al. Citation2003). However, considering studies on this subject carried out in the fish model, the existence of specific genes or quantitative trait loci that may be controlling the expression of this trait in BB trouts, cannot be ruled out. For example, in zebrafish certain genes have been identified involved in the determination of skin spottiness, such as connexin41.8 gene, whose mutation results in the mutant leopard, which is characterized by a wide variation in the spot pattern (Watanabe et al. Citation2006); or the kit and ednrb1 genes which control the development around half the normal number of adult melanophores in this fish (Parichy et al. Citation1999, Citation2000), and is the pigment cells class that gives rise to the dark skin pigmentation. Furthermore, in other fish model, some QTLs have been identified associated with the number of melanophores in the skin (Greenwood et al. Citation2011). Therefore, future studies in this field could provide insight into the origin of skin spot pattern variation in BB trouts.
In this study, we observed a wide inter-individual variation in the number of dark spots on the back in BB and NBB trouts. This pattern of variation in skin pigmentation has been described in rainbow trout, both in the back and in other regions of the body (Islam et al. Citation1973; Kause et al. Citation2003; Colihueque Citation2010). Therefore, this finding supports the idea that this class of variation is a distinctive feature of this species. Moreover, the density of spottiness observed in the last six stages in the BB group (between 2.02 and 3.21 spots/cm2) agrees with findings in previous studies (Colihueque et al. Citation2011) on same phenotype at an adult stage (2.3 spots/cm2). This result suggests that the density level of spottiness in adult trout would be established early in the development process, in particular, between the 344 and 447 dpf. Furthermore, of particular interest was the presence of rainbow trout without dark spots on the skin within the BB group. The absence of dark spots on the skin has also been observed in several blue variants of this species (Yamazaki Citation1974; Oguri Citation1983; Blanc et al. Citation2006), suggesting that this characteristic could be considered as typical for these phenotypes. However, our results indicate that the spot pattern of skin is independent of the degree of blue coloration on the back, given that the BB group does not present a significant association between these parameters, i.e., specimens with BB phenotype may, or may not, have spots on the skin. Therefore, the BB condition comprises a phenotype with a variable number of dark spots on the skin.
The skin pigmentation in farmed rainbow trout, in particular the silvery, spottiness, and darkness aspects of the skin, is productive traits of commercial value (Kause et al. Citation2003; Colihueque et al. Citation2011). This is because the external appearance of trout has a strong visual impact on the consumers and affects marketing prospects. Thus, the results of this study can contribute to efforts aimed at improving the external appearance of rainbow trout, a particularly important issue for producers who need improved strains of trout to meet market demands.
Acknowledgment
We are grateful to the facilities provided by the fish farm Huililco Ltda. for the realization of this study. We also wish to thank to Programa de Doctorado en Ciencias Silvoagropecuarias y Veterinarias of the Universidad de Chile for providing collaboration in this study.
References
- Blanc JM, Poisson H, Quillet E. 2006. A blue variant in the rainbow trout, Oncorhynchus mykiss Walbaum. J Heredity. 97:89–93. 10.1093/jhered/esj010
- Colihueque N. 2010. Genetics of skin pigmentation: clues and prospects for improving the external appearance of farmed salmonids. Rev Fish Biol Fisher. 20:71–86. 10.1007/s11160-009-9121-6
- Colihueque N, Parraguez M, Estay FJ, Diaz NF. 2011. Skin color characterization in rainbow trout by use of computer-based image analysis. N Am J Aquacult. 73:249–258. 10.1080/15222055.2011.581578
- Díaz NF, Estay F, Araneda C, Colihueque N. 2011. Heritability of Blue Back skin color and correlations with growth in rainbow trout, Oncorhynchus mykiss. Paper presented at: Australian Society for Fish Biology 2011 Conference. Proceeding of the Australian Society for Fish Biology 2011 Conference; Townsville, Australia.
- Greenwood AK, Jones FC, Chan YF, Brady SD, Absher DM, Grimwood J, Schmutz J, Myers RM, Kingsley DM, Peichel CL. 2011. The genetic basis of divergent pigment patterns in juvenile threespine sticklebacks. Heredity. 107:155–166. 10.1038/hdy.2011.1
- Islam MA, Nose Y, Yasuda F. 1973. Number and distribution pattern of the black spots on body surface of rainbow trout. Bull Jpn Soci Sci Fish. 39:727–739. 10.2331/suisan.39.727
- Kaneko T, Kakizawa S, Yada T. 1993. Pituitary of “cobalt” variant of the rainbow trout separated from the hypothalamus lacks most pars intermedia and neurohypophysial tissue. Gen Comp Endocrinol. 92:31–40. 10.1006/gcen.1993.1140
- Kause A, Ritola O, Paananen T, Eskelinen U, Mantysaari E. 2003. Big and beautiful? Quantitative genetic parameters for appearance of large rainbow trout. J Fish Biol. 62:610–622. 10.1046/j.1095-8649.2003.00051.x
- Kincaid HL. 1975. Iridescent metallic blue color variant in rainbow trout. J Heredity. 66:100–102.
- Oguri M. 1974. On the pituitary remnant in “cobalt” variant of rainbow trout. Bull Jpn Soc Sci Fish. 40:869–875. 10.2331/suisan.40.869
- Oguri M. 1976. On the enlarged liver in “cobalt” variant of rainbow trout. Bull Jpn Soc Sci Fish. 42:823–830. 10.2331/suisan.42.823
- Oguri M. 1983. Dermal melanophores and renal melanin-containing cells in the “cobalt” variant of rainbow trout. Bull Jpn Soc Sci Fish. 49:1679–1681. 10.2331/suisan.49.1679
- Parichy DM, Mellgren EM, Rawls JF, Lopes SS, Kelsh RN, Johnson SL. 2000. Mutational analysis of endothelin receptor b1 (rose) during neural crest and pigment pattern development in the zebrafish Danio rerio. Dev Biol. 227:294–306. 10.1006/dbio.2000.9899
- Parichy DM, Rawls JF, Pratt SJ, Whitfield TT, Johnson SL. 1999. Zebrafish sparse corresponds to an orthologue of c-kit and is required for the morphogenesis of a subpopulation of melanocytes, but is not essential for hematopoiesis or primordial germ cell development. Developement. 126:3425–3436.
- Parichy DM, Turner JM. 2003. Zebrafish puma mutant decouples pigment pattern and somatic metamorphosis. Dev Biol. 256:242–257. 10.1016/S0012-1606(03)00015-0
- Sokal RR, Rohlf FJ. 1995. Biometry: the principles and practice of statistics in biological research. 3rd ed. New York (NY): Freeman and Company.
- Valdebenito I, Peredo S, González G, Sobarzo C. 1995. Annual reproductive cycle of the “Huaiquil” or “Roncador” (Micropogonias furnieri Desmarest, 1923 sin. Micropagin manni Moreno, 1970) (Pisces: Sciaenidae) of the lake Budi. Estudios Oceanológicos. 14:29–37.
- Watanabe M, Iwashita M, Ishii M, Kurachi Y, Kawakami A, Kondo S, Okada N. 2006. Spot pattern of leopard Danio is caused by mutation in the zebrafish connexin41.8 gene. EMBO Rep. 7:893–897. 10.1038/sj.embor.7400757
- Yada T, Moriyama S, Suzuki Y, Azuma T, Takahashi A, Hirose S, Naito N. 2002. Relationships between obesity and metabolic hormones in the ‘‘cobalt’’ variant of rainbow trout. Gen Comp Endocrinol. 128:36–43. 10.1016/S0016-6480(02)00047-3
- Yamazaki F. 1974. On the so-called “cobalt” variant of rainbow trout. Bull Jpn Soc Sci Fish. 40:17–25. 10.2331/suisan.40.17