
Abstract
Population status, habitat use and threats to conservation of Alpine musk deer (AMD; Moschus chrysogaster) were studied at 13 sites between 2500 and 4500 m a.s.l. in Uttarakhand Himalayas (India) from October 2003 to December 2006. Forest trails were monitored to estimate the abundance of AMD. Data on current status and habitat use of AMD and associated ungulate species were collected by sampling of pellet groups. The relative abundance of AMD in terms of encounter rate (groups/km) and pellet groups density (pellet groups/ha) was highest in Saukherk (1.3 groups/km and 58.8 ± 8.9 pellet groups/ha, respectively). AMD pellet group numbers-habitat assessment matrix was subjected to principal component analysis to determine ecological gradients governing spatial occurrence of AMD. The first two principal components accounted for 23.7% of variation and these were related to shrub-layer attributes and livestock dung abundance, grazing and grass density, respectively. The discriminant function analysis was performed to determine spatial ecological separation between AMD and other sympatric ungulate species. Altitude, shrub density, distance to human habitation and herb density were key factors which separate musk deer from other species. Poaching of AMD for musk gland emerged as principal threat to species across sites. Elimination of poaching, strengthening the management of existing protected areas (PA) and involvement of local communities are recommended for long-term conservation of AMD.
1. Introduction
There are seven species of musk deer reported from Asia out of which, five species namely Kashmiri musk deer (Moschus cupreus), Alpine musk deer (Moschus chrysogaster), Himalayan musk deer (Moschus leucogaster), Black musk deer (Moschus fuscus) and Forest musk deer (Moschus berezovskii) are found in Himalayas within the Indian limits (Grubb Citation2005). These species are small, cryptic, mostly solitary forest dwelling and occupying hilly terrain at the height ranging from 2500 to 4200 m a.s.l. in Indian Himalayas. They occupy alpine and scrub forests (Green Citation1986). The majority of musk deer species are classified as threatened and endangered (IUCN Citation1974) and listed in Appendix I of CITES (Citation2013). These species are also listed in Schedule I of Indian Wildlife (Protection) Act (IWPA 1972). The existence of musk deer species throughout Himalayas is threatened due to large-scale deforestation in past for timber, human settlements, cultivation and developmental activities causing loss, fragmentation and shrinkage in their habitat (Green Citation1987). The presence of these species are also recorded beyond protected areas (PA); however, these species continue to decline due to lack of effective protection within PA, high levels of poaching of musk deer for musk pods by the local communities and outsiders and severe anthropogenic pressures resulting due to dependence of local communities for timber, fodder, food, medicinal plants and livestock grazing inside protected areas (Ilyas Citation2007; Khan et al. Citation2006). Although these species are very important from conservation point of view, very few work has been done on their current status, distribution and abundance throughout Himalayas in Indian limits (Green Citation1985, Citation1986, Citation1987, Satyakumar Citation1994). Earlier work by Green (Citation1985) and Satyakumar (Citation1994) provided impetus to understand the present investigation. Very few efforts have been made to understand the status and distribution in a long distributional range of Uttarakhand Himalayas and efforts were made to investigate the status and distribution in Uttarakhand having altitude from 2500 m to 4500 m, east to west, covering different forest types, which includes PA also.
2. Materials and methods
2.1. Study area
The study was carried out from October 2003 to December 2006 in 13 forest patches of Chamoli, Bageshwar and Uttarkashi districts of Uttarakhand state (77° 34′ 27″ E to 81° 02′ 22″ E and 28° 53′ 24″ N to 31° 27′ 50″ N; ). Surveys were started from east and extended upto west, covering the same altitudinal ranges irrespective of PA (). The sites experience temperate climate, where south-west monsoons are the main source of rainfall. Maximum rainfall occurs from mid-June to September, and August is the month when highest rainfall is recorded. Vegetation of these sites was classified into five categories: (1) temperate forest (from 2000 to 2800 m a.s.l. with common species of Acer spp., Juglans, Picea smithiana, Pinus wallichiana, Quercus floribunda, etc.; (2) the subalpine forest (from 2800 to 3800 m a.s.l. with dominated deciduous and evergreen plant species of Acer acuminatum, Prunus sp., shrub like Ribes glaciale, Salix denticulata, etc. Abies pindrow, Abis spectabilis and Taxus baccata and distributed in Doodh Ganga, Lata Kharak, Sainikhark; (3) the alpine scrublands forest (from 3800 to 4500 m a.s.l. with dominant species of Rhododendron anthopogon, R. lepidotum, R. campanulatum, Juniperus indica; (4) the alpine meadows (mainly dominated by herbaceous species including few shrub species such as J. indica, Lonicera obovata, R. anthopogon, Cassiope fastigiata, Salix hylematica and Salix rindleyana; and (5) Moraines (the characteristic species of moraines are Saxifraga pulvinaria, S. hemisphaerica and Androsace globifera).
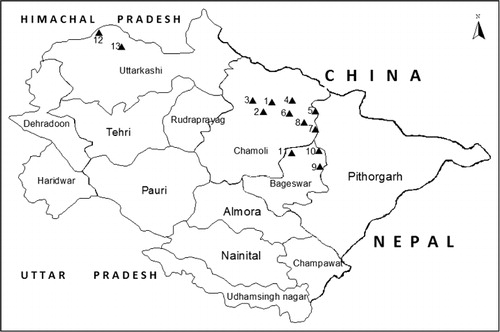
Table 1. Details of areas surveyed from October 2003 to December 2006.
2.2. Methodology
2.2.1. Data collection
The data were collected from October 2003 to December 2006. A total of 157.5 transects varying in length from 1 km to 1.5 km were laid and monitored on daily basis between 06:00 hours and 08:30 hours. Direct and indirect evidence of AMD and other species were recorded. Since direct sightings of AMD in these sites were low, greater emphasis was given on sampling of pellet groups along transects at every 50-m intervals. Sampling plots of 10-m radius were established on either side of transects and searched for pellet groups of target species. The pellet groups of various species were differentiated on the basis of size, shape and colour (Green Citation1987; Neff Citation1968; Putman Citation1984; Rowland et al. Citation1984). The assessment of habitat factors was also done in and around 10-m plot. While tree counting the tree species in 10-m plot, shrub species were also enumerated in a subplot of 3 m. A total of 405 plots were sampled. Herb and grass species were counted in four quadrates of 0.50 × 0.50 m and were laid in four directions at each sampling point. Tree canopy cover was measured using a gridded mirror of 25 × 25 cm dimension divided into equal grids of 5 × 5 cm. The cover was estimated randomly at four locations around the plot. The mirror was kept horizontally at 1.25 m above the ground level and all grids, which were covered by >50% tree foliage, were counted and converted into per cent tree cover. The ground cover was estimated by point intercept method (Canfield Citation1941). A metre tape was laid on the ground in four directions and intercepting materials (herbs, grass, litter, bare ground, weathered stone and rock) at 5-cm interval was recorded. The disturbance factors such as tree felling (number of cut trees/plot), lopping (number of lopped trees/plot), cattle grazing and cattle dung (number of dung piles/plot) were also recorded in 10-m radius circular plots. The poaching pressure, trade in wildlife parts and the man–animal conflict across the surveyed sites were assessed by using questionnaire surveys in the villages located in and around the surveyed patches. The general disturbance factors, such as tree felling, tree lopping, cattle grazing and impact of fire, were estimated to assess the conservation threats to AMD. Data were summarised according to sites and accordingly threat scores were assigned.
2.2.2. Data analysis
The density was calculated using the formula D = No. of individuals/area (Ilyas Citation2001). Diversity and species richness of trees, shrubs and grasses for each plot were calculated by using Shannon–Wiener diversity index (H′) and Margalef's richness index (RI).
The sightings of AMD along transects were summarised and used to calculate encounter rates (groups/km). The number of pellet groups in each plot was used to estimate pellet group density (pellet groups/ha) of AMD. The differences in mean pellet group densities of AMD among different sites were tested by one-way analysis of variance (ANOVA) with post hoc Scheffe's test.
The pellet group data from all sites were organised in sample-habitat parameter matrix and subjected to principal component analysis (PCA), for which data were standardised using log and arcsine transformation functions. The first two factors were used for ecological interpretation. PCA was performed using Varimax rotation and component scores were saved. Component scores were subjected to Pearson product-moment correlation analysis with habitat variables to find out significant correlations between habitat variables and components. Available and utilised plots were plotted in two-dimensional space defined by principal component I (PC I) and principal component II (PC II). The differences in mean pellet group densities of AMD vis-à-vis different habitat types, slope categories, aspects, burnt/unburnt areas and vegetation cover were tested by one-way ANOVA.
To investigate the distribution pattern of the associated fauna of musk deer in its distributional range such as Himalayan tahr, serow, sambar, bharal at landscape level, discriminate function analysis (DFA) was performed (Ferrar & Walker Citation1974). DFA was performed on indirect evidence (pellet groups), which were organised into a sample-habitat parameters matrix. To normalise the data-set, each variable was subjected to natural log and arcsine transformation function. The stepwise DFA was performed on a matrix of 204 samples and 20 habitat variables. All statistical tests were performed following Zar (Citation1984) using SPSS 7.5 statistical software (Norusis Citation1990).
3. Results
3.1. Status and abundance of AMD
The direct evidence of AMD was recorded from eight sites. A total of 28 groups of AMD was recorded on 132.5-km transects. Most of the groups had only one adult male, except on one occasion when the adult female was sighted with an infant. The maximum encounter rate of AMD was recorded in Saukherk (1.3/km). The mean pellet group density (pellet groups/ha ± S.E.) of AMD was also highest in Saukherk (58.8 ± 8.9) and lowest in Herki doon (4.97 ± 2.52; ). The pellet group density differed significantly (F(12, 392) = 7.07; p < 0.001) between sites, wherein the density in Saukherk was significantly different from all the sites except Hitoli and Mulakherk.
Table 2. Encounter rates and pellet group density (pellet groups/ha ± S.E) of musk deer at surveyed sites of Uttarakhand Himalayas.
3.2. Habitat use
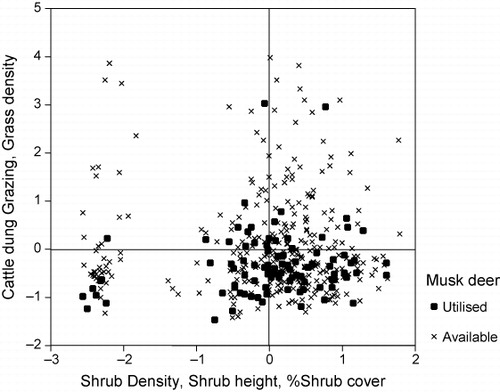
The first two PCs accounted for 16.2% of variation in data matrix, respectively. shows the distribution of available and utilised plots in relation to first and second PCs. PC I was positively correlated with shrub density (r = 0.890, p < 0.01), shrub height (r = 0.864, p < 0.01) and shrub cover (r = 0.679, p < 0.01). PC II was positively correlated with cattle dung (r = 0.776, p < 0.01), grazing (r = 0.769, p < 0.01) and grass density (r = 0.645, p < 0.01). presents available and utilised plots in space defined by PC I and PC II. It suggests that musk deer utilised areas with medium shrub density, shrub height and shrub cover with low livestock disturbance and low grass density.
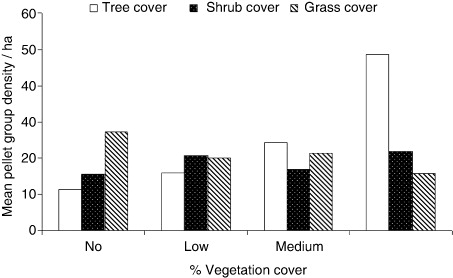
The mean pellet group density of AMD was maximum (21.73 ± 2.5) between 3000 and 3500 m altitude as compared to 2500 and 3000 m and 3500 and 4200 m altitude categories; however, the difference was not significant. shows the distribution of mean pellet group density vis-à-vis different vegetation cover categories. The mean pellet group density of AMD was highest in areas with high tree (48.7 ± 12.29) and shrub (21.90 ± 7.9) cover but with significantly low grass cover. However, the difference was significant for tree cover (F(3, 401) = 7.9; p < .001) only.
3.3. Factors governing distribution at landscape level
Distance from human habitation, shrub density, shrub height, herb density, ground cover and altitude had significant F values and were capable of discriminating among different species (). The first two discriminant functions (DF1 and DF2) accounted for 61.9% and 29.7%, of variance, respectively. DF1 represented a gradient of decrease in altitude, increase in shrub density, shrub height and tree density whereas DF2 represented a gradient of increase in herb density, grass cover and low altitude. The distribution of the species centroids in relation to two functions is provided in . The results suggest AMD is separated ecologically due to its avoidance of disturbance and preference of dense patch of forest with sparse ground cover and low elevation. Sambar and Himalayan tahr prefer the area with high shrub density, height and high tree density, while bharal and serow prefer the area far from human habitation with low shrub density, height and tree density, which shows its preference for the open area.
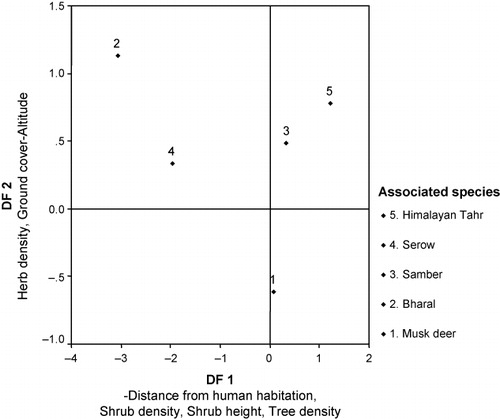
Table 3. Values of Wilks' lambda and univariate F ratios for variables used in DFA (4 and 199 degree of freedom).
3.4. Threats
Tree felling was recorded maximum at Kaphni (3.8 ± 3.79; ), whereas tree lopping was maximum at Mulakherk (1.9 ± 0.82). Contrary to this, no tree lopping was recorded at Saukherk and Hitoli. Cattle dung density was highest at Liwari (6.09 ± 1.08), with no cattle dung record at Saukherk, Hitoli, Dwali and Kaphni. Maximum grazing pressures were recorded from Liwari (36.87 ± 6.09). Incident of fire was recorded from Hitoli, Mulakherk and Belta; however, the intensity of fire was found to be maximum at Hitoli (26.5 ± 4.2). Questionnaire surveys in the villages and interview of the people at the tea shops (without disclosing identity) revealed that poaching pressure was maximum at Madmaheshwar, Lata Kharak, Belta, Liwari and Herki doon, whereas no poaching was reported from Tungnath. All threats were summarised according to the sites and scores were allotted to each threat according to its severity. The least threatened site was Saukherk, while Liwari was recorded as most threatened site ().
Table 4. Disturbances recorded and threat score at different surveyed sites of Uttarakhand Himalayas.
The Kedarnath Wildlife Sanctuary was found to be least threatened site while parts of Nanda Devi Biosphere Reserve and Govind Pashu Vihar Wildlife Sanctuary and National Park were found to be the most threatened sites.
Poaching pressure and man–animal conflict across the surveyed sites were assessed, and the whole nexus of poaching and trade of its products was investigated. All the 13 sites, including 3 sites in Kedarnath Wildlife Sanctuary, 2 sites in Govind Pashu Vihar Wildlife Sanctuary and National Park, 6 sites in Nanda Devi Biosphere Reserve and 2 forest panchayat in Uttarakhand Himalayas, were surveyed for this purpose. Out of three surveyed sites in Kedarnath the most threatened site was Madmaheshwar, where locals from nearby villages were in practice of killing the species for musk pod and also using the meat as food. Moreover, Madmaheshwar, Tungnath and Bansi Narayan (forest panchayat) are pilgrimage sites attracting large number of people every year causing great disturbance.
Govind Pashu Vihar National Park (Herki doon) and Wildlife Sanctuary areas (Liwari) were surveyed to find out the poaching pressure, where sanctuary area was found to be more disturbed in terms of grazing and poaching. The villagers of the Dooni, Masri, Liwari, Phithari, Osla, Poani and Gangahar were involved in organised poaching as 80% of the population is unemployed and the villagers' livelihood is dependent on the forest resources. As per the interviews with the villagers about 20% of the families are involved in musk deer killing. The National Park area also reels under poaching pressure but in comparison to the Wildlife Sanctuary, the pressure is very low.
Nanda Devi Biosphere Reserve is rich in biodiversity with a very rough terrain. Poaching was rampant in seven surveyed sites where Khati and Jatoli villages were very sensitive sites.
4. Discussion
To assess population size and to ensure the successful management and conservation of musk deer, determining their distribution and abundance is an essential and foremost step. The preliminary survey revealed that the area which is less disturbed and away from the human settlement, i.e. Saukherk, was having maximum number of animal groups as well as pellet group density (12 and 58.8 ± 8.9, respectively). Groves et al. (Citation1995) has mentioned the presence of all the five species in the Himalayan range from east (i.e. Arunachal) to north (i.e. Kashmir) at the altitudinal range from 2500 m to 4500 m a.s.l. AMD is present in the Uttarakhand Himalayas. Green (Citation1985) and later on Satyakumar (Citation1994) have reported the species from Saukherk, Garhwal Himalayas.
Only six direct sightings of AMD and low density of their pellet in pilgrimage sites like Herki doon and Tungnath with high tourist pressure suggest extremely low abundance of the species. Changes in land-use pattern after clearance of forest for agriculture as well as for commercial purposes in the past have drastically reduced the distribution of the species (Singh Citation1981, Tewari Citation2001).
The results of PCA explain that species prefer habitat with high shrub density, shrub height and shrub cover and avoid human interference/disturbances. The habitat preference of musk deer is governed by the thickness of shrub cover. During the day time, musk deer move towards lower elevations, where shrub is dominant, while they use higher altitude alpine meadows or pasture at night that is also supported by the study conducted by Green (Citation1985). Shrub cover provides not only food and traces of elements (Alvarado et al. Citation2013) but also a good escape cover from the predator. Most of the pellet groups of musk deer were recorded from the area dominated by R. campanulatum, surrounded by Quercus species, birch forest and A. pindrow at one side and alpine meadows on the other side. Probably it is due to good escape cover from predators like common leopard, yellow-throated martin, etc. and easy availability of food resources. There is no evidence to suggest altitudinal migration during different seasons that is in accordance with Green (Citation1985). The pattern of daily altitudinal movement is significant in AMD as they use forest or shrub during day hours and pasture at night.
In the present study, musk deer is showing clear-cut discrimination from the other associated species by its preference for high shrub cover (R. campanulatum) and preference for lichen as preferred food. Based on the findings of the present study, it is suggested to conservation managers of Uttarakhand that they should formulate proper strategies, which is the optimum habitat condition for the species. The oak patches (Quercus semecarpifolia), birch (Betula utilis) and rhododendron (R. campanulatum) forests with alpine meadows in Uttarakhand have to be maintained as a mosaic of closed and open areas, keeping in mind the needs of AMD during day- and night-time (Schoener Citation1974, Citation1986).
In most of their distribution range in Uttarakhand Himalayas, AMD are known to occur along with several ungulate species such as bharal, sambar, serow and Himalayan tahr. This study reveals that musk deer along with their associated ungulates like bharal, sambar, serow and Himalayan tahr tend to share similar habitats with preference for medium to higher shrub density, shrub height, high altitude with low herb and low ground cover and avoid human interference. The findings of present work are similar to the study conducted by Green (Citation1987) on ecological separation of Himalayan ungulates (AMD, sambar, serow and goral in Kedarnath Wildlife Sanctuary). These species not only showed differential habitat-use pattern but also showed differences in their diet (Ilyas & Khan Citation2003). AMD share the habitat with the associated fauna but they differ in their habitat use at micro level. The importance of vegetation cover specially the shrub cover to musk deer is recognised by Bannikova et al. (Citation1980) who maintain that lack of opportunities to escape, hide or take shelter is one of the reasons for the migration of musk deer in autumn at lower reaches (Green Citation1987).
The presence of anthropogenic disturbance is known to affect musk deer and moschidae. In the present study, effect of human activity varied between different sampling sites. Anthropogenic disturbances on AMD population and its habitat were recorded from areas that were close to the vicinity of the reserve forest boundary. Out of all the surveyed sites, the Kedarnath Wildlife Sanctuary is the least threatened site, while parts of Nanda Devi Biosphere Reserve and Govind Pashu Vihar are found to be most threatened sites. The nature and magnitude of illegal activities varied from poaching for personal consumption to organised poaching for commercial purposes. According to the musk pod demand in different areas, the price of musk pod varies. Around the Kedarnath Wildlife Sanctuary the cost of musk pod varied from 1000 to 2500 Indian rupees (INR) per 10 g, whereas in and around Govind Pashu Vihar, the cost varied from 2500 to 5000 INR, and in Nanda Devi Biosphere Reserve locals get about 1000–4000 INR for 10 g of musk. Towards Khati and Jatoli villages, price for musk pod is higher than the other localities mentioned above. It is reported that villagers are partially generating their income from musk pod extraction. About 40% of the villagers from Dooni village are involved in illegal musk pod trade from Govind Pashu Vihar Wildlife Sanctuary and are generating 60% of their annual income from this. In this way average income of each family only from musk pod extraction is 15,500 INR (250 USD). Similarly, Blower (Citation1974) reported that on average a family extracts 4–5 tolas (c.50 g) of musk pod that is sufficient for a family living in a remote hill region at least for a year.
4.1. Conservation implications
Judicious management of the natural ecosystem is one of the major fundamentals for ensuring the conservation of musk deer in the wild. The comparison of historical information with present data suggests fluctuation in musk deer population over time. This could be (1) inherent factors in the population or (2) anthropogenic pressures such as poaching or due to intraspecific competition with the sympatric species. This necessitates development and implementation of long-term monitoring programmes for the species and associated ungulate species in its distributional range. As the presence of high-altitude vegetation is a prerequisite for musk deer habitat, this should be maintained or wherever necessary restored. Hence, it is recommended that the vegetation at the altitude of 2500–4500 m a.s.l. should be protected, and anthropogenic disturbance as well as poaching pressure should be minimised. Strict enforcement of law should be there at international boundaries.
Despite legal protection and few conservation measures, poaching of musk deer goes unabated in the region and moreover lack of proper management-oriented plan forms a major hindrance in strengthening conservation plans. It is therefore suggested that instead of declaring more areas as protected, the forest department should rather strengthen the management for the protection of the species in existing PA. All the musk deer species should be included in the Appendix I of CITES, and no exemptions should be given to any range country to use the product obtained from musk deer. Government should pay more attention for in situ as well as ex situ conservation. Further improvement of in situ protection of musk deer needs international cooperation to control the worldwide trade of musk (Kang & Phipps Citation2003), and the smuggling of musk and poaching of musk deer must be completely banned. The domestic demand for traditional Chinese medicines should be monitored and controlled, and clear product labelling of medicinal and perfume items containing natural musk together with accompanying official permits should be brought into use.
The conservation measure in Uttarakhand Himalayas would therefore require consideration of the well-being of the AMD as well as the local community partially dependent on the habitat across the borders of Uttarakhand. If urgent attention is not paid the taxon is liable to face extinction. It is of utmost importance to improve the legal protection of AMD in range countries. It requires enough diplomatic measures to evolve transnational policy initiatives. The recipient countries should also be required to assist source countries in tracking such activities to safeguard and monitor deer population.
The study recommends for provision of trained personnel in adequate number with technology-driven communication and surveillance system and they should manage the PAs and around the PAs to prevent crime against these endangered species. The backbone of the collaborative nexus of the poachers with the locals should be broken by bringing out the locals from the lure of instant money at cost of their cultural and ethical heritage, besides providing employment opportunities. The human resources of the localities can be diverted to sustain growth of area within a balanced framework to leave the habitat of the animal undisturbed. The tardy justice system must be overcome by having speedy trials of the crime. The state agencies and non-governmental organisations thus must formulate steps in consonance to reduce high anthropogenic pressure, over grazing, poaching and de-fragmentation of the habitat.
Acknowledgements
The information presented in this paper was obtained during a study of Alpine musk deer in Uttarakhand Himalayas. The project was funded by Department of Science and Technology, Ministry of Science and Technology, Government of India, under the SERC FAST Track Scheme Young Scientist and UGC-New Delhi, Government of India. The chairman, Department of Wildlife Sciences, Aligarh Muslim University, Aligarh, is thanked for giving the permission to carry out the project through the department. In particular, special thanks is due to Mr. Srikant Chandola, Chief Wildlife Warden, Uttarakhand, for his help and support during the field study.
References
- Alvarado MDS, Rodríguez HG, Lozano RGR, Silva IC, Meza MVG, Correa MC, Ybarra EJ, Domínguez-Gómez TG. 2013. Trace elements in native shrubs consumed by white-tailed deer (Odocoileus virginianus) in northeastern Mexico. J Appl Anim Res. 41:277–284. 10.1080/09712119.2013.782864
- Bannikova AG, Ustinov SK, Lobanov PN. 1980. The musk deer Moschus moschiferus in the USSR. Gland: IUCN.
- Blower J. 1974. Note on trade in musk, Nepal. Morges: WWF/IUCN.
- Canfield R. 1941. Application of the line intercept method in sampling range vegetation. J Forestry. 39:388–394.
- CITES. 2013. Official documents (2013) appendices I, II and III. Convention on international trade in endangered species of wild fauna and flora; [cited 2013 July 2]. Available from: www.cites.org/eng/append/latest_appendices.shtml.
- Ferrar AA, Walker BH. 1974. An analysis of herbivore/ habitat relationship in the Kyle National Park, Rhodesia. J S Afr Wildl Manage Assoc. 4:137–147.
- Green MJB. 1985. Aspects of the ecology of Himalayan musk deer [PhD thesis]. University of Cambridge. 280 p.
- Green MJB. 1986. Distribution, status and conservation of Himalayan musk deer. Biol Conserv. 35:347–375. 10.1016/0006-3207(86)90094-7
- Green MJB. 1987. Some ecological aspects of a Himalayan population of musk deer. In: Wemmer CM, editor. Biology and management of the Cervidae. Washington, DC: Smithsonian Institution Press; p. 307–319.
- Groves CP, Wang Y, Grubb P. 1995. Taxonomy of musk deer, genus Moschus (Moschidae, mammalian). Acta Theriol Sin 15:181–197.
- Grubb P. 2005. Artiodactyla. In: Wilson DE, Reeder DM, editors. Mammal species of the world. A taxonomic and geographic reference (3rd ed). Baltimore, USA: Johns Hopkins University Press; p. 637–722.
- Ilyas O. 2001. Status and conservation of ungulates in the Kumaon Himalayas with special reference to aspect of ecology of barking deer (Muntiacus muntjak) and goral (Nemorhaedus goral) [PhD thesis]. Aligarh: AMU. p. 281.
- Ilyas O. 2007. Status, conservation and aspects of ecology of musk deer (Moschus chrysogaster) in Kumaon and Garhwal Himalayas Uttaranchal Himalayas India. DST funded project, report. Aligarh: Aligarh Muslim University. p. 129
- Ilyas O, Khan JA. 2003. Food habits of barking deer (Muntiacus muntjak muntjak) and goral (Nemorhaedus goral bedfordi) in Binsar wildlife sanctuary, India. Mammalia T. 67:521–531.
- IUCN. 1974. Red data book: vol. I – Mammalia. Morges: International Union for the Conservation of Nature and Natural Resources.
- Kang S, Phipps M. 2003. A question of attitude: South Korea's traditional medicine practitioners and wildlife conservation. Hong Kong: TRAFFIC East Asia.
- Khan AA, Qureshi BUD, Awan MS. 2006. Impact of musk trade on the decline in Himalayan musk deer Moschus chrysogaster population in Neelam Valley, Pakistan. Curr Sci. 91:606–609.
- Neff DJ. 1968. The pellet group count technique for big game trend, census and distribution: a review. J Wildl Manage. 32:597–614. 10.2307/3798941
- Norusis MJ. 1990. SPSS/PC +4.0 base manual – statistical data analysis. Chicago, Illinois: SPSS.
- Putman RJ. 1984. Facts from faeces. Mammal Rev. 14:79–97. 10.1111/j.1365-2907.1984.tb00341.x
- Rowland MM, White GC, Karlen EM. 1984. Use of pellet-groups plots to measure trends in deer and elk populations. Wildl Soc Bull. 12:147–155.
- Satyakumar S. 1994. Habitat ecology of major ungulate in Kedarnath Musk Deer Sanctuary, Western Himalayas [PhD thesis]. Rajkot: Saurashtra University. p. 244.
- Schoener TW. 1974. Competition and the form of habitat shift. Theor Pop Biol. 6:256–307. 10.1016/0040-5809(74)90013-6
- Schoener TW. 1986. Resource partitioning. In: Anderson D, Kikkawa J, editors. Community ecology-patterns and process. Oxford: Blackwell; p. 91–126.
- Singh T. 1981. Tourism in the Himalaya: some experience in tourist ecology. In: Singh T, editor. Studies in Himalayan ecology and development strategies. New Delhi: The English Book Store; p. 199–210.
- Tewari I. 2001. Fading fragrance of musk. Curr Sci. 80:1478.
- Zar JH. 1984. Biostatistical analysis. Englewood Cliffs (NJ): Prentice Hall. 718 p.