
Abstract
The aim of this study was to check the effectiveness of classification and regression trees (CART), support vector machines (SVM) and generalized linear model (GLZ) in the detection of difficult calvings in the Polish Holstein-Friesian Black-and-White heifers and to identify the most influential predictors of such calvings with special regard to oestrogen receptor alpha (ERα) and cytochrome P450 (CYP19) aromatase genotypes. A total of 529 calving records containing four continuous and four categorical predictors were analysed. Calving category (difficult vs. easy) was a dependent variable. The most significant predictors were as follows: gestation length, body condition score index and calving age (for CART), as well as ERα genotype (for GLZ). Sensitivity (percentage of correctly diagnosed difficult calvings) and specificity (percentage of correctly diagnosed easy calvings) on a test set were 70.0% and 94.7% (for CART) as well as 50.0% and 99.0% (for SVM and GLZ), respectively. The studied models were characterized by good detection performance and high specificity and reliability of predictions.
1. Introduction
The incidence of difficult calvings (dystocia) in cattle is highest from among all farm animal species (Purohit et al. Citation2011). Moreover, heifers are characterized by up to three times higher dystocia rate than multiparous cows (Meyer et al. Citation2001). The frequency of dystocia in dairy breeds (Holstein-Friesian, Norwegian Red, Swedish Red and White) from different countries of Europe, the USA, Australia and New Zealand was estimated at 3–23% (Mee Citation2008). This condition results in many adverse effects, such as increased mortality and culling rates, higher risk of calving difficulties at subsequent calving and susceptibility to diseases (metritis, retained placenta, milk fever), reduced fertility (longer calving-to-conception interval, increased number of artificial inseminations per conception and delayed first service), production and dry matter intake, body weight and body condition loss during lactation and disadvantageous metabolic changes (Mee Citation2004; Barrier Citation2012). Dystocia also considerably affects the health and welfare of calves (increased perinatal mortality, reduced immunity to diseases, higher level of physiological stress; Barrier et al. Citation2012; Barrier et al. Citation2013). All these factors are associated with considerable financial losses, estimated in the USA at approx. 28 USD per average heifer (Dematawewa & Berger Citation1997), although the total cost of particularly difficult calving may be much higher. There are many direct risk factors of dystocia, with the most important being mismatch between the size of a foetus and its dam (more than 50% of obstetrical cases), foetal malpresentation (20–40% of obstetrical cases) and maternal causes such as uterine torsion (less than 10% of cases) and hypocalcaemia (less than 17% of cases; Schuenemann et al. Citation2011).
For heifers, the most significant factors are foetopelvic incompatibility, abnormal foetal disposition and incomplete dilation of the vulva and cervix (Mee Citation2004). They are in turn affected by many indirect causes (calf birth weight, gestation length, parity, calf sex, breed, nutrition, climate, heifer body weight, body condition, calving age, etc.; Mee Citation2008), including genetic ones. Genes potentially influencing calving difficulty are, among others, oestrogen receptor alpha (ERα) gene, mediating the action of oestrogens on the maintenance of normal physiological processes associated with female reproduction and playing a key role in the pathology of female sex organs (Szreder et al. Citation2011), as well as cytochrome P450 aromatase (CYP19) gene, responsible for oestrogen synthesis (Kowalewska-Łuczak Citation2010).
That being so, it seems justified to make an attempt at earlier detection of difficult calvings in dairy heifers based on available information on potential risk factors. Such a possibility is given by, among others, classification and regression trees (CART; Breiman Citation1984) and support vector machines (SVM) known from the field of data mining as well as a more traditional statistical method, i.e. generalized linear model (GLZ). The first one consists in asking a series of simple questions. An answer given at each stage determines the next (if any) question, which ultimately leads to a network of questions resembling a tree structure (Nisbet et al. Citation2009). The second method (SVM) is based on the application of linear models to the creation of non-linear boundaries separating classes through the transformation of the input pattern space to a new space (by means of non-linear mapping), where the constructed model can represent non-linear decision boundaries in original space (Witten et al. Citation2011). The last aforementioned method (GLZ) allows for linking the values of a dependent variable following a specific distribution to a set of independent variables (both continuous and categorical) via an appropriate link function, whose parameters are estimated (using the maximum likelihood method) in such a way so that the values observed in a training data-set are most probable (Sokal & Rohlf Citation1995). The most recent applications of CART to classification tasks in animal farming include modelling of calving ease and stillbirths in cattle (Piwczyński et al. Citation2013), somatic cell count in cow milk (Piwczyński & Sitkowska Citation2012) and lamb mortality (Piwczyński et al. Citation2012), detection of cows with conception difficulties (Grzesiak et al. Citation2011), classification of lactation curves in cattle (Pietersma et al. Citation2002; Pietersma et al. Citation2003), whereas SVM were used for, among others, identification of cattle breeds (Rodero et al. Citation2012), classification of bull semen samples (Aguiar et al. Citation2012), mastitis (Miekley et al. Citation2013) and lameness (Alsaaod et al. Citation2012) detection in dairy cows, classification of cow behavioural patterns (Martiskainen et al. Citation2009), detection of heifers and steers, in which prohibited growth stimulators had been used (Nebbia et al. Citation2011) and the classification of sleep and lying periods in calves (Hokkanen et al. Citation2011). On the other hand, GLZ with a binomial distribution of dependent variable and the logit link function was used, among other things, to analyse risk factors of dystocia (Mee et al. Citation2011) and stillbirths (Gulliksen et al. Citation2009) in dairy cows.
Therefore, the aim of this study was to compare the quality of the CART, SVM and GLZ models used for dystocia detection in the Polish Holstein-Friesian Black-and-White heifers, verify detection performance of these models and indicate the most influential predictors of calving difficulty with special regard to the aforementioned genotypes.
2. Material and methods
A total of 529 calving records from the Polish Holstein-Friesian Black-and-White heifers collected between 2004 and 2009 were used in this study. The initial data-set comprised 606 cases and was subsequently reduced to 529 cases after deleting erroneous or incomplete records without information on genotypes, calving age and other predictors, which was impossible to impute. Heifers were managed in a free-stall system in barns with outside runs on a farm located in the West Pomeranian province and fed a total mixed ration (TMR). The mean milk yield in the analysed period (305 d of lactation) was 9952 kg. Only heifers without any serious illnesses before calving were included. Four continuous () and four categorical () explanatory variables were used in total. These included proportion of Holstein-Friesian genes in heifer genotype (in %) – %HF (X1), gestation length (in days) – GEST (X2), body condition score index – BCSI (X3), which is a difference between the mean BCS before calving (BCSpre) and BCS at calving (BCSpost), calving age (in months) – AGE (X4); ERα genotype (GG or AG) determined using the BglI restriction enzyme – BGLI (X5), ERα genotype (AA or AG) determined using the SnaBI restriction enzyme – SNABI (X6), cytochrome P450 aromatase genotype (AB or AA) determined using the PvuII restriction enzyme – CYP19 (X7) and calving season [autum–winter (AW) and spring–summer (SS)] – SEASON (X8).
Table 1. Means and standard deviations (SD) of continuous predictors in the training (n = 397), and test (n = 132) data-sets and both data-sets combined (n = 529).
Table 2. Distributions of categorical predictors and the dependent variable in the training (n = 397) and test (n = 132) data-sets and both data-sets combined (n = 529).
BCS was assessed on a 5-point scale (Ferguson et al. Citation1994; Flamenbaum et al. Citation1995) and the optimum was set at 3.50 scores with higher values deducted from 3.50, i.e. 3.75 was converted to 3.25, etc. This was necessary to appropriately reflect the optimum BCS in the modelling process. All the analysed polymorphisms were the A/G transitions. The first A/G transition recognized by the BglI nuclease was located at position 151 within the 5′-region of ERα gene (GenBank Acc. No. AY340597; Szreder and Zwierzchowski Citation2004). The second one recognized by the SnaBI nuclease was located at position –1213 relative to +85 splicing acceptor site in exon 1 of ERα (GenBank Acc. No. AY332655; Szreder et al. Citation2007). The last polymorphism recognized by the PvuII restriction enzyme was located at position 1044 within the promoter 1.1 of the CYP19 gene (EMBL Acc. No. Z69241; Vanselow et al. Citation1999).
Heifer calving class (A – difficult, B – easy) was a target (dependent) variable (Zaborski and Grzesiak Citation2011). Initially, calving difficulty was assessed by one experienced zootechnician on the following rank scale:
An easy, spontaneous calving;
An easy calving with little help from man;
A difficult calving, with substantial help from man and veterinarian's assistance; and
A difficult calving requiring veterinarians' intervention with potential complications, such as placental abruption, etc.
The whole data-set of information records was randomly divided into two subsets: a training set (397 records), used for training the CART and SVM models and estimating parameters of GLZ, and a test set (132 records), used for evaluating the detection performance of the models on new data, not utilized previously during model building. The division was made according to the 3:1 rule (75% records for training and 25% for testing) proposed by Ivakhnenko and Yurachkovskii (Citation1987). In this way, it was possible to assess the effectiveness of the models in their practical application. Statistica® 10 PL software (StatSoft Inc., Tulsa, OK, USA) was used for model construction and evaluation. In each analysis, misclassification costs for both classes were equal and the a-priori probabilities of class membership were calculated from the proportions of records in the training data-set.
When building the CART models, three different splitting criteria were used (Gini index, chi-square and G-square measures; Hastie et al. Citation2009; StatSoft Citation2013). The tree pruning was based on a minimum cost and complexity of 10-fold cross-validation, in which the training data-set was randomly divided into approximately 10 equal subsets, from which nine were used for model training and one for assessing its generalization ability. The whole process was repeated 10 times, so that each subset served as a validation subset once and the error on this subset was averaged (Haykin Citation2009).
In the SVM model construction, its C-SVM type was used, in which the following error function (FE) was minimized during the training process (Hill & Lewicki Citation2006):
In the present study, the C constant was determined based on a 10-fold cross-validation, allowing us for finding its optimal value, which was equal to 10 (StatSoft Citation2013), whereas the selected kernel type was a linear one (Hsu et al. Citation2003):
Before SVM training, all predictors were scaled to the interval between 0 and 1, in order to reduce the number of support vectors and the risk of overtraining.
In the case of GLZ, the binomial distribution of the dependent variable and the logit link function were used (Koronacki & Ćwik Citation2005):
After evaluating all effects for the model built based on the training data-set, the method of the best subset was applied to the selection of predictors. As a result, the following variables were retained in the model: GEST, BCSI, AGE and SNABI. The normal distribution of residuals was also verified.
After the stage of model building and training, their quality on the training data-set was assessed using the following probabilities: sensitivity (proportion of correctly diagnosed difficult calvings), specificity (proportion of correctly diagnosed easy calvings) and accuracy (proportion of correctly diagnosed difficult and easy calvings). In addition, statistically significant differences were determined using the test for proportions. Akaike information criterion (AIC) was also calculated in order to compare model quality (CART, SVM and GLZ) and its lower value indicated a better model.
The next stage of the present study was an identification of the most influential predictors (those with the greatest effect on the dependent variable class) for the CART and GLZ methods, based on the so-called importance coefficient (StatSoft Citation2013) and the Wald test statistic (Koronacki & Ćwik Citation2005), respectively. In the case of SVM, this identification was impossible using the default settings of Statistica® 10 PL software.
After evaluating the quality of the CART, SVM and GLZ models and identifying significant predictors, their ability to detect heifers with calving difficulties was verified based on the previously created test set, whose records had not been used for model building. In this way, it was possible to estimate approximately model performance during its potential use in breeding practice. The following measures were calculated: sensitivity (Se), specificity (Sp), accuracy (Acc), false alarm rate [P(FP); proportion of heifers calving easily that were indicated as those with difficult calvings by the model], false negative rate [P(FN); proportion of heifers with difficult calvings erroneously indicated as easy calvers] as well as the a-posteriori probabilities of true positive [P(PSTP)] and true negative [P(PSTN)] responses, showing the reliability of predictions made by the models. Statistically significant differences between probabilities were tested using the test for proportions. Moreover, the receiver operating characteristic (ROC) curves were plotted and the area under the curves (AUC) was calculated. The ROC curve may be used for classifiers with a dichotomous-dependent variable. It shows the relationship between sensitivity and specificity for all possible cut-off values. An ideal classifier is characterized by the ROC curve with coordinates (0;0), (0;1) and (1;1) (AUC = 1.0), whereas one whose performance does not differ from a completely random classification has a diagonal ROC curve (AUC = 0.5; Witten et al. Citation2011).
3. Results
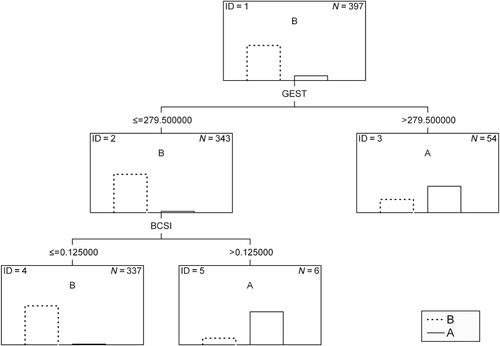
The layout of CART obtained in this study for the classification of calvings in dairy heifers is shown in . As can be seen, the predictor allowing for the best division of calving records in the tree root (ID = 1) was gestation length and the value of 279.5 days was selected as a threshold. On this basis, 54 animals (node ID = 3) were classified as dystotic ones (with a confidence of 66.7%) and 343 as easy calvers (with a confidence of 96.8%, ID = 2). In order to further divide the records in the second node (ID = 2), the CART algorithm chose BCSI, assuming 0.125 points as a threshold value. Animals whose BCSI was above this value were assigned to the ‘difficult calving’ category (with a confidence of 83.3%; ID = 5), whereas those with BCSI lower than or equal to the threshold were classified to the ‘easy calving’ category (with a confidence of 98.2%; ID = 4).
All node impurity measures (Gini index, chi-square and G-square statistics) resulted in the same tree structure and identical classification outcomes. The results of this classification (on the training set) are presented in .
Table 3. Sensitivity (Se), specificity (Sp), accuracy (Acc) and akaike information criterion (AIC) for individual models based on the training set (n = 397).
In the case of SVM, the final model included 67 support vectors, including 32 for the ‘difficult calving’ class and 35 for the ‘easy calving’ class. The decision constant was 4.48. The estimated parameters for GLZ are shown in . In the verification of the GLZ model, a significant deviation of residuals from the normal distribution was observed.
Table 4. The GLZ model parameters.
Classification results for CART, SVM and GLZ on the training set are given in . Statistically significant differences in sensitivity and specificity were noticed (P < 0.05) with the CART model characterized by the highest sensitivity and the GLZ model by the highest specificity. However, the AIC value depending also on the number of model parameters favoured GLZ. The most significant predictors for CART were as follows: GEST, BCSI and AGE (), whereas those for GLZ included: GEST, BCSI, SNABI and AGE (). Probabilities for individual models calculated based on the test set are presented in .
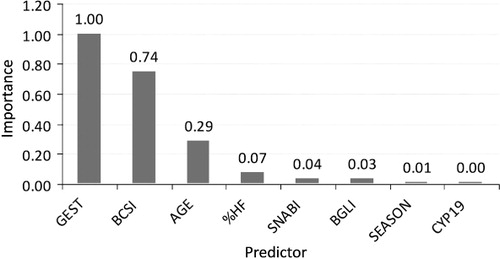
Table 5. Probabilities (in %) for individual models calculated based on the test set (n = 132).
Statistically significant differences (P < 0.05) between CART and the two remaining models were found in sensitivity (higher for CART), specificity (lower for CART), probability of false positive results (higher in the case of CART) and false negative results (lower in the case of CART) as well as the a-posteriori probability of true positive response (lower for CART).
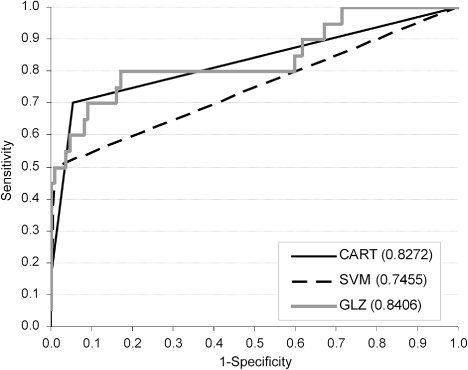
The ROC curves plotted based on the test set and their corresponding AUC values for CART, SVM and GLZ are shown in . The highest AUC value was characteristic of GLZ. A slightly smaller AUC was found for CART, whereas SVM had the lowest AUC value.
4. Discussion
In the case of CART model obtained in the present study, the first division of the whole data-set in the tree root node was based on gestation length. Somewhat different result was reported by Piwczyński et al. (Citation2013), who applied CART and chi-squared automatic interaction detector (CHAID) trees to the analysis of significant predictors of calving difficulty in dairy cows (Polish Holstein-Friesian Black-and-White breed). In that study, only the fourth partition was based on pregnancy length and this variable was used for splitting twice (at the threshold values of 282 and 284 days, respectively, which were similar to those in the present work).
The use of different node impurity measures for the CART model construction did not significantly affect classification results, similarly as in the study by Piwczyński et al. (Citation2013), where the misclassification rate was the same for Gini index and entropy function. In the case of GLZ, a significant deviation from the normal distribution of residuals was observed in the present study, which could negatively influence the value of test statistic (Stanisz Citation2007).
The values of sensitivity, specificity and accuracy obtained on the training set and showing the model quality can be regarded as high (). Only in the case of the first measure, there was quite a large difference in favour of CART, which was also confirmed statistically. In the work by Piwczyński et al. (Citation2013), the overall accuracy of dystocia detection in cows was 61.5% for both CART and CHAID, and so it was much lower than that in the present study. On the other hand, Zaborski and Grzesiak (Citation2011), in the classification of difficult calvings in dairy heifers using artificial neural networks, obtained higher sensitivity (89.1–90.9%), especially in comparison with SVM and GLZ in the present study, at lower specificity (88.3–89.6%) and accuracy (88.6–89.5%). The method of classification functions used for the same purpose (Zaborski Citation2010) gave much worse results in terms of sensitivity (60%) with comparable specificity (98%) and identical accuracy (93%). The application of discriminant function analysis to the prediction of difficult calvings in beef heifers was investigated by Basarab et al. (Citation1993), who obtained sensitivity in the range of 26–40% depending on heifer breed and the moment of prediction, which was much lower than that in the present study. However, specificity was similar (97%) and accuracy was also lower (85–89%) compared with those in the present work. In another study on dystocia prediction in beef heifers and cows using discriminant function analysis, Morrison et al. (Citation1985a,Citationb) recorded similar sensitivity (78–87%) with lower specificity (81–86%) and accuracy (82–85%). In other applications of CART to animal farming, Piwczyński et al. (Citation2013) obtained the accuracy on a training set of 94% when investigating stillbirths in dairy cows.
The next stage of the present study was the identification of variables with the greatest contribution to the determination of calving difficulty class. It should be emphasized that in the present study, only predictors available before calving were included. Therefore, factors with a documented effect on dystocia such as calf sex, its birth weight, the ratio of cow body weight to calf birth weight, etc., were not investigated. At present, despite quite commonly used ultrasonography for pregnancy diagnosis in dairy cattle, the sex of calves was not determined using this method, so this variable could not have been used either. The most significant predictor for CART and GLZ was pregnancy length (; ). This result is consistent with those of sensitivity analysis of the artificial neural networks applied to dystocia detection in heifers (Zaborski & Grzesiak Citation2011), and with the order of independent variables in discriminant function analysis used for the same purpose (Zaborski Citation2010). Also, in the study by Piwczyński et al. (Citation2013), in which the CART and CHAID trees were utilized, gestation length was an important predictor of calving category (third to fourth position according to the importance criterion applied). In general, both too short and too long gestation result in more frequent calving difficulties. Fiedlerová et al. (Citation2008) observed a significant non-linear relationship between gestation length in the Czech Holstein cows and calving difficulty, assuming the value of 275.8 days as an optimum number ensuring the easiest labour, which was very close to the threshold found in the present study. More difficult calvings in animals with shorter gestation, may result, among other things, from a higher calf perinatal mortality rate associated with an increased risk of labour complications (Johanson & Berger Citation2003), whereas in heifers with longer pregnancy duration, they may be a consequence of excessive calf birth weight (Mee Citation2008). According to the latest estimates (Nogalski & Piwczynski Citation2012), an optimal gestation length in the population of Polish Holstein-Friesian Black-and-White cattle in terms of calving ease and stillbirth risk was 275–277 days, whereas this value (in reference to calving ease) ranged between 274 and 279 days in US Holsteins (Norman et al. Citation2011). At a genetic level, only a weak genetic correlation (0.18–0.38) was found between gestation length and dystocia rate in the Danish Holstein cattle (Hansen et al. Citation2004).
The next significant factor for both CART and GLZ was BCSI, i.e. the difference between heifer's BCS assessed before calving and BCS at calving. This result is in line with the sensitivity analysis of artificial neural networks and the sequence of variables determined by discriminant function analysis (Zaborski Citation2010; Zaborski & Grzesiak Citation2011), as well as with the results obtained by Basarab et al. (Citation1993) in dystocia detection in beef heifers. An optimal BCS during the periparturient period ensures an easy calving. The currently recommended BCS in heifers is 2.75–3.00 points on a 5-point scale, which positively affects gestation length and reduces the risk of perinatal calf mortality (Lorenz et al. Citation2011). On the other hand, overconditioned heifers show a greater risk of dystocia and metabolic diseases in early lactation, whereas too thin ones do not reach an appropriate size and body weight at first calving (Schröder and Staufenbiel Citation2006). Nevertheless, a higher BCS does not always lead to a difficult labour, which may result from the difference in the growth of overfed heifers. This means that heifers utilizing additional energy for increasing the size of their frame and, to a lesser extent, calf birth weight may have relatively easy calvings, whereas those with excessive amounts of fat in the pelvic region, decreased lumen of the birth canal and weaker musculature of the uterus caused by overfeeding have more difficult calvings (Kolkman Citation2010). However, it should be added that not all authors are agreed that BCS significantly affects the course of parturition. For instance, Berry et al. (Citation2007) did not find such an association.
Calving age of heifers was also a significant factor contributing to the determination of calving difficulty category. In the aforementioned work on dystocia detection using artificial neural networks (Zaborski & Grzesiak Citation2011), this variable was less important, whereas discriminant function analysis confirmed its high significance (Zaborski Citation2010). Similar conclusions were drawn by Basarab et al. (Citation1993) in their study on dystocia detection in beef heifers. This variable played an important role in discriminant function models including variables available before breeding and during pregnancy. According to Mee (Citation2008), a higher risk of dystocia generally concerns very young and relatively older heifers, aged 2–3 years, although some authors (King et al. Citation1993; Ettema & Santos Citation2004) showed lack of a direct relationship between calving age and difficulty.
The last considered factor, indicated by GLZ, is the ERα-SnaBI genotype. However, its role in the CART model was negligible. As already mentioned, oestrogen receptors, including ERα, as transcription factors, enable the action of these hormones on target cells and tissues (Szreder & Zwierzchowski Citation2004). Moreover, it has been shown that ERα, together with glucocorticoids, may be involved in the labour-initiating mechanisms (Kimmins et al. Citation2003). However, it should be emphasized that despite the unquestionable role of oestrogens and their receptors in the reproduction process regulation, the latest molecular research has not revealed any significant effect of the polymorphism within the ERα gene investigated by the authors on calving difficulty, although it significantly affected calf sex (Szreder et al. Citation2011). From among other genes with a possible or confirmed effect on dystocia, the following should be mentioned: hedgehog interacting protein (HHIP), affecting direct calving difficulty and calf size; microRNA mir-1256 (MIR1256), associated with maternal calving difficulty, sialic acid binding Ig-like lectin 5 (Siglec-5), affecting sire and daughter calving ease, rump width, stature and body depth, genes coding for zinc finger proteins (e.g. zinc finger protein 827), which play an important role in the regulation of bone and skeletal development in mammals; genes coding for the insulin-like growth factor (IGF)-binding proteins (e.g. IGF-binding protein 2 precursor gene – IGFBP-2, IGF-binding protein-3 gene – IGFBP-3), which inhibit IGFs with IGFBP-2 hypothesized to act as a growth-promoting hormone during gestation (Cole et al. Citation2011; Purfield et al. Citation2014); the non-SMC condensin I complex, subunit G (NCAPG) gene, modulating foetal growth in cattle (Eberlein et al. Citation2009); the solute carrier family 44, member 5 (SLC44A5) gene, associated with dystocia rate (Sugimoto et al. Citation2012); the secreted phosphoprotein 1 (SPP1) gene, also known as osteopontin (OPN), the integrin-binding sialoprotein (IBSP) gene as well as the matrix extracellular phosphoglycoprotein (MEPE) gene included in a cluster of bone-tooth mineral extracellular matrix phosphoglycoproteins associated with bone and cartilage morphogenesis (Olsen et al. Citation2010); the cluster of differentiation 37 (CD37) gene, affecting direct calving difficulty (Cole et al. Citation2009); the IGF1 gene, influencing the incidence of twin pregnancies in cattle (Kim et al. Citation2009), the ribosomal protein S20 (RPS20) gene and the small nucleolar RNA U54 (SNORD54) gene, both of which affect foetal growth (Pausch et al. Citation2011) as well as the bone morphogenetic protein receptor type 1A (BMPRA1), growth differentiation factor 2 (GDF2), peptidoglycan recognition protein 1 (PGLYRP1) and IGF-like family member 1 (IGFL1) genes which are candidates for calving ease (Cole et al. Citation2011; Macciotta et al. Citation2014). In addition, polymorphisms within the growth hormone, growth hormone receptor and leptin genes were found to affect growth traits and gestation length in dairy breeds (Biswas et al. Citation2003; Giblin et al. Citation2010; Maltecca et al. Citation2011).
Other candidate genes for birth weight include phosphatidylinositol glycan anchor biosynthesis, class N (PIGN), KH domain containing, RNA binding, signal transduction associated 3 (KHDRBS3), ribosomal protein L22-like 1 (RPL22L1), LIM homeobox 4 (LHX4), zinc finger protein 75a (ZNF75A), ATP-binding cassette, sub-family A, member 12 (ABCA12), netrin G2 (NTNG1), regulatory factor X, 6 (RFX6), fibronectin leucine rich transmembrane protein 2 (FLRT2), mitogen-activated protein kinase kinase kinase 5 (MAP3K5), chromosome 21 open reading frame, human C14orf180 (NRAC), AMME, dystrophin (DMD), PP2R1A, ataxia telangiectasia mutated (ATM), BTG, CD33 and LIH1 (Cole et al. Citation2014). Moreover, genes related to both regulation of growth and response to hypoxic stress, i.e. protein tyrosine kinase 2 beta (PTK2B) and hypoxia inducible factor 1, alpha subunit (HIF1A), as well as the ghrelin/obestatin prepropeptide (GHRL) gene, which has been linked to foetal growth in other species, are candidates for gestation length and dystocia (Maltecca et al. Citation2011). Finally, polymorphisms within the guanine nucleotide-binding protein Gs subunit alpha (GNAS), paternally expressed gene 3 (PEG3), pregnancy-associated plasma protein-A2 (PAPP-A2) and placental growth factor (PGF) genes have recently been shown to affect direct and maternal calving difficulty (Magee et al. Citation2010; Seidenspinner et al. Citation2011; Sikora et al. Citation2011; Wickramasinghe et al. Citation2011). The remaining predictors (calving season and genotypes) did not play any important role in calving class determination.
After building and training the CART and SVM models and estimating parameters of GLZ, their performance was verified on new data that were not used previously for model construction (the so-called test set). Sensitivity (percentage of correctly diagnosed difficult calvings) was acceptable only in the case of CART (). SVM and GLZ were characterized by a low value of this measure, taking into account the fact that the dependent variable had only two categories. However, it should be emphasized that the number of difficult calvings in the training data-set was much smaller compared with the second class, which undoubtedly influenced detection results, whereas specificity (percentage of correctly diagnosed easy calvings) and accuracy (percentage of correctly recognized heifers from both classes) were high. In the study on dystocia detection in heifers using artificial neural networks, Zaborski and Grzesiak (Citation2011) obtained much higher sensitivity (75–83%) at lower specificity (82–88%) and accuracy (82–86%), while the application of discriminant function analysis and classification functions to this issue (Zaborski Citation2010) resulted in lower sensitivity (42%) at equally high specificity (97%) and accuracy (90%). The use of the aforementioned method for dystocia detection in Angus heifers was investigated by Arthur et al. (Citation1999), who obtained lower sensitivity (0–40%) and specificity (73–90%) than those in the present study. On the other hand, discriminant function analysis applied to the diagnosis of difficult calvings in heifers and cows with different proportion of Chianina genes (Morrison et al. Citation1985b) yielded the sensitivity of 57% (higher than that in the present study, except for CART), specificity of 90% and accuracy of 84% (lower than the values in the present work). However, one should bear in mind that the most important measure of detection performance of the models on new, previously unseen data, is sensitivity, which was not sufficiently high in our study (except for CART), although it was comparable with the above-mentioned results.
Additional detection measures calculated from the test set were the probability of FP and FN. The former is associated with an erroneous diagnosis of normal heifers as dystotic ones by the model, whereas the latter indicates the proportion of heifers with difficult calvings diagnosed as ‘easy calvers’. It is obvious that the second situation results in more serious consequences. Hence, it important to minimize P(FN). In the present work, P(FP) was very low () and P(FN) assumed relatively high values; however, this results directly from sensitivity and specificity obtained in the present study, since these measures are closely connected with each other, i.e. Se + P(FN) = 1 and Sp + P(FP) = 1. The above-mentioned authors (Morrison et al. Citation1985b; Basarab et al. Citation1993; Arthur et al. Citation1999) obtained similar or higher P(FP) (1–27%) and P(FN) was in quite a broad range of values (43–100%). The probabilities describing the reliability of diagnosing animals from both categories were P(PSTP) and P(PSTN), which assumed high values in the present study. They were higher or comparable with those of other authors (10–57% and 88–94%, respectively; Morrison et al. Citation1985b; Basarab et al. Citation1993).
In order to more comprehensively evaluate the detection performance of the CART, SVM and GLZ models, the ROC curves were plotted and the AUC values were computed (). These values in the present study were slightly lower than those in the detection of difficult calvings in heifers using artificial neural networks and classification functions (0.85–0.89; Zaborski Citation2010; Zaborski & Grzesiak Citation2011). For comparison, in the application of the CART and CHAID decision trees to the analysis of factors affecting dystocia and stillbirths in dairy cows (Piwczyński et al. Citation2013), the AUC values ranged from 0.61 to 0.71. However, it should be emphasized that the aforementioned values were calculated based on a training set or cross-validation.
One of the important aspects of developing statistical and data mining models is their possible use for minimizing the incidence of dystocia. As already mentioned, the course of parturition in cattle is affected by many factors. Some of them are difficult to capture and may occur without clear reasons. Others have been well described in the available literature. The use of factors that can be identified and that affect calving difficulty may, to some extent, determine its final outcome. The results of the present study and those of other authors show that the inclusion of these predictors in various statistical models may result in a greater precision of dystocia detection in heifers. This, in turn, may help to alleviate its disadvantageous consequences resulting in substantial economic losses. Additionally, when using data mining methods, it is possible to adjust prognosis depending on changing conditions. Moreover, the detection of heifers with dystocia, even if biased, is much more advantageous (the possibility of taking some countermeasures – greater supervision or veterinarian's assistance) than the situation in which difficult calving occurs without any prior information on it.
Finally, it should be stated that the present study is not free from limitations. One of them is a small sample size used for analysis. Although it was statistically justified, a larger number of training cases would be necessary to definitely confirm the results obtained in the present work. Moreover, calving records of heifers were collected on only one farm. The farm was large as on domestic scale (approx. 700 cows) and was one of many similar farms located in the province. It was situated in the lowland area; however, climatic conditions are similar within the country. Also, the practical application of the models in breeding practice would require their higher effectiveness in diagnosing dystotic animals in order to limit the costs associated with unnecessary help provision or intervention.
4. Conclusion
In conclusion, it should be stated that the best quality was characteristic of the CART model, which had also the best detection performance evaluated on new data that were not used previously for classification model construction. In the case of SVM and GLZ, percentage of correctly diagnosed animals with calving difficulties was relatively low. Therefore, the practical use of these models in animal farming would not be advisable. However, all presented methods were characterized by high specificity and reliability of the predictions being made. The most important variables determining calving category were gestation length, body condition score index, calving age and, to a lesser extent, ERα genotype. The two remaining genotypes (and calving season) did not significantly contribute to prediction accuracy. Future research should focus on the possibility of using different predictors and other data mining methods in order to achieve even better detection performance.
Funding
This work was supported by the Polish Ministry of Science and Higher Education [grant number 517-01-028-3962/17].
Additional information
Funding
References
- Aguiar GFM, Batista BL, Rodrigues JL, Silva LRS, Campiglia AD, Barbosa RM, Barbosa F. 2012. Determination of trace elements in bovine semen samples by inductively coupled plasma mass spectrometry and data mining techniques for identification of bovine class. J Dairy Sci. 95:7066–7073. 10.3168/jds.2012-5515
- Alsaaod M, Römer C, Kleinmanns J, Hendriksen K, Rose-Meierhöfer S, Plümer L, Büscher W. 2012. Electronic detection of lameness in dairy cows through measuring pedometric activity and lying behavior. Appl Anim Behav Sci. 142:134–141. 10.1016/j.applanim.2012.10.001
- Arthur PF, Archer JA, Melville GJ. 1999. Factors influencing dystocia and prediction of dystocia in Angus heifers selected for yearling growth rate. Crop Pasture Sci. 51:147–154. 10.1071/AR99070
- Barrier ACM. 2012. Effects of a difficult calving on the subsequent health and welfare of the dairy cows and calves [ dissertation]. Edinburgh: University of Edinburgh.
- Barrier AC, Haskell MJ, Birch S, Bagnall A, Bell DJ, Dickinson J, Macrae AI, Dwyer CM. 2012. The impact of dystocia on dairy calf health, welfare, performance and survival. Vet J. 195:86–90. 10.1016/j.tvjl.2012.07.031
- Barrier AC, Mason C, Dwyer CM, Haskell MJ, Macrae AI. 2013. Stillbirth in dairy calves is influenced independently by dystocia and body shape. Vet J. 197:220–223. 10.1016/j.tvjl.2012.12.019
- Basarab JA, Rutter LM, Day PA. 1993. The efficacy of predicting dystocia in yearling beef heifers: II. Using discriminant analysis. J Anim Sci. 71:1372–1380.
- Berry DP, Lee JM, Macdonald KA, Roche JR. 2007. Body condition score and body weight effects on dystocia and stillbirths and consequent effects on postcalving performance. J Dairy Sci. 90:4201–4211. 10.3168/jds.2007-0023
- Biswas TK, Bhattacharya TK, Narayan AD, Badola S, Kumar P, Sharma A. 2003. Growth hormone gene polymorphism and its effect on birth weight in cattle and buffalo. Asian-Australas J Anim Sci. 16:494–497.
- Breiman L. 1984. Classification and regression trees. Boca Raton (FL): Chapman & Hall.
- Cole JB, van Raden PM, O'Connell JR, van Tassell CP, Sonstegard TS, Schnabel RD, Taylor JF, Wiggans GR. 2009. Distribution and location of genetic effects for dairy traits. J Dairy Sci. 92:2931–2946. 10.3168/jds.2008-1762
- Cole JB, Waurich B, Wensch-Dorendorf M, Bickhart DM, Swalve HH. 2014. A genome-wide association study of calf birth weight in Holstein cattle using single nucleotide polymorphisms and phenotypes predicted from auxiliary traits. J Dairy Sci. 97:3156–3172. 10.3168/jds.2013-740910.3168/jds.2013-7409
- Cole JB, Wiggans GR, Ma L, Sonstegard TS, Lawlor Jr TJ, Crooker BA, Van Tassell CP, Yang J, Wang S, Matukumalli LK, Da Y. 2011. Genome-wide association analysis of thirty one production, health, reproduction and body conformation traits in contemporary U.S. Holstein cows. BMC Genomics. 12:408. 10.1152/physiolgenomics.00096.2006
- Dematawewa CMB, Berger PJ. 1997. Effect of dystocia on yield, fertility, and cow losses and an economic evaluation of dystocia scores for Holsteins. J Dairy Sci. 80:754–761. 10.3168/jds.S0022-0302(97)75995-2
- Eberlein A, Takasuga A, Setoguchi K, Pfuhl R, Flisikowski K, Fries R, Klopp N, Fürbass R, Weikard R, Kühn C. 2009. Dissection of genetic factors modulating fetal growth in cattle indicates a substantial role of the non-SMC condensin I complex, subunit G (NCAPG) gene. Genetics. 183:951–964. 10.1534/genetics.109.106476
- Ettema JF, Santos JEP. 2004. Impact of age at calving on lactation, reproduction, health, and income in first-parity Holsteins on commercial farms. J Dairy Sci. 87:2730–2742. 10.3168/jds.S0022-0302(04)73400-1
- Ferguson JD, Galligan DT, Thomsen N. 1994. Principal descriptors of body condition score in Holstein cows. J Dairy Sci. 77:2695–2703. 10.3168/jds.S0022-0302(94)77212-X
- Fiedlerová M, Řehák D, Vacek M, Volek J, Fiedler J, Šimeček P, Mašata O, Jílek F. 2008. Analysis of non-genetic factors affecting calving difficulty in the Czech Holstein population. Czech J Anim Sci. 53:284–291.
- Flamenbaum I, Wolfenson D, Kunz PL, Maman M, Berman A. 1995. Interactions between body condition at calving and cooling of dairy cows during lactation in summer. J Dairy Sci. 78:2221–2229. 10.3168/jds.S0022-0302(95)76849-7
- Giblin L, Butler ST, Kearney BM, Waters SM, Callanan MJ, Berry DP. 2010. Association of bovine leptin polymorphisms with energy output and energy storage traits in progeny tested Holstein-Friesian dairy cattle sires. BMC Genet. 11:73. 10.1186/1471-2156-11-73
- Grzesiak W, Zaborski D, Sablik P, Pilarczyk R. 2011. Detection of difficult conceptions in dairy cows using selected data mining methods. Anim Sci Pap Rep. 29:293–302.
- Gulliksen SM, Lie KI, Løken T, Østeråas O. 2009. Calf mortality in Norwegian dairy herds. J Dairy Sci. 92:2782–2795. 10.3168/jds.2008-1807
- Hansen M, Lund MS, Pedersen J, Christensen LG. 2004. Gestation length in Danish Holsteins has weak genetic associations with stillbirth, calving difficulty, and calf size. Livest Prod Sci. 91:23–33. 10.1016/j.livprodsci.2004.06.007
- Hastie T, Tibshirani R, Friedman J. 2009. The elements of statistical learning: data mining, inference, and prediction. 2nd ed. New York (NY): Springer.
- Haykin SS. 2009. Neural networks and learning machines. New York (NY): Prentice Hall.
- Hill T, Lewicki P. 2006. Statistics: methods and applications. Tulsa (OK): StatSoft Inc.
- Hokkanen A-H, Hänninen L, Tiusanen J, Pastell M. 2011. Predicting sleep and lying time of calves with a support vector machine classifier using accelerometer data. Appl Anim Behav Sci. 134:10–15. 10.1016/j.applanim.2011.06.016
- Hsu C-W, Chang C-C, Lin C-J. 2003. A practical guide to support vector classification [Internet]. [revised 2010 Apr 15; cited 2014 Jan 18]. Available from: https://www.cs.sfu.ca/people/Faculty/teaching/726/spring11/svmguide.pdf
- Ivakhnenko AG, Yurachkovskii YP. 1987. Modelirovanie slozhnykh sistem po eksperimental'nym dannym. Moscow: Radio i svjaz.
- Johanson JM, Berger PJ. 2003. Birth weight as a predictor of calving ease and perinatal mortality in Holstein cattle. J Dairy Sci. 86:3745–3755. 10.3168/jds.S0022-0302(03)73981-2
- Kim E-S, Shi X, Cobanoglu O, Weigel K, Berger PJ, Kirkpatrick BW. 2009. Refined mapping of twinning-rate quantitative trait loci on bovine chromosome 5 and analysis of insulin-like growth factor-1 as a positional candidate gene. J Anim Sci. 87:835–843. 10.2527/jas.2008-1252
- Kimmins S, Lim HC, Parent J, Fortier MA, MacLaren LA. 2003. The effects of estrogen and progesterone on prostaglandins and integrin beta 3 subunit expression in primary cultures of bovine endometrial cells. Domest Anim Endocrinol. 25:141–154. 10.1016/S0739-7240(03)00015-8
- King BD, Cohen RDH, McCormac S, Guenther CL. 1993. Maternal factors and the prediction of dystocia in beef heifers. Can J Anim Sci. 73:431–435. 10.4141/cjas93-045
- Kolkman I. 2010. Calving problems and calving ability in the phenotypically double muscled Belgian Blue breed [ dissertation]. Merelbeke: Ghent University.
- Koronacki J, Ćwik J. 2005. Statistical learning systems. Warsaw: WNT.
- Kowalewska-Łuczak I. 2010. Polymorphism of the CYP19 gene and milk production traits of dairy cattle. Turk J Vet Anim Sci. 34:493–496.
- Lorenz I, Mee JF, Early B, More SJ. 2011. Calf health from birth to weaning. I. General aspects of disease prevention. Ir Vet J. 64:10. 10.1016/j.applanim.2007.01.015
- Macciotta NPP, Dimauro C, Null DJ, Gaspa G, Cellesi M, Cole JB. 2014. Dissection of genomic correlation matrices of US Holsteins using multivariate factor analysis. J Anim Breed Genet. 10.1111/jbg.12113/full
- Magee DA, Sikora KM, Berkowicz EW, Berry DP, Howard DJ, Mullen MP, Evans RD, Spillane C, MacHugh DE. 2010. DNA sequence polymorphisms in a panel of eight candidate bovine imprinted genes and their association with performance traits in Irish Holstein-Friesian cattle. BMC Genet. 11:93. 10.1186/1471-2156-11-93
- Maltecca C, Gray KA, Weigel KA, Cassady JP, Ashwell M. 2011. A genome-wide association study of direct gestation length in US Holstein and Italian Brown populations. Anim Genet. 42:585–591. 10.1111/j.1365-2052.2011.02188.x
- Martiskainen P, Järvinen M, Skön J-P, Tiirikainen J, Kolehmainen M, Mononen J. 2009. Cow behaviour pattern recognition using a three-dimensional accelerometer and support vector machines. Appl Anim Behav Sci. 119:32–38. 10.1016/j.applanim.2009.03.005
- Mee JF. 2004. Managing the dairy cow at calving time. Vet ClinNorth Am Food Anim Pract. 20:521–546. 10.1016/j.cvfa.2004.06.001
- Mee JF. 2008. Prevalence and risk factors for dystocia in dairy cattle: a review. Vet J. 176:93–101. 10.1016/j.tvjl.2007.12.032
- Mee JF, Berry DP, Cromie AR. 2011. Risk factors for calving assistance and dystocia in pasture-based Holstein–Friesian heifers and cows in Ireland. Vet J. 187:189–194. 10.1016/j.tvjl.2009.11.018
- Meyer CL, Berger PJ, Koehler KJ, Thompson JR, Sattler CG. 2001. Phenotypic trends in incidence of stillbirth for Holsteins in the United States. J Dairy Sci. 84:515–523. 10.3168/jds.S0022-0302(01)74502-X
- Miekley B, Traulsen I, Krieter J. 2013. Mastitis detection in dairy cows: the application of support vector machines. J Agric Sci. 151:1–9. 10.1017/S0021859613000178
- Morrison DG, Humes PE, Keith NK, Godke RA. 1985a. Discriminant analysis for predicting dystocia in beef cattle. I. Comparison with regression analysis. J Anim Sci. 60:608–616.
- Morrison DG, Humes PE, Keith NK, Godke RA. 1985b. Discriminant analysis for predicting dystocia in beef cattle. II. Derivation and validation of a prebreeding prediction model. J Anim Sci. 60:617.
- Nebbia C, Urbani A, Carletti M, Gardini G, Balbo A, Bertarelli D, Girolami F. 2011. Novel strategies for tracing the exposure of meat cattle to illegal growth-promoters. Vet J. 189:34–42. 10.1016/j.tvjl.2010.06.016
- Nisbet R, Elder J, Miner G. 2009. Handbook of statistical analysis and data mining applications. Amsterdam; Boston (MA): Academic Press.
- Nogalski Z, Piwczynski D. 2012. 3 Association of length of pregnancy with other reproductive traits in dairy cattle. Asian Australas J Anim Sci. 25:22. 10.5713/ajas.2011.11084
- Norman HD, Wright JR, Miller RH. 2011. Potential consequences of selection to change gestation length on performance of Holstein cows. J Dairy Sci. 94:1005–1010. 10.3168/jds.2010-3732
- Olsen HG, Hayes BJ, Kent MP, Nome T, Svendsen M, Lien S. 2010. A genome wide association study for QTL affecting direct and maternal effects of stillbirth and dystocia in cattle. Anim Genet. 41:273–280. 10.1111/j.1365-2052.2009.01998.x
- Pausch H, Flisikowski K, Jung S, Emmerling R, Edel C, Götz K-U, Fries R. 2011. Genome-wide association study identifies two major loci affecting calving ease and growth-related traits in cattle. Genetics. 187:289–297. 10.1534/genetics.110.124057
- Pietersma D, Lacroix R, Lefebvre D, Wade KM. 2002. Decision-tree induction to interpret lactation curves. Can Biosyst Eng. 44:7.1–7.13.
- Pietersma D, Lacroix R, Lefebvre D, Wade KM. 2003. Induction and evaluation of decision trees for lactation curve analysis. Comput Electron Agric. 38:19–32.
- Piwczyński D, Nogalski Z, Sitkowska B. 2013. Statistical modeling of calving ease and stillbirths in dairy cattle using the classification tree technique. Livest Sci. 154:19–27. 10.1016/j.livsci.2013.02.013
- Piwczyński D, Sitkowska B. 2012. Statistical modelling of somatic cell counts using the classification tree technique. Archiv Tierzucht. 55:332–345.
- Piwczyński D, Sitkowska B, Wiśniewska E. 2012. Application of classification trees and logistic regression to determine factors responsible for lamb mortality. Small Ruminant Res. 103:225–231. 10.1016/j.smallrumres.2011.09.014
- Purfield DC, Bradley DG, Kearney JF, Berry DP. 2014. Genome-wide association study for calving traits in Holstein-Friesian dairy cattle. Animal. 8:224–235. 10.1017/S175173111300195X
- Purohit GN, Barolia Y, Shekher C, Kumar P. 2011. Maternal dystocia in cows and buffaloes: a review. Open J Anim Sci. 1:41–53. 10.4236/ojas.2011.12006
- Rodero E, Gonzalez A, Luque M, Herrera M, Gutierrez-Estrada JC. 2012. Classification of Spanish autochthonous bovine breeds. Morphometric study using classical and heuristic techniques. Livest Sci. 143:226–232. 10.1016/j.livsci.2011.09.022
- Schröder UJ, Staufenbiel R. 2006. Invited review: methods to determine body fat reserves in the dairy cow with special regard to ultrasonographic measurement of backfat thickness. J Dairy Sci. 89:1–14.
- Schuenemann GM, Nieto I, Bas S, Galvão KN, Workman J. 2011. Assessment of calving progress and reference times for obstetric intervention during dystocia in Holstein dairy cows. J Dairy Sci. 94:5494–5501. 10.3168/jds.2011-4436
- Seidenspinner T, Tetens J, Habier D, Bennewitz J, Thaller G. 2011. The placental growth factor (PGF)-A positional and functional candidate gene influencing calving ease and stillbirth in German dairy cattle. Anim Genet. 42:22–27. 10.1111/j.1365-2052.2010.02073.x
- Sikora KM, Magee DA, Berkowicz EW, Berry DP, Howard DJ, Mullen MP, Evans RD, MacHugh DE, Spillane C. 2011. DNA sequence polymorphisms within the bovine guanine nucleotide-binding protein Gs subunit alpha (Gsα)-encoding (GNAS) genomic imprinting domain are associated with performance traits. BMC Genet. 12:4. 10.1186/1471-2156-12-4
- Sokal RR, Rohlf FJ. 1995. Biometry. 3rd ed. New York (NY): W. H. Freeman & Co.
- Stanisz A. 2007. Handbook of statistical analysis in medicine using Statistica PL software: linear and nonlinear models. Cracow: StatSoft.
- StatSoft, Inc. 2013. Electronic statistics textbook [Internet]. Tulsa: StatSoft Inc.; [revised 2013 Jan 1; cited 2014 Jan 20]. Available from: http://www.statsoft.com/textbook/
- Sugimoto M, Watanabe T, Sugimoto Y. 2012. The molecular effects of a polymorphism in the 5′UTR of solute carrier family 44, member 5 that is associated with birth weight in Holsteins. PLoS One. 7:e41267. 10.1371/journal.pone.0041267.s003
- Szreder T, Oprzadek J, Zelazowska B, Dymnicki E, Zwierzchowski L. 2011. Polymorphism A/C in exon 7 of the bovine estrogen receptor alpha(ER alpha) gene and its association with functional and milk production traits in Red-and-White cattle. Anim Sci Pap Rep. 29:281–291.
- Szreder T, Zelazowska B, Zwierzchowski L, Pareek CS. 2007. A novel nucleotide sequence polymorphism in the 5′-noncoding region of bovine estrogen receptor α gene, the RFLP-SnaBI. Biochem Genet. 45:255–262. 10.1007/s10528-006-9072-8
- Szreder T, Zwierzchowski L. 2004. Polymorphism within the bovine estrogen receptor-alpha gene 5′-region. J Appl Genet. 45:225–236.
- Vanselow J, Kühn C, Fürbaß R, Schwerin M. 1999. Three PCR/RFLPs identified in the promoter region 1.1 of the bovine aromatase gene (CYP19). Anim Genet. 30:225–244.
- Wickramasinghe S, Rincon G, Medrano JF. 2011. Variants in the pregnancy-associated plasma protein-A2 gene on Bos taurus autosome 16 are associated with daughter calving ease and productive life in Holstein cattle. J Dairy Sci. 94:1552–1558. 10.3168/jds.2010-3237
- Witten IH, Frank E, Hall MA. 2011. Data mining: practical machine learning tools and techniques. Burlington (MA): Morgan Kaufmann.
- Zaborski D. 2010. Detection of difficult calvings in dairy cows using neural classifier [ dissertation]. Szczecin: ZUT.
- Zaborski D, Grzesiak W. 2011. Detection of heifers with dystocia using artificial neural networks with regard to ERα-BglI, ERα-SnaBI and CYP19-PvuII genotypes. Acta Scientiarum Polonorum Zootechnica. 10:105–116.