
Abstract
Energy use in the poultry sector has grown with increasing population and standard of living. The aim of this study was to determine energy use, energy efficiency and energy consumption for broiler and laying farms in the Bursa region of western Turkey. The data were collected using surveys with an interview-based questionnaire, which were administered at 29 broiler farms and 48 layer farms. An energy input–output analysis was performed, and the significance of energy consumption differences between broiler and layer farms was determined by an analysis of variance. The energy consumption of broiler and layer farms was found to be 438.568 and 516.848 MJ(1000 bird)−1, respectively, whereas energy output was 250.401 MJ(1000 bird)−1 for broiler farms and 384.690 MJ(1000 bird)−1 for layer farms. The forms of indirect energy and renewable energy in the total average energy inputs were higher than the direct and non-renewable energy forms for all the surveyed poultry farms. It was found that feed had the highest share among the energy inputs for both types of poultry farms. The results of energy use efficiency illustrate that energy in broiler farms was efficiently used, whereas energy use in layer farms was not efficient.
1. Introduction
Poultry (broilers and layers) are kept for the production of eggs and meat, and provide an acceptable form of animal protein to most people throughout the world. During the last decade, many developing countries have adopted intensive poultry production to meet the demand for this form of animal protein (FAO Citation2013).
According to the USDA (October 2012, Livestock and Poultry: World Markets and Trade; Anonymous Citation2013a), Turkey is ranked seventh highest in worldwide chicken meat production, at 1687 thousand tons of chicken meat, with more than 12,000 broiler establishments in the country. Using international technology and quality standards, Turkish poultry producers, which represent the largest animal source food producer in Turkey, play an important role in both animal food and poultry production. Poultry production continues to contribute to the country's economy, with approximately 2 million people making their living in poultry sector (producers, farmers, tradesmen, feed, medicine, feed industry, transportation, marketing and their families). The annual turnover of the sector is US$4.5 billion (Anonymous Citation2013b).
In recent years, the productions of eggs and poultry meat in Turkey have been increasing due to the being relatively low price, rapid reproduce and high rate of productivity of poultry. According to data obtained from the Turkish Statistical Institute (TUIK Citation2013), in 2012, the number of laying hens, broilers, eggs and chicken meat produced were approximately 85 million tons, 169 million tons, 15 million tons and 1.7 million tons, respectively.
Poultry production is an important sector within the animal production industry, and energy use in this sector has increased with the population and standard of living. These factors have encouraged an increase in energy inputs to maximize growth, feed efficiency and profitability, to minimize labour-intensive practices, or both (Atilgan & Koknaroglu Citation2006; Esengun et al. Citation2007). Efficient energy use in the poultry production is as significant as in agricultural production due to its potential to provide financial savings, preserve fossil fuel resources and reduce air pollution (Uzal Citation2012). Indeed, the efficient energy use, which helps to achieve increased production and productivity, and contributes to the economy and profitability, should be improved due to environmental and financial reasons (Kizilaslan Citation2009).
The planning and designing of poultry houses in Turkey has been conducted according to indoor environmental conditions such as indoor temperature, relative humidity and air velocity, ventilation system, evaporative cooling system, insulation and dimensions of the structural elements of the house. However, the energy use efficiency (EUE) of poultry production has not been evaluated for Turkey's specific conditions. The amount of energy used depends on the number of laying hens or broiler, the mechanization level and the amount of work performed in the poultry houses.
There have been many studies related to energy use in agriculture (Swanton et al. Citation1996; Pimentel et al. Citation1999; Uhlin Citation1999; Ozkan et al. Citation2004; Hatirli et al. Citation2005; Karkacier & Goktolga Citation2005; Kempen & Kraenzlein Citation2008; Kizilaslan Citation2009; Bekhet & Abdullah Citation2010; Unakitan et al. Citation2010; Banaeian & Zangeneh Citation2011; Asgharipoura et al. Citation2012; Tabatabaie et al. Citation2013). Moreover, many researchers worldwide have studied EUE in the poultry production sector, including broiler (Sibbald Citation1982; Andrews & Zimmermann Citation1990; Grobas et al. Citation1999; Atilgan & Koknaroglu Citation2006; Jekayinfa Citation2007; Heidari et al. Citation2011a) and laying hens (Ojo Citation2003; Yusuf & Malomo Citation2007; Ashagidigbi et al. Citation2011, Sefeedpari et al. Citation2012). However, there have been no studies related to the EUE of egg production and comparison of energy uses in laying hens and broiler production farms in Turkey.
The aim of this study is to evaluate the EUE of different poultry houses in the Bursa region of Turkey. Additionally, the comparison of energy uses for egg and broiler production was carried out in this study.
2. Materials and methods
2.1. Poultry houses and data collection
This study was conducted on poultry farms in the Bursa region of western Turkey. This region is an important production area for laying hens and broiler because of the suitable outdoor climatic conditions, location and population. Data were collected from 47 laying hen farms and 28 broiler farms. A questionnaire was performed with farmers to provide the appropriate information regarding energy usage. The capacities of the poultry farms varied in a wide range, from 3500 to 163,000 birds for laying hens and from 5000 to 300,000 birds for broilers. We asked questions of the farmers with regard to energy input and output parameters, including total feed and diesel consumption, total working hours of labourers and total electricity consumption.
2.2. Analysis of energy efficiency
EUE analysis compares energy input and output in poultry production farms. The considered energy input sources for poultry production were human labour, machinery, diesel fuel, electricity, chickens (chicks) and feed; the output energy sources considered were eggs, chicken meat and manure. Additionally, the energy input sources were classified into direct and indirect energy (IDE) use. All calculations were performed at the farm level on an annual basis. The energy equivalents used in this study for the estimation of energy inputs and outputs are given in .
Table 1. Energy equivalents of inputs and outputs in poultry farms.
2.3. Energy inputs
Energy inputs directly used for animal production, such as fuel energy (FE), electricity energy (EE) and human labour energy (HLE), are direct energy (DE) inputs. IDE inputs include machinery and feedstock that consume energy for poultry production.
2.3.1. Fuel energy
Fuel consumption in poultry houses was changed, depending on husbandry methods, manure removal and management systems. FE is generally consumed for manure removal, feed transportation and preparation in a poultry house. FE was calculated using Equation (1):
2.3.2. Electricity energy
The mechanization level of a poultry farm is the most important factor affecting the consumption of electricity. Poultry farms generally consume more EE than FE. The energy consumption for electricity was calculated using Equation 2:
2.3.3. Human labour energy (HLE)
In poultry production farms, human labour is needed for activities such as egg collection, feed distribution, chicken care and maintenance. HLE for the poultry production systems was calculated using Equation 3:
2.3.4. Machinery energy
Machinery energy consists of the conversion of electrical energy by equipment, such as the egg collection lift, feeder, drinker, mill, mixer, radiant and ventilation fans. Machinery energy included the energy consumption of all these implements in the poultry houses. The equivalent of machinery energy is provided in per 1000 birds.
2.3.5. Feedstock energy (FSE)
The feed formula used in poultry production must meet the demands of aims of the production. Although there is a difference between layer and broiler production in terms of feed formula, the feed formula for both must contain sufficient energy, minerals, protein, vitamins and water to supply vital functions and egg or meat production. The amount of energy contained in feed is generally expressed in units of metabolizable energy per kg feed, e.g., kilojoules per kg (kJ kg−1). FSE was calculated using Equation (4):
2.4. Energy outputs
The parameters of output energy for this study change according to the aims of poultry production. For laying hen production, the output energy parameters are eggs and manure, whereas the output energy parameters for broiler production are chicken meat and manure. Eggs and chicken meat, which are considered healthy foods in human nutrition, contain high levels of protein. Therefore, these poultry products are used to quickly overcome deficiencies in animal protein in humans. In types of animal manure, poultry manure has high nitrogen content and has also high mineral concentrations, such as calcium, phosphorus and potassium. Poultry manure is an important organic fertilizer for Turkish farmers due to its high nutrient content, though it may easily lose its nutrient content depending on the storage time and removal interval from the poultry house. The energy output was calculated by multiplying the amount of egg and meat production with the EE. All calculations were performed at the farm level.
2.5. Energy usage indicators
Following the analysis of energy input and output values, energy indicators, such as the EUE (Equation 5), energy productivity (EP; Equation 6) and net energy gain (NEG; Equation 7) were calculated based on their energy equivalents (Chauhan et al. Citation2006; Jekayinfa & Bamgboye Citation2008; Zangeneh et al. Citation2010).
2.6. Data analysis
The collected data were analysed using an analysis of variance (ANOVA) to determine the statistical significance of differences between farms. Additionally, descriptive statistics of energy analysis were calculated. The JUMP 7.0 software was used for all the statistical analyses in this study.
3. Results and discussion
3.1. Production parameters
The descriptive statistics, including average, minimum and maximum, for the production parameters at the surveyed poultry farms are given in . The average number of birds was 67,146 for the broiler houses and 22,742 for the layer houses. These capacities are common among Turkish poultry houses. The land presence varies from 0.6 da to 4000 da for both types of farm. The surveys indicated that the broiler farms occupy more land than the layer farms. The average feed consumption is 814 tons year−1 for broiler and 966 tons year−1 for laying hens. These values of production parameters are consistent with the overall Turkish poultry sector.
Table 2. Some descriptive statistics for production parameters at the surveyed poultry farms.
3.2. Energy inputs in poultry houses
The average total energy consumption of the surveyed poultry houses was 438.568 MJ(1000 bird)−1 for the broiler houses and 516.848 MJ(1000 bird)−1 for the layer houses. presents a comprehensive summary of the average energy inputs for the broiler and layer houses. According to our results, the IDE input was more than the DE input for both types of poultry production. Additionally, the IDE input in the broiler and laying hen houses comprised approximately 99% and 96%of the total energy use, respectively. Similar results were found that the highest input was IDE input in dairy farms (Uzal Citation2012).
Table 3. Annual average energy consumption (inputs) at the surveyed poultry farms.
The distribution of energy inputs for the surveyed poultry houses is given in . When comparing DE inputs, electricity is the highest input with 3547 and 3691 MJ(1000 bird)−1 for the broiler and laying hens houses, respectively. Electricity was consumed in the management systems by activities such as automatic feeding and watering, egg collection, mechanical ventilation, heating and cooling systems, manure removing and lighting equipments. Natural or artificial lighting was the most important issue for producing more eggs at the layer farms. Feed energy was the highest input among the IDE inputs, at 70% for broiler farms and 79% for layer farms ().
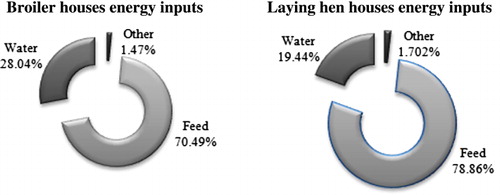
The observed feed energy in our study is consistent with percentage for different animal production systems from literature: 69% (Meul et al. Citation2007). The feed energy is primarily composed of carbohydrates, fat and amino acids, and birds must consume feed with a high energy content to provide sufficient metabolic energy to produce eggs and meat. Although an opportunity to attain sufficient feed was presented to the birds at the surveyed broiler and layer farms, the birds were unable to feed ad libitum. The required machinery energy in the broiler and layer houses was 279 and 337 MJ, respectively. The management practices, such as feed and water distribution, manure and egg collection in broiler and layer farms, require machinery energy. The share of water energy was found to be the second highest input for the surveyed poultry houses.
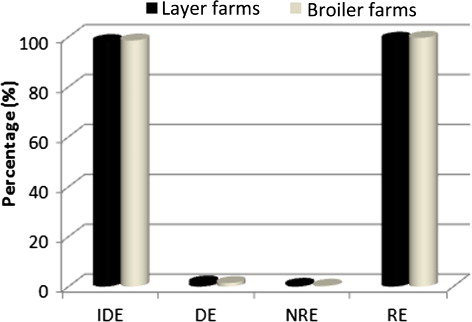
The percentages of DE, IDE, renewable energy (RE) and non-renewable energy (NRE) obtained are given in . RE and IDE were more than NRE and DE for both the broiler and layer farms. RE was nearly 99%, whereas IDE was nearly 98%. The calculated RE and IDE values in this study appear to be comparable to the values of a study performed by Uzal (Citation2012) in Turkey.
3.3. Energy outputs in poultry houses
The energy output values obtained from the surveyed poultry farms are given in . The distribution of output energy in the poultry farms was as follows: 13.75% of total energy for chicken meat and 86.25% for manure at the broiler farms; 5.07% for chicken meat, 66.88% for manure and 28.05% for eggs at the layer farms.
Table 4. Annual average energy outputs at the surveyed poultry farms.
3.4. Analysis of EUE
The analysis of EUE in any production system considers energy balance and energetic parameters, such as EUE, EP, specific energy (SE) and NEG. The goal of this analysis is to assess the performance of production systems.
shows our results of the analysis of EUE in the surveyed poultry houses. The EUE for the broiler and layer farms was calculated to be 0.94 and 0.68, respectively. EUE for the broiler farms showed that there was efficient energy use at these farms; however, the energy use at the layer farms was inefficient. The EUE value for the layer farms can be increased by increasing egg yield and decreasing energy consumption. There are various methods to decrease energy consumption in layer farms, which stem from changing the feed formula given to the birds. Low-protein diets, high-fibre diets and low-lysine diets function to decrease the energy consumption of laying hens.
Table 5. Analysis of energy efficiency at the surveyed poultry farms.
EP was obtained as 0.3 kg MJ−1 for the broiler farms and 0.59 kg MJ−1 for the layer farms in this study. These values were higher compared to those published by Heidari et al. (2Citation011a).
In the evaluation of EUE in production systems, one of the most important indicators is the SE consumption. This value consists of energy use for per unit of physical output of the production system. In our study, the SE use was 3.34 MJ kg−1 for the broiler farms and 1.71 MJ kg−1 for the layer farms. The SE use obtained for the broiler farms was comparable to the values of 3.09 MJ kg−1 found by Ramirez et al. (Citation2006) for European broiler farms.
3.5. Comparison of broiler and egg production
When comparing the broiler and layer farm energy inputs and outputs, all the energy inputs of the surveyed layer farms were found to be higher than those of the broiler farms, except with regard to chick and water energy inputs. In terms of energy outputs, the chicken meat energy output of the broiler farms was higher than that of the layer farms, though more manure was produced in the layer farms than the broiler farms. Layer farms under the conditions of Turkey require more energy for egg collection and manure removal systems. Similarly, the feed and water distribution systems at broiler farms require more energy. Furthermore, layer farms generally use cage systems for rearing, whereas broiler farms rear chickens on litter.
In this study, a one-way ANOVA was performed to evaluate the statistical significance of the differences between the energy inputs and outputs of broiler and layer farms. The results of this analysis are shown in . The differences of all the energy inputs, except electricity, and all the energy outputs between the broiler and layer houses were statistically significant (p < .001).
Table 6. Significance of differences between broiler and layer farm energy usage.
4. Conclusion
This study attempted to analyse the energy consumption of the inputs and outputs of broiler and layer farms in the Bursa region of western Turkey. Data were collected from 47 layer farms and 28 broiler farms using a questionnaire methodology. Our results showed that the surveyed poultry farms consume a total energy of 438.568 MJ(1000 bird)−1 for the broiler houses and 516.848 MJ(1000 bird)−1 for the layer houses.
The results of this study illustrate that modern and well-established scientific practices in broiler and layer farms in our region should be used to obtain a balance of increased economic benefits with more energy efficiency. Regarding efficient energy use and the maintenance of a clean environment, the excessive use of energy inputs in poultry farms should be prevented through basic practices in broiler and laying hen management. Feed, which is the highest energy input, should be provided according to optimal consumption rates and should be composed of a low-protein formula. These practices would be useful for increased energy efficiency and also for the reduction of pollutant gas emissions, such as ammonia, methane and hydrogen sulphide. Well-designed feeders and a properly working feed distribution system would help to achieve optimal feed consumption and prevent feed loss. Optimal feed and fuel consumptions will provide sustainable production via decreasing costs of production and also reduce negative or detrimental effects of animal production on environment and health of community living in the surrounding neighbourhoods. To reduce fuel and electricity consumptions of farms and achieve energy efficiency targets, producers should focus on using clean or green energy species, such as solar and wind energies. Bursa region's climate conditions are very suitable to produce wind and solar energies. In our region, there are pioneer clean energy firms which offer service whole country wide. They have enough knowledge to set up clean energy production systems. Nowadays, our government encourages farmers to produce clean energy on the basis of farmers via giving some financial aid about installation of clean energy production systems. The poultry producers monitored in this study can easily use solar panels to produce solar energy on roof of their poultry houses. Therefore, they can produce some energy to use for production management process and provide clean energy to fulfil some of energy demand for poultry productions. Another option for poultry producers is biogas production to produce clean energy. Because, they have enough manure as a raw material for bio-energy production. Thus, they can manage their manure by an environmental-friendly application. As a result of clean energy usage, they can reduce NRE usage via catching optimal FE consumption.
One of the results of our survey of broiler and layer producers is that the producers were not conscious of the energy savings on their farms. We observed that the producers did not keep accurate records of their energy consumption. The success of energy saving depend on keeping accurate records of the energy consumption. Thus, to save energy, producers should account for all metrics regarding electricity and diesel FE consumption and keep monthly records of them. Also, producers should compare their monthly bills and records. To reduce diesel FE consumption in poultry production facilities, every poultry producer should assure a market in near farm and permanent demand for poultry products, such as egg and broiler meat. When new poultry farm is established, energy usage efficiency should be considered, where animal welfare and proper housing systems should be selected to achieve higher energy usage efficiency as well.
Acknowledgement
The authors acknowledge the support of the Uludag University Research Projects Unit for this study (Project No. OUAP(Z)-2012/21).
Disclosure statement
No potential conflict of interest was reported by the author.
References
- Andrews DK, Zimmermann NG. 1990. A comparison of energy efficient broiler house lighting sources and photoperiods. Poult Sci. 69:1471–1479.
- Anonymous. 2002. The composition of foods. 6th ed. London: Royal Society of Chemistry/Food Standards Agency.
- Anonymous. 2013a. Livestock and Poultry. Ithaca (NY): World Markets and Trade. [cited 2013 Nov 2]. Available from: http://usda.mannlib.cornell.edu
- Anonymous. 2013b. Summary Report of Poultry Sector for 2013, Poultry Meat Producers and Breeders Association Ankara, Turkey. [cited 2013 Nov 7]. Available from: http://www.besd-bir.org/eng/sektor_bilgileri.php
- Anonymous. 2014. CP. Istanbul: Layer chicken feed characteristics. [cited 2014 Jan 4]. Available from: http://www.cpturkiye.com/tr/urunler/yem/kanatli-hayvan-yemleri/yumurta-tavugu-yemleri/
- Asgharipoura MR, Mondani F, Riahinia S. 2012. Energy use efficiency and economic analysis of sugar beet production system in Iran: a case study in Khorasan Razavi province. Energy. 44:1078–1084.
- Ashagidigbi WM, Sulaiman SA, Adesiyan A. 2011. Technical and allocative efficiency of poultry egg producers in Nigeria. Agric J. 6:124–130. 10.3923/aj.2011.124.130
- Atilgan A, Koknaroglu H. 2006. Cultural energy analysis on broilers reared in different capacity poultry houses. Ital J Anim Sci. 5:393–400.
- Banaeian N, Zangeneh M. 2011. Study on energy efficiency in corn production of Iran. Energy. 36:5394–5402.
- Bekhet HA, Abdullah A. 2010. Energy use in agriculture sector: input-output analysis. Int Bus Res. 3:111–121.
- Bock BR. 1999. Poultry litter to energy: technical and economic feasibility. Alabama: TVA Public Power Instute.
- Celik LO. 2003. Effects of dietary supplemental L-carnitine and ascorbic acid on performance, carcass composition and plasma L-carnitine concentration of broiler chicks reared under different temperature. Arch Anim Nutr. 57:27–38.
- Chauhan NS, Mohapatra PKJ, Pandey KP. 2006. Improving energy productivity in paddy production through benchmarking-an application of data envelopment analysis. Energy Convers Manage. 47:1063–1085.
- Esengun K, Gündüz O, Erdal G. 2007. Input-output energy analysis in dry apricot production of Turkey. Energy Convers Manage. 48:592–598.
- FAO. 2013. [cited 2013 Nov 12]. Available from: http://www.fao.org
- Fluck RC. 1992. Energy of human labor. In: Fluck RC, editor. Energy in farm production. Energy in world agriculture, (vol 6). Amsterdam: Elsevier; p. 31–37.
- Grobas S, Mendez J, De Blas C, Mateos GG. 1999. Laying hen productivity as affected by energy, supplemental fat, and linoleic acid concentration of the diet. Poult Sci. 78:1542–1551.
- Hatirli SA, Ozkan B, Fert C. 2005. An econometric analysis of energy input–output in Turkish agriculture. Renewable Sustainable Energy Rev. 9:608–623.
- Heidari MD, Omid M, Akram A. 2011a. Energy efficiency and econometric analysis of broiler production farms. Energy. 36:6536–6541. 10.1016/j.energy.2011.09.011
- Heidari MD, Omid M, Akram A. 2011b. Optimization of energy consumption of broiler production farms using data envelopment analysis approach. Mod Appl Sci. 5:69–78.
- Jekayinfa SO. 2007. Energetic analysis of poultry processing operations. Leo J Sci. 10:77–92.
- Jekayinfa SO, Bamgboye AI. 2008. Energy use analysis of selected palm-kernel oil mills in south western Nigeria. Energy. 33:81–90.
- Karkacier O, Goktolga GZ. 2005. Input–output analysis of energy use in agriculture. Energy Convers Manage. 46:1513–1521.
- Kempen M, Kraenzlein T. 2008. Energy use in agriculture: a modeling approach to evaluate energy reduction policies. Sevilla: Modelling of Agricultural and Rural Development Policies.
- Kitani O. 1999. Energy and biomass engineering. CIGR handbook of agricultural engineering, (vol. V). St. Joseph, MI: ASAE; p. 330.
- Kizilaslan H. 2009. Input–output energy analysis of cherries production in Tokat Province of Turkey. Appl Energy. 86:1354–1358.
- Meul M, Nevens F, Reheul D, Hofman G. 2007. Energy use efficiency of specialised dairy, arable and pig farms in Flanders. Agric Econ Environ. 119:135–144.
- Ojo SO. 2003. Productivity and technical efficiency of poultry egg production in Nigeria. Int J Poult Sci. 2:459–464. 10.3923/ijps.2003.459.464
- Ozkan B, Kurklu A, Akcaoz H. 2004. An input–output energy analysis in greenhouse vegetable production: a case study for Antalya region of Turkey. Biomass Bioenergy. 26:89–95. 10.1016/S0961-9534(03)00080-1
- Pimentel D, Pimentel M, Machan MK. 1999. Energy use in agriculture: an overview. CIGR J. 1:1–32.
- Ramirez CA, Patel M, Blok K. 2006. How much energy to process one pound of meat? A comparison of energy use and specific energy consumption in the meat industry of four European countries. Energy. 31:2047–2063.
- Sefeedpari P, Rafiee S, Akram A. 2012. Selecting energy efficient poultry egg producers: a fuzzy data envelopment analysis approach. Int J Appl Oper Res. 2:77–88.
- Sibbald IR. 1982. Measurement of bioavailable energy in poultry feeding stuffs: a review. Can J Anim Sci. 62:983–1048.
- Swanton CJ, Murphy SD, Hume DJ, Clements DR. 1996. Recent improvements in the energy efficiency of agriculture: case studies from Ontario, Canada. Agric Sys. 52:399–418.
- Tabatabaie SMH, Rafiee S, Keyhani A, Ebrahimi A. 2013. Energy and economic assessment of prune production in Tehran province of Iran. J Clean Prod. 39:280–284.
- TUIK. 2013. Animal production statistics. Ankara: Turkish Statistical Instute. [cited 2013 Nov 1]. Available from: http://www.tuik.gov.tr
- Uhlin HE. 1999. Energy productivity of technological agriculture-lessons from the transition of Swedish agriculture. Agric Ecosyst Environ. 73:63–81. 10.1016/S0167-8809(99)00002-X
- Unakitan G, Hurma H, Yilmaz F. 2010. An analysis of energy use efficiency of canola production in Turkey. Energy. 35:3623–3627.
- Uzal S. 2012. Comparison of the energy efficiency of dairy production farms using different housing systems. Environ Prog Sust Energy. 32:1202–1208.
- Yusuf SA, Malomo O. 2007. Technical efficiency of poultry egg production in Ogun state: a data envelopment analysis (DEA) approach. Int J Poult Sci. 6:622–629. 10.3923/ijps.2007.622.629
- Zangeneh M, Omid M, Akram A. 2010. A comparative study on energy use and cost analysis of potato production under different farming technologies in Hamadan province of Iran. Energy. 35:2927–2933. 10.1016/j.energy.2010.03.024