
Abstract
Thirty-six goats: 15 Alpine (AG), 13 Saanen (SG) and 8 Anglo-Nubian (ANG) were used to evaluate dry matter intake (DMI), body weight (BW) changes and milk production to validate Wood's model in lactation curves. The kids pre-weaning weight, weaning weight (WW) and daily weight gain (DWG) were determined. Milk production was measured daily for a period of 90 d. The DWG was quantified daily, while BW was recorded weekly. Performance of 48 kids (20 AG, 15 SG and 13 ANG), aged 15 d were evaluated. Wood's model was utilised to describe goat's lactation curve in the different studied goat breeds. Milk production was differed between breeds and according to the number of kids suckled (P < 0.05). Both of DMI and BW showed a linear increase (P < 0.05) during the studied period. Both of WW and DWG were unaffected by type of kidding and breed and were higher in males than in females. It is suggested that equation of Wood's model is adequate to describe the lactation curve in studied goat breeds. The ANG and AG breeds versus SG had more persistence for milk production which was higher for those with single type of birth than those with twins.
1. Introduction
Cow milk is globally used for human consumption; however, a small amount of sheep and goat milk is also used (Bilgin et al. Citation2010). Goat production in Mexico takes place primarily in arid and semiarid environments, under production systems with scarce technology, where most of the farmers come from a social stratum characterised by limited economic resources and limited technical knowledge (Cantú Citation2008). Alpine (AG), Saanen (SG) and Anglo-Nubian (ANG) goats are the most famous dairy goat breeds in Mexico (Shrestha Citation2012). The SG is best known of the goat world, producing high milk yields with low fat levels compared to the ANG breed which produces less milk with higher fat and protein content (Haenlein & Caccese Citation1984). The AG breed produces milk yields between the levels of the SG and ANG in general but with some individual exceptions (Park & Haenlein Citation2010). The average milk production and composition for the three breeds are: SG, 1325 kg milk/season with 31 and 41 g protein and fat/kg, respectively; AG, 1135 kg milk/season with 32.7 and 43 g protein and fat/kg, respectively; ANG, 840 kg milk/season with 38.5 and 56 g protein and fat/kg, respectively (Ruth Citation2012). Approximately, 31% of the world goats are dairy goats in the developed countries compared with only 19% for the developing world. According to the FAO (Citation2014), goats produced approximately 2.4% of the world’s total milk supply during 2012.
Lactation curves have a wide variety of applications that may be used in genetic evaluations (Schaeffer Citation2004), formulation of rations and economic evaluation of different management strategies (Dag et al. Citation2005; Keskin & Dag Citation2006). Previous knowledge with the expected peak yield will help for arrange the feeding strategy to allow economic management of feed for covering the animal’s requirement, reduce cost and possibly maintain peak yield for as long as possible (Amin Citation2003; Grzesiak et al. Citation2003).
Several models of lactation curves have been developed. Wood’s model developed by Wood (Citation1967) is the most well known and commonly employed mathematical model, specifically applied (Swalve & Guo Citation1999). Productive performance through lactation is similar, in both, in cattle as in goats, making it possible to describe the lactation curve of goats using the model most commonly used in cattle (Wood Citation1967; Gipson & Grossman Citation1990). Ortiz et al. (Citation1988) assessed weight changes associated with lactation, and the differences in physical behaviour at different conditions presented by the rangelands throughout the year, and concluding that animals calving at the beginning of the drought season show loss of weight from this moment, achieving weight gain during the rainy season.
The present study aimed to quantify the milk production per lactation and evaluate if the Wood’s model can be used for describing the lactation curve in Alpine, Saanen and Anglo-Nubian goat suckling their kids and to determine the voluntary intake and weight performance of goats during lactation, in addition to evaluating the pre-weaning growth in their offspring.
2. Materials and methods
2.1. Study site
The current study was carried out at the experimental farm of the Universidad Autónoma Chapingo, México, located at 19°30′ N latitude and 98°54′ W longitude, at 2250 m above sea level. Weather in this region is classified as sub-humid temperate with summer rains. The average annual temperature and rainfall are 15°C and 600 mm, respectively (INEGI Citation2009).
2.2. Experimental animals and feeding
Thirty-six goats undergoing their first and second kidding (15 AG, 13 SG and 8 ANG), all of them with their offspring, were selected from a commercial flocks. Does were managed in a confined system and were kept in roofed pens, and separated by type of kidding (single or twins). Daily in the pen, goats received per head 1.2 kg of dry matter (DM) of alfalfa hay, 0.08 kg of rumen bypass fat (Megalac©, Arm & Hammer Animal Nutrition©, Princeton, NJ, USA), as well 2 kg of concentrate (), with free access to water.
Table 1. Ingredients and chemical composition of the concentrate.
Goats were fed twice daily in equal amounts at 07:00 and 15:00 h, where dry matter intake (DMI) was estimated daily by the difference between weight of offered and refused feeds. Goats live weight (LW) was obtained at intervals of 10 d after the beginning of the experiment before offering early morning ration.
Forty-eight kids (20 AG, 15 SG and 13 ANG) aged about 15 d were used also in the current study. Kids were separated from their mothers and allowed only to access milk from their mothers at 07:00 and 15:00 h daily where each kid was weighed before suckling. Kids were daily weighed from the beginning of the experiment and until weaning was performed for determination of milk intake, daily weight gain (DWG) and weaning weight (WW). Feeding kids was supplemented by creep feeding, with the same feed () that mother goats consumed at rate of 55 g/kid/d until the weaning was done.
2.3. Data and management
The technique described by Coombe et al. (Citation1960) was used to determine the daily milk production; consistent in the method of weight-suckling-weight of the goat kids, adding residual milk; repeating the procedure daily until 90 d when weaning was performed.
The prediction equation for daily milk yield was fitted by the Wood’s (Citation1967) incomplete gamma function: Yt = atbe−ct; where Yt is the milk parameter on lactation day t, a is the associated parameter with the initial milk production, b is the associated parameter with the rise in milk production to peak lactation, e is the Neper number and c is the associated parameter with the decrease in milk production from peak to the end of lactation. Wood’s model was linearised through the natural logarithm as: ln(Yt) = ln(a) + bln(t) – ct. After the transformation process, parameters that define the incomplete gamma function (i.e., a, b and c) were estimated through multiple regression; for breed and type of kidding. Following, some lactation curve parameters were obtained, as: days to maximum milk production (TPY), by the following formula TPY = b/c; the maximum production (YP), by YP = a(TPY)be−b; the rate of decrease from peak to end of lactation (persistence), as persistence = c(TPY – t/TPY + t); predicted total production (PTP) by PTP = ∑atbe−ct; and observed total production (OTP) calculated by the sum of milk production recorded daily during the experimental period of 90 d.
2.4. Concentrates analytical procedures
Samples of concentrate mixture were collected twice weekly, ground to pass a 1-mm screen on a model 4 Wiley Mill and analysed according to the AOAC (Citation1997) for DM (method 934.01) and crude protein (Nitrogen × 6.25; method 990.03). The neutral detergent fibre (Van Soest et al. Citation1991) and acid detergent fibre (AOAC Citation1997; 973.18) analyses used an ANKOM200 Fibre Analyser Unit (ANKOM Technology Corp., Macedon, NY, USA). Neutral detergent fibre was assayed without use of an alpha amylase but with sodium sulphite in the NDF. Both neutral detergent fibre and acid detergent fibre are expressed without residual ash. Ash was determined by incineration at 550°C for 3 h (AOAC Citation1997; method 942.05).
2.5. Statistical analysis
To determine the effects of breed and type of kidding on the parameters of the lactation curve, data were analysed to estimated regression coefficients through the following model: Yijk = µ +B i + RTj + εijk, where Yijk is a curve parameter observation (a, b, c, TPY, PTP, YP, OTP and persistence); µ is the mean population; B i is the effect of the ith breed (i = AG, SG, NG); RT j is the effect of the jth type of kidding (j = single, twins); εijk is the random error => NID (0, σ 2 e).
Data of DMI were analysed using the following model: Yij = µ + B i + β 1(t) + εij, where Yij is the DMI observation; µ is the mean population; Bi is the effect of the ith breed (i = AG, SG, ANG); β1 is the partial regression coefficient; t is the lactation day; εij is the random error => NID (0, σ2e).
Factors which affect the LW of lactating goats were analysed under the following model: Yijk = µ + B i + RTj + β1(t) + εijk, where Yijk is the LW observation; µ is the mean population; Bi is the effect of the ith breed (i = AG, SG, ANG); RTj is the effect of the jth type of kidding (j = single, twins); β1 is the partial regression coefficient; t is the lactation day; εij is the random error => NID (0, σ2e).
Data of DWG and WW in kids were analysed using the following model: Yijkl = µ + Bi + RTj + Sk + β1(iLW) + εijkl, where Yijkl is the DWG and WW observation; µ is the mean population; Bi is the effect of the ith breed (i = AG, SG, ANG); RTj is the effect of the jth type of kidding (j = single, twins); Sk is the effect of the kth sex (k = male, female); β1 is the partial regression coefficient; iLW is the initial LW of the kid used as covariate; εijkl is the random error => NID (0, σ2e).
3. Results
3.1. Goat’s locational curves
Regression coefficients of the equation of Wood lactation curve showed that different breed had a different (P < 0.05) a, b and c parameters. Alpine breed, followed by SG and then ANG breed begin lactation season with higher (P < 0.05) milk production (). However, SG breed obtained a higher (P < 0.05) rate of increased milk production with less persistence of milk yield and more c value compared to both of AG and ANG, which almost had the same b and c values. Type of kidding (i.e., single or twin suckled lambs) had affected (P < 0.05) each of a, b and c (). Goat suckled twins had higher a, b and c values than those suckled single kids. However, lactating goats with one kid have a lower initial production and rate of increase, likewise as a greater persistence during lactation ( and ).
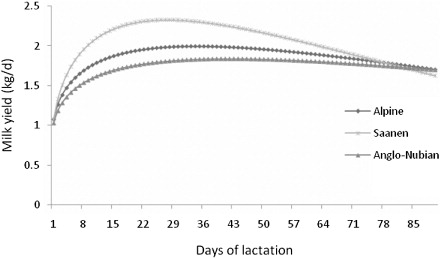
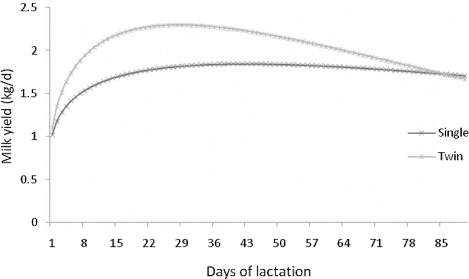
Table 2. Regression coefficients of the equation of Wood lactation curve by breed and type of birth.
3.2. Milk yield production
Anglo-Nubian goat breed had the highest (P < 0.05) TPY with the lowest (P < 0.05) maximum production per day (YP), PTP, OTP, and persistence. However, inversed trends were observed (P < 0.05) with the SG breed. With exception of TPY, all of YP, PTP, OTP, and persistence were higher (P < 0.05) for goats with twin suckled kids than those with single suckled kids ().
Table 3. Days at maximum milk production (TPY), maximum production per day (YP), persistence (PER), predicted total production (PTP) and total yield observed (OTP).
3.3. Dry matter intake, live and weaning weight
Alpine breed followed with SG breed consumed higher (P < 0.05) feed DM than ANG breed (). However both of ANG and AG breeds were heavier (P < 0.05) than SG breed (). Breeds type (i.e., AG, SG and ANG) and kidding type (i.e., single or twin suckled lambs) were a non-influential factors (P > 0.05) on each of WW or DWG. However, sex of suckled kids significantly (P < 0.05) affected both of WW and DWG; male suckled kids had higher WW and DWG compared to female suckled kids ().
Table 4. Dry matter intake and live weight in lactating goats according to breed.
Table 5. Goat kids weaning weight and daily weight gain according to breed, type of kidding and sex.
4. Discussion
4.1. Lactation curve and milk yield production
Wood lactation curve parameters were significantly affected by breed type. Under the study condition, AG breed started the lactation season with higher milk production than the other two breeds with a higher increased milk production rate. These findings are consistent with those obtained by Sánchez et al. (Citation2006) for ANG goats with no differences between Creoles and Celtiberic goat breeds. In another study, Arbiza (Citation1987) mentioned that ANG goats had a lower persistence than Toggenbourg goats, which reported a positive correlation with the parameter b; indicating a higher rate of increased greater persistence. Salvador et al. (Citation2006) showed that the correlation between milk production per day with days in production was 0.32 (P < 0.01), which indicated that as the goats produce more milk per day, will had more extended days in lactation; increased production days should increase total milk production. Moreover, Capote et al. (Citation1999) showed increased milk production with increasing milking frequency.
Analysing the effect of kidding type (i.e., single or twins) on parameters of the lactation curve (i.e., a, b and c); differences were observed for all three coefficients. Salvador and Martínez (Citation2007) attributed this effect to the greater stimulation exerted by more than a kid goat suckling on the udder; causing an increase in milk production, in addition to the hormonal effect during pregnancy (Pulina et al. Citation2007).
Moderate and lower values of TPY were observed between the fourth and sixth week of lactation for AG and SG, respectively, while for ANG value was greater. This observation may coincides with the observations of Cardellino and Benson (Citation2002) who observed that TPY occur at the fifth week of lactation period for one- and two-year-old ewes rearing single and twin lambs. Gaddour et al. (Citation2007) mentioned that there are evident differences in the dairy ability of different racial groups subjected to the same environmental and feeding conditions.
In many reports, the correlation between PTP and OTP was highly positive (~0.97); which indicates that at maximum observed milk production per day, the prediction of maximum milk production may be obtained from milk lactation curve (Salvador et al. Citation2006; Salvador & Martínez Citation2007).
In goats with twin births, the time elapses was less TPY, showing higher production per day and thus a higher total lactation than those with a single type of births. Sánchez et al. (Citation2006) found that litter size can directly influence the total production and daily production, which were coinciding with the results obtained in this study. Zygoyiannis (Citation1987) compared 2 groups of goats with different periods of suckling and noted that when the kids were weaned at 6 weeks, peak milk production was reached before the group which was weaned at 12 weeks, but milk production declines more rapidly in the first group, hence the importance of kid suckling on the persistence and total milk production.
The obtained results of persistence may match the natural process of gradual involution of the mammary gland. This process, in goats, characterised by a decrease in the number of secretory cells in the mammary gland, thereby producing the drop decreases over and during lactation is strongly influenced by the apoptosis rate in the lactating gland (Stefanon et al. Citation2002; Millier Citation2013).
When comparing the PTP with the OTP quantified throughout the experimental period, it was observed that both fit perfectly, which coincides with that described by Gipson and Grossman (Citation1990) who obtained values of R 2 > 0.9, using the incomplete gamma function of Wood (Citation1967). Therefore, it is confirmed that the model of Wood (Citation1967) is suitable for describing the lactation curve in goats. In the model of incomplete gamma function, a rapid increase occurs in milk production afterbirth to a peak was subsequently adapted to a gradual decline until suckling ends (Gipson & Grossman Citation1990; Capuco et al. Citation2003).
4.2. Dry matter intake
During lactating period, feed consumption depends on several factors highlighting its importance feed palatability and characteristics, body weight (BW), milk production level, temperature and availability of drinking water (Goetsch et al. Citation2001; Kholif et al. Citation2014). Feed intake obtained in this study represents a 5–7% of the LW of the goat. Differences observed between the three breeds for DMI are directly reflected on the production of milk. Salvador and Martínez (Citation2007) mentioned a maximum DMI in high producing lactating goats with about 5–7% of their BW, matching results obtained in the current study. Moreover, Cantú (Citation2008) presented similar results to those reported in the current study, reporting a DMI of 5–8% of BW for lactating goats in temperate climate. However, Salvador and Martínez (Citation2007) generalise DMI for most goats at 3%. Also, Khattab et al. (Citation2011) and Kholif et al. (Citation2014) noted that DMI for Baladi lactating goats was about 3% of the LW.
4.3. Body weight changes
Dunshea and Bell (Citation1990) with SG breed, and Lu et al. (Citation1990) with AG observed that changes in BW always positive for a period of 11 weeks of lactation. Positive relationships were found between DMI and production level or LW which probably due to the animal capacity to adjust feed intake to nutritive requirements and rumen volume (Avondo et al. Citation2008). Similarly, most reported equations estimating the intake for cattle, sheep and goats include BW and/or milk production among the independent variables (Avondo et al. Citation2002; Luo et al. Citation2004; Manafiazar et al. Citation2013).
4.4. Weaning weight
The majority goat kid’s mortality occurs in the period from birth to puberty; the weaning in this period represents the most critical stress (Otuma & Osakwe Citation2008), hence the importance of mentioning some factors that affect prenatal and postnatal growth. The prenatal growth is affected by parents genetic and nutrition, and postnatal growth is affected by birth weight, birth type, sex, litter size, age and milk production of mothers (Sebei et al. Citation2004; Otoikhian et al. Citation2013). The nutrition of the doe is certainly the most influential factor in foetal growth, particularly in the last third of gestation (Wu et al. Citation2013). In the current study, kid WW was unaffected with the breed and the type of birth. Birth weight of kids has been reported in negative correlation with survival and positively correlated with subsequent weight gain (Sebei et al. Citation2004). However, Merlos-Brito et al. (Citation2008) found that the offspring born from single births had higher WW (15.1 kg) than those born from twin births (13.4 kg). They explained this phenomenon by competition with two pups through breast milk, compared with those of one offspring.
The sex of kid affects birth weight, weaning and post-weaning gains (Lu & Potchoiba Citation1988; Andries Citation2013). Likewise, weight gain pre-and post-weaning is greater in kids born in single births than those from multiple births (Merlos-Brito et al. Citation2008). However, no difference in birth weight and weaning and post-WW was observed in kids of goats with different ages (Merlos-Brito et al. Citation2008). Male kids reached a heavier WW than female kids with about 8.1% (20 versus 18.13 kg for male and female kids, respectively). Similar results were reported by Merlos-Brito et al. (Citation2008) who found significant differences due to sex of kids, where male kids were higher (16.5 kg) than female kids (12.4 kg). It is noteworthy that these results are common when working with kids weaned at the same age (Otuma & Osakwe Citation2008) which could be explained by hormonal differences between males and females, which directly affect their growth patterns (Hossner Citation2005).
4.5. Daily gain weight
DWG presented a mean of 151.1 g/kid/d, which lies within it range of values reported by Lu and Potchoiba (Citation1988). The sex of the offspring showed that males compared to females showed higher DWG. Ortiz and Bermúdez (Citation1988) noted that DWG of kids from single births was heavier by about 9 g/kid/d more than those of twin births. The same observation was observed by Andries (Citation2013). The higher DWG as WW for males than females probably because of the male hormonal pattern which favours the growth of muscle tissue hypertrophy.
5. Conclusions
The prediction equation given by Wood is adequate to describe the lactation curve in goats in the first 90 days of lactation. The persistence for milk production was higher for ANG and AG breeds versus SG, indicating increased milk production when considering a complete lactation season. The persistence was higher for the does with single type of birth with respect to does with twin births. Moreover, WW and DWG of kids were greater in males versus females.
Disclosure statement
No potential conflict of interest was reported by the authors.
References
- Amin AA. 2003. Test-day model of daily milk yield prediction across stages of lactation in Egyptian buffaloes. Arch Tierzucht. 46:35–45.
- Andries KM. 2013. Growth and performance of meat goat kids from two seasons of birth in Kentucky. Sheep Goat Res J. 28:16–20.
- AOAC. 1997. Official methods of analysis. 16th ed. Arlington (VA): Association of Official Analytical Chemists.
- Arbiza ASI. 1987. Producción de caprinos [Production of goats]. México: AGT Editor.
- Avondo M, Biondi L, Pagano RI, Bonanno A, Lutri L. 2008. Feed intake. In: Cannas A, Pulina G, editors. Dairy goats feeding and nutrition. Cambridge (UK): CAB International; p. 147–160.
- Avondo M, Bordonaro S, Marletta D, Guastella AM, D’Urso G. 2002. A simple model to predict the herbage intake of grazing dairy ewes in semi-extensive Mediterranean systems. Livest Sci. 73:275–283.
- Bilgin OC, Esenbuga N, Davis ME. 2010. Comparison of models for describing the lactation curve of Awassi, Morkaraman and Tushin sheep. Arch Tierzucht. 53:447–456.
- Cantú JE. 2008. Zootecnia de ganado caprino [Animal science of goats]. México: Editorial Trillas, S.A. de C.V.
- Capote J, Lopez JL, Caja G, Peris S, Arguello A, Darmanin N. 1999. The effects of milking once or twice daily throughout lactation on milk production of Canarian dairy goats. In: Barillet F, Deligeorgis S, Zervas NP, Boyazoglu JG, Vallerand F, editors. Milking and milk production of dairy sheep and goats. Wageningen, The Netherlands: Wageningen Pers; p. 267–273.
- Capuco AV, Ellis SE, Hale SA, Long E, Erdman RA, Zhao X, Paape MJ. 2003. Lactation persistency: insights from mammary cell proliferation studies. J Anim Sci. 81:18–31.
- Cardellino RA, Benson ME. 2002. Lactation curves of commercial ewes rearing lambs. J Anim Sci. 80:23–27.
- Coombe JB, Wardrop ID, Tribe DE. 1960. A study of milk production of the grazing ewe, with emphasis on the experimental technique employed. J Agric Sci. 54:353–359.
- Dag B, Keskin I, Mikailsoy F. 2005. Application of different models to the lactation curves of unimproved Awassi ewes in Turkey. S Afr J Anim Sci. 35:238–243.
- Dunshea FR, Bell AW. 1990. Body composition changes in goats during early lactation estimated using a two-pool model of tritiated water kinetics. Br J Nutr. 64:121–131.
- [FAO] Food and Agriculture Organization. 2014. [cited 2014 September 5]. Available from: http://faostat3.fao.org/faostat-gateway/go/to/download/Q/QL/E
- Gaddour A, Najari S, Ouni M. 2007. Dairy performances of the goat genetic groups in the Southern Tunisian. Agric J. 2:248–253.
- Gipson TA, Grossman M. 1990. Lactation curves in dairy goats: a review. Small Ruminant Res. 3:383–396.
- Goetsch AL, Detweiler G, Sahlu T, Puchala R, Dawson LJ. 2001. Dairy goat performance with different dietary concentrate levels in late lactation. Small Ruminant Res. 41:117–125.
- Grzesiak W, Wojcik J, Binerowska B. 2003. Prediction of 305-day first lactation milk yield in cows with selected regression models. Arch Tierzucht. 46:215–226.
- Haenlein GFW, Caccese R. 1984. Goat milk versus cow milk. In: Haenlein GFW, Ace DL, editors. Extension goat handbook. Washington (DC): USDA Publications; p. 1–7.
- Hossner KL. 2005. Hormonal regulation of farm animal growth. Wallingford (UK): CABI Publishing.
- INEGI. 2009. Anuario estadístico del Estado de México [Statistical yearbook of the state of Mexico]. México: Instituto Nacional de Estadística, Geografía e Informática.
- Keskin I, Dag B. 2006. Comparison of different mathematical models for describing the complete lactation of Akkaraman ewes in Turkey. Asian Aust J Anim Sci. 19:1551–1555.
- Khattab HM, Gado HM, Kholif AE, Mansour AM, Kholif AM. 2011. The potential of feeding goats sun dried rumen contents with or without bacterial inoculums as replacement for berseem clover and the effects on milk production and animal health. Inter J Dairy Sci. 6:267–277.
- Kholif AE, Khattab HM, El-Shewy AA, Salem AZM, Kholif AM, El-Sayed MM, Gado HM, Mariezcurrena MD. 2014. Nutrient digestibility, ruminal fermentation activities, serum parameters and milk production and composition of lactating goats fed diets containing rice straw treated with Pleurotus ostreatus. Asian Austral J Anim Sci. 27:357–364.
- Lu CD, Potchoiba MJ. 1988. Milk feeding and weaning of goats kids. Small Ruminant Res. 1:105–112.
- Lu CD, Potchoiba NJ, Sahlu T, Kawas JR. 1990. Performance of dairy goats fed soybean meal or meat and bone meal with or without urea during early lactation. J Dairy Sci. 73:726–734.
- Luo J, Goetsch AL, Nsahlai IV, Moore JE, Galyean ML, Johnson ZB, Sahlu T, Ferrell CL, Owens FN. 2004. Voluntary feed intake by lactating, Angora, growing and mature goats. Small Ruminant Res. 53:357–378.
- Manafiazar G, McFadden T, Goonewardene L, Okine E, Basarab J, Li P, Wang Z. 2013. Prediction of residual feed intake for first-lactation dairy cows using orthogonal polynomial random regression. J Dairy Sci. 96:7991–8001.
- Merlos-Brito MI, Martínez-Rojero RD, Torres-Hernández G, Mastache-Lagunas AA, Gallegos-Sánchez J. 2008. Evaluación de características productivas en cabritos Boer × local, Nubia × local y locales en el trópico seco de Guerrero, México [Evaluation of productive traits in Boer × local, Nubia × local and local in the dry tropic of Guerrero, Mexico]. Vet Méx. 39:323–333.
- Millier MJ. 2013. Primary cilia in the bovine mammary gland: characterising ciliary distribution and morphology during lactation and involution [unpublished MSc thesis]. Dunedin: University of Otago.
- NRC. 2001. Nutrient requirements of dairy cattle. 7th ed. Washington (DC): National Academy Press.
- Ortiz FA, Bermúdez E. 1988. Factores que afectan el crecimiento de cabritos nacidos en julio en agostaderos de Villa Hidalgo Zacatecas [Factors affecting the growth of kids born in July in rangelands of Villa Hidalgo Zacatecas]. In: Proceeding Congreso Interamericano de Producción Caprina; Saltillo, Coahuila, México; p. A64–A65.
- Ortiz FA, Bermúdez E, González P. 1988. Cambios de peso vivo de las hembras de crías en dos épocas de empadre en el altiplano zacatecano [Changes in body weight of female offspring of two breeding seasons in Zacatecas highlands]. In: Proceeding Congreso Interamericano de Producción Caprina, Saltillo, Coahuila, México; p. A66–A67.
- Otoikhian CSO, Orheruata AM, Utulu G. 2013. Influence of birth-weight on weight-gain and milk-intake of wad goat kids within first 25 days of life. IJSID. 3:555–557.
- Otuma MO, Osakwe II. 2008. Assessment of the reproductive performance and post weaning growth of crossbred goat in Derived Guinea Savanna Zone. Res J Anim Sci. 2:87–91.
- Park YW, Haenlein GFW. 2010. Milk production. In: Solaiman SG, editor. Goat science and production. Ames: Wiley; p. 275.
- Pulina G, Nudda A, Pietro N, Macciotta P, Battacone G, Pier S, Rassu G, Cannas A. 2007. Non-nutritional factors affecting lactation persistency in dairy ewes: a review. Ital J Anim Sci. 6:115–141.
- Ruth OA. 2012. EAAPP dairy goat stakeholders workshop. Kenya: Wambugu.
- Salvador A, Martínez G. 2007. Factores que afectan la producción y composición de la leche de cabra: revisión bibliográfica [Factors affecting the production and composition of goat milk: a review]. Rev Fac Cs Vets UCV. 48:61–76.
- Salvador A, Martinez G, Alvarado C, Hahn M. 2006. Composición de leche de cabras mestizas Canarias en condiciones tropicales [Composition of milk of Canary crossbred goats under tropical conditions]. Zootecnia Trop. 24:307–320.
- Sánchez I, Martínez RD, Torres G, Becerril CM, Mastache AA, Suárez J, Rubio M. 2006. Producción de leche y curvas de lactancia en tres razas de cabras en el trópico seco de México [Milk production and lactation curves in three breeds of goats in the dry tropics of Mexico]. Vet Méx. 37:493–502.
- Schaeffer LR. 2004. Applications of random regression models in animal breeding. Livest Sci. 86:35–45.
- Sebei PJ, McCrindle CME, Webb EC. 2004. Factors influencing weaning percentages of indigenous goats on communal grazing. S Afr J Anim Sci. 34:130–133.
- Shrestha JNB. 2012. Genetics and breeding of meat goats. In: Mahgoub O, Kadim IT, Webb E, editors. Goat meat production and quality. Croydon: CABI; p. 76.
- Stefanon B, Colitti M, Gabai G, Knight CH, Wilde CJ. 2002. Mammary apoptosis and lactation persistency in dairy animals. J Dairy Res. 69:37–52.
- Swalve HH, Guo Z. 1999. An illustration of lactation curves stratified by lactation yields within herd. Arch Tierzucht. 42:515–525.
- Van Soest PJ, Robertson JB, Lewis BA. 1991. Methods for dietary fibre, neutral detergent fibre, and non-starch carbohydrates in relation to animal nutrition. J Dairy Sci. 74:3583–3597.
- Wood PDP. 1967. Algebraic model of the lactation curve in cattle. Nature. 216:164–165.
- Wu G, Bazer FW, Satterfield MC, Li X, Wang X, Johnson GA, Burghardt RC, Dai Z, Wang J, Wu Z. 2013. Impacts of arginine nutrition on embryonic and fetal development in mammals. Amino Acids. 45:241–256.
- Zygoyiannis D. 1987. The milk yield and milk composition of the Greek indigenous goat (Capra prisca) as influenced by duration of suckling period. Anim Prod. 44:107–116.