
ABSTRACT
Near infrared reflectance spectroscopy (NIRS) is an important tool for rapid analysis and prediction of feed ingredients. Broiler and laying chicken's diet received from different commercial feed factories in Bangladesh were collected, and near infrared reflectance spectra were obtained in duplicate with a Fourier Transform Near Infrared Reflectance Spectrophotometer using a Qurtz cup sampling device. Multivariate analysis was performed for the development of calibration equations of nutrients by optical user software (OPUS) and OPUS Lab to relate the spectral data and corresponding concentration values of broiler and laying chicken's diet. Data were centred using the partial least squares algorithm, and spectral outliers were identified from each calibration. The accuracy of the calibration models was validated by root mean square error cross validation (RMSECV), root mean square error of estimation and correlation coefficient (R2) between the measured values of nutrient component determined by analytical laboratory vs. predicted values. High R2 (>90.00) was shown in predicting crude protein (CP), ether extracts (EE) and total phosphorus (P) contents of broiler and laying chicken's diet; however, the R2 (>80.00) in predicting moisture, crude fibre (CF) and calcium (Ca) contents of broiler and laying chicken's diet was acceptable. The highest RMSECV (0.58%) was observed in CP determination of laying chicken's diet, but all errors were in acceptable ranges. It is concluded that NIRS could potentially be used to predict the moisture, CP, CF, EE, Ca and P contents in commercial broiler and laying chicken's diet.
1. Introduction
Feed quality is a crucial issue to formulate a balanced diet for poultry. Commercial poultry manufacture is one of the fastest growing and most promising industries in Bangladesh. Its steady growth results in attaining country's economic growth which also in turn contributes to improve the nutritional status of the population by supplying meat and eggs. The government is interested in the development of commercial poultry farming, encouraging both urban and rural people to work here and to enhance the capacity of poultry industry. The intensive production system depends on balanced compound diets where feed cost represents 65–70% of the total production cost of poultry farming. However, proper attention should be given to evaluate the nutritional quality of feed ingredients in order to supply the adequate amount of balanced diet for poultry to maximize the effective production cost (Panda et al. Citation2014; Karimi & Ebadi Citation2014).
Near infrared reflectance spectroscopy (NIRS) offers the potential for obtaining a rapid, non-destructive and accurate estimation of the chemical composition of feedstuffs (Melchinger et al. Citation1986). The technique has extensive application for the analysis of constituents of agricultural crops, feeds and foods (Osborne et al. Citation1993; Williams Citation2001; Roberts et al. Citation2004). NIRS, while much simpler and more rapid than traditional analytical methods, typically requires grinding a sample to a fine particle size to give a smooth and homogeneous surface for reflection and increased precession (Roberts et al. Citation2004). These traditional analytical methods require no chemical reagents, and therefore avoid the problems of organic and other chemical waste disposal. Once calibrations are in place, it takes just a minute to have the result of one or more constituents which may take hours or days by conventional chemistry. Mehri et al. (Citation2014) predicted the ideal ratio of threonine to lysine in straight-run broiler chickens from regression and broken-line models. They reported that considering FCR as a response, the ideal ratios of SID Thr:SID Lys were 72 and 71% using the linear broken-line and quadratic broken-line models, respectively.
Currently, NIRS of whole grains at the grain elevator is used widely in the USA, Canada, Australia and Europe for evaluation of protein and moisture content of grains (Sandra et al. Citation2005; Faridi et al. Citation2014). However, little is known about the potential of NIRS for the nutritional evaluation of locally available ingredients in Bangladesh as well as other parts of Southeast Asia. In addition, quick prediction of nutritional quality of feed ingredients in the poultry feed industry is necessary for achieving sustainable poultry production. Therefore, the objectives of the study were: (a) to develop local calibration procedures using NIRS and validation of calibrations for the evaluation of locally available poultry diets and (b) to determine the nutritive value of large number of commercial broiler and laying chicken's diet within the shortest possible time.
2. Materials and methods
2.1. Sample collection and preparation
Broiler and laying chicken's diets were collected from the different commercial feed factories and local feed markets available in Bangladesh from 2006 to 2009. Concentrated mixed broiler finisher (4–6 weeks) and laying chicken diets (21–52 weeks) were used in this study. About 200 g of each broiler and laying chicken diet samples were collected from each factory. Samples were ground through 2.0 mm screen for homogeneous particle size using Cemotec Grinding Mill (Foss Tecator, Sweden) before reflectance measurements and dried at 60°C for wet chemistry analysis.
2.2. Spectroscopic and laboratory analysis of the sample
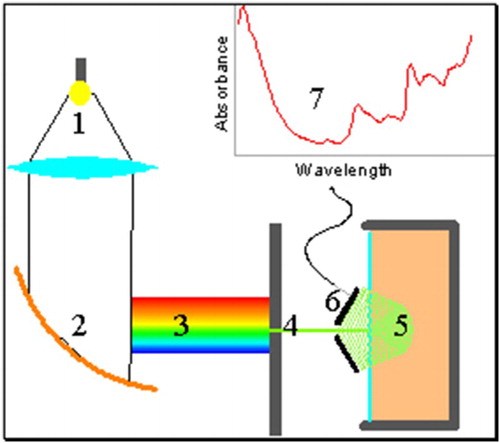
Identification of appropriate samples was the first step in utilizing a combination of NIRS and laboratory analysis (Roberts et al. Citation2004). Ground broiler and laying chicken's diet were scanned in duplicate (scanning number 32, resolution 8) with an FT-NIRS (Bruker, MPA, Germany) systems monochromator (700–2400 nm). Samples were packed into a Qurtz cup sample holder which holds the sample into a clear glass window, to maintain good contact between the granular and window. Monochromatic light was focused on to a concave mirror which separated the light into its composing wavelengths (). Required wavelength was selected by which the near infrared light was fallen on to the feedstuff. The amount of this light reflected by the feedstuff was measured to obtain the absorption corresponding to selected wavelength. The graph depicting the wavelength tested versus the absorption is called the spectrum, and an example spectrum is presented in the top right corner of . Spectral reference curves were measured for each of the broiler diet sample and the data were stored in the selected folder. Sample moisture, crude protein (CP), crude fibre (CF), ether extract (EE), calcium (Ca) and total phosphorus (P) contents of diet samples were determined according to AOAC (Citation2000).
Figure 1. Schematic f NIRS machine. Light is focused (1) on to a concave mirror (2), which separates the light into its composing wavelengths (3). One wavelength is selected (4), and made to fall onto the feedstuff (5). The amount of this light which is reflected by the feedstuff is measured (6) to obtain the absorption corresponding to one wavelength. By changing the orientation of the mirror (2) different wavelengths of light are selected to obtain absorption measures for all wavelengths of interest. The graph depicting the wavelength tested versus the absorption is called the spectrum, and an example spectrum for coconut meal is presented in the top right corner (7).
2.3. Development of calibration model
For the development of calibration model in the present experiment, multivariate analysis was performed by commercial analysis program optical user software (OPUS). The OPUS Lab provided by Bruker, MPA, Germany was used to relate the spectral data and corresponding concentration values for each nutrient component (Moisture, CP, CF, EE, Ca and P) of broiler and laying chicken's diets. The model was developed using the partial least squares (PLS) algorithm and the spectral data were processed by a suitable mathematical method for example, first derivative, second derivative, vector normalization, subtraction of straight line, etc. The PLS uses eigenvectors and eigen values to perform a decomposition of the spectral and constituent concentration data simultaneously. The decomposition process is a systematic means to determine the most important variations in the data. PLS uses constituent concentration information during spectral decomposition, which weights spectra containing higher constituent concentrations more heavily. The term ‘factor' or ‘rank' is used to describe a linear combination of spectral data. The PLS reconstructs a spectrum that represents the predicted constituent values. This predicted spectrum is subtracted from the actual spectrum to determine residuals. Therefore, the residual (Res) is the difference between the true and fitted values. Thus the sum of squared errors (SSEs) is the quadratic summation of these values:
The standard error of calibration or root mean square error of estimation (RMSEE) is calculated from this sum, with M being the number of standards and R the PLS factors or rank: 1
Appropriate frequency range of the spectrum was selected to get good correlation between the changes in spectral and the concentration data.
2.4. Validation of the calibration model
The suitability of the chosen data processing method and the frequency range for method development was evaluated during validation. In the case of cross validation, individual samples were taken from the calibration set. Using the remaining samples, a calibration model was established and used to analyse the previously extracted samples. This procedure of removing samples, analysing them and returning them to the calibration data-set was continued successively until all the samples had been analysed once ().
Figure 2. Steps in cross validation (PLS, partial least squares).
A comparison of the resulting analysis values with the original raw data allowed the calculation of the predictive error of the complete data system, the root mean square error cross validation (RMSECV):
Besides, coefficient of determination (r2) from the linear regression of measured values of nutrient component determined by analytical laboratory versus predicted values by the NIR calibration was calculated to give the accuracy of the model. During the validation, potential outliers could be detected easily and only after all outliers had been removed from the calibration data-set, and finally after the optimum parameters had been found, the calibration model was established.
3. Results
3.1. Calibrations for nutrients evaluation of broiler diets
The overall range of moisture, CP, CF, EE, Ca and P contents of broiler diets was 10.90 to 13.11, 13.12 to 22.96, 1.78 to 7.20, 3.09 to 11.35, 0.63 to 1.27 and 0.38 to 0.83%, respectively, with standard error (SE) of 0.023, 0.090, 0.065, 0.094, 0.007 and 0.006, respectively (). The number of samples (n) in developing calibration equations for the prediction of moisture, CP, CF, EE, Ca and P was 543, 352, 215, 374, 230 and 241, respectively.
Table 1. General and calibration statistics for the chemical composition of broiler feed samples.
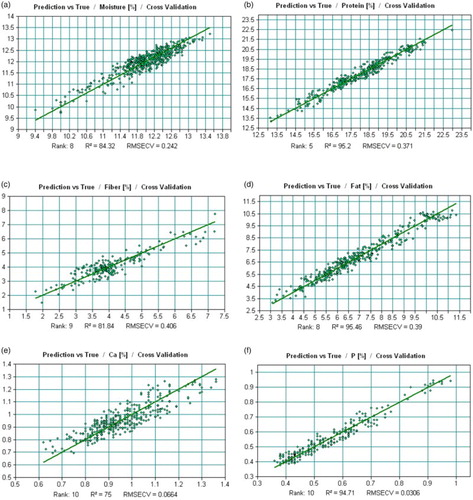
The RMSEE in developing calibration equations by using NIRS for the determination of moisture, CP, CF, EE, Ca and P of broiler diets was 0.230, 0.351, 0.361, 0.350, 0.056 and 0.021%, respectively with R2 of 86.09, 95.77, 86.28, 96.28, 80.50 and 95.80, respectively (). After cross validation, RMSECV for the prediction of moisture, CP, CF, EE, Ca and P in broiler diets was 0.242, 0.371, 0.406, 0.390, 0.066 and 0.030%, respectively (). Besides, R2 between measured values of nutrient component determined by analytical laboratory vs. predicted values determined by the NIR calibrations for the determination of moisture, CP, CF, EE, Ca and P in broiler diets was 84.32, 95.20, 81.84, 95.46, 75.00 and 94.71, respectively ().
Figure 3. Prediction (NIR) vs. true (laboratory), RMSECV, PLS factors (rank) and correlation coefficient (R2) for the prediction of (a) moisture, (b) crude protein, (c) crude fibre, (d) fat, (e) Ca and (f) P determination in broiler diet samples.
3.2. Calibrations for nutrients evaluation in laying chicken's diet
The overall range of moisture, CP, CF, EE, Ca and P contents in laying chicken's diet was 9.86 to 12.90, 11.14 to 23.89, 1.78 to 7.20, 2.93 to 9.80, 0.68 to 4.74 and 0.37 to 1.34%, respectively with the SE of 0.061, 0.158, 0.064, 0.094, 0.043 and 0.011, respectively (). The number of samples in developing calibration equations for the prediction of moisture, CP, CF, EE, Ca and P was 452, 456, 219, 183, 413 and 263, respectively.
Table 2. General and calibration (NIR) statistics for the chemical composition of layer feed samples.
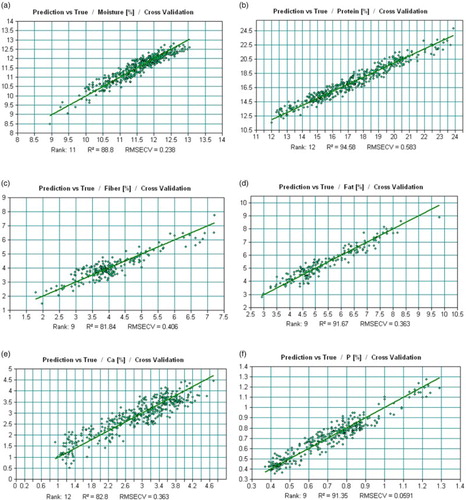
The RMSEE in developing calibration equations by using NIRS for the determination of moisture, CP, CF, EE, Ca and P of laying chicken's diet was 0.217, 0.520, 0.396, 0.325, 0.329 and 0.045%, respectively with R2 of 91.00, 95.80, 86.20, 93.00, 86.27 and 92.30, respectively (). After cross validation, the standard error for the prediction of moisture, CP, CF, EE, Ca and P in laying chicken's diet was 0.238, 0.583, 0.406, 0.363, 0.363 and 0.059%, respectively (). Besides, the R2 between measured values of nutrient component determined by analytical laboratory versus predicted values determined by the NIR calibrations for the determination of moisture, CP, CF, EE, Ca and P in laying chicken's diet was 88.80, 94.58, 81.84, 91.67, 82.80 and 91.35, respectively ().
Figure 4. Prediction (NIR) vs. true (laboratory), RMSECV, PLS factors (rank) and correlation coefficient (R2) for the prediction of (a) moisture, (b) crude protein, (c) crude fibre, (d) fat, (e) Ca and (f) P determination in laying chicken diet samples.
4. Discussion
Balanced diet formulation for birds is a most critical issue in the applied poultry sciences. Dynamic genetic improvements in both birds and plants have been growing for the last few years, resulting changes in bird nutritional requirements and ingredient compositions (Delwiche et al. Citation2006). Therefore, nutritionists need to continually monitor both their bird's requirements and feed ingredient compositions for diet formulation. The NIRS is one of the most effective tools for predicting the nutritional composition of the feed ingredients and diets for poultry (Ru et al. Citation2003; Kadim et al. Citation2005). In the present study, the SE of CP, CF and EE contents in broiler diets determined by the laboratory was relatively higher than that of moisture, Ca and P contents which probably due to the higher variations of CP, CF and EE contents in broiler diets. Similar results were also found in the laying chicken's diets in determining the CP, CF and EE contents. The RMSEE prediction of CP, CF and EE contents both in broiler and laying chicken's diets was relatively higher than that of calibrations for the prediction of moisture, Ca and P in broiler diets, and moisture and P contents in laying chicken's diets which could be due to higher variations observed in laboratory determinations of CP, CF and EE contents both in broiler and laying chicken's diets ( and ). In an early study, Holechek et al. (Citation1982) reported that the high errors of analysis could be due to maturity of grains that were used in producing commercial poultry diets, method of collection and preparation of samples as well as host environmental interactions. The SE in developing calibrations for the prediction of Ca content in laying chicken's diets (0.33) was higher than that of broiler diets (0.06). The Ca content in laying chicken's diets is higher than that of broiler diets might be attributed to large variations in laying chicken's diets (Tahir et al. Citation2012).
On the other hand, the R2 between measured CP, CF and EE contents of broiler diets in the laboratory and predicted nutrient contents by NIR calibrations was 95.77, 86.28 and 96.28, respectively, which was satisfactory in the current study. Similarly, the R2 between measured CP, CF and EE contents of laying chicken's diets in the laboratory and predicted nutrient contents by NIRS was 95.80, 86.28 and 93.00, respectively, also indicated the accuracy of the model. Meanwhile, after cross validation, and also indicated the close relation of the correlation between true (laboratory) values and predicted (NIR) values for the evaluation of CP, CF and EE contents in broiler and laying chicken's diets. In a pig study, McCann et al. (Citation2006) obtained strong relationships and low SE between the actual and predicted values, and reported that NIRS may be useful in predicting the nutritive value of barley. In addition, Melchinger et al. (Citation1986) found the SE and R2 0.29% and 96.00, respectively, for the prediction of CP in cereal grains which was similar to our study in poultry diets. Therefore, the model developed for CP and EE determination in broiler and laying chicken's diets in the present experiment appears to be sufficiently accurate and later for quality control applications. Besides, the R2 for the prediction of CF contents in broiler diets and CF and EE contents in laying chicken's diets could be improved by the addition of large number of samples to the calibration set (McCann et al. Citation2006).
The SE for the prediction of moisture, Ca and P in broiler and laying chicken's diets by using NIRS were of almost similar nature to the SE of laboratory determination. By contrast, Ru et al. (Citation2003) found the SE of cross validation below 0.2 for apparent metabolizable energy and only 0.06 for FCR of pig's predicted by NIRS, which was in agreement with the present study. According to the procedure of Conzen (Citation2003), multivariate calibration was developed in the present experiment and the commercial software analysis program OPUS had the opportunity to use all possible mathematical models that is, first derivative, second derivative, vector normalization, etc. to develop calibration equations with least errors. In addition, the R2 between measured moisture and P contents of broiler diets determined in the laboratory and predicted by NIRS after cross validation was 84.32 and 94.71, respectively, indicated the accuracy of the model ((a) and (e)). However, the R2 of Ca between laboratory and NIRS determination was 75.00 ((e)) which was relatively lower after cross validation. In PLS regression, if too many factors (rank) are chosen (10 for Ca) the model tries to account even the smaller changes in the data-set which creates spectral noise (‘over fitting') and leads to decrease in correlation coefficient after validation (Conzen Citation2003). However, this could be increased by incorporation of large number of homogeneous samples to the calibration set. Similarly, the R2 between laboratory and NIRS determination of Ca in laying chicken's diets was slightly lower than other nutrients (). The accuracy of the analysis using NIRS depends on many factors, among which sample preparation plays an important role (Alomar et al. Citation1999). The highest accuracy of estimation is obtained when dried and ground 0.3–1.0 mm samples are used, mainly due to homogeneity of the sample particles (Osborne et al. Citation1993). In the present study, the particle sizes of the samples were 2.0 mm which might be lead to increase higher variation in the calibration set. However, Ru et al. (Citation2003) concluded that significant variation in nutritive value of commercial broiler diets between batches within company or between companies resulted in a huge difference in profit for the chicken meat industry. Therefore, a rapid low-cost assay is required to assess the quality of commercial poultry diets with a short turnover time, simple operation and low running costs (Ru et al. Citation2003).
5. Conclusions
It is concluded that NIRS could potentially be used to predict the moisture, CP, CF, EE, Ca and P contents in commercial broiler and laying chicken's diets. The NIRS should be preferred as the most convenient tool due to its non-destructive analytical method without using any chemical reagents and hence environmentally friendly.
Acknowledgements
The authors would like to thank Super Power Pharmaceuticals Ltd. Belabo, Narshingdi, Bangladesh for their support in preparation of this manuscript.
Disclosure statement
No potential conflict of interest was reported by the authors.
References
- Alomar D, Montero R, Fuchslocher R. 1999. Effect of freezing and grinding method on near infrared reflectance (NIR) spectra variation and chemical composition of fresh silage. Anim Feed Sci Technol. 78:57–63. doi: 10.1016/S0377-8401(98)00268-5
- AOAC. 2000. Official Methods of Analysis. Association of Official Analytical Chemist. 17th ed., Washington DC, USA.
- Conzen JP. 2003. Multivariate Calibration. A practical guide for developing methods in the quantitative analytical chemistry. 1st English edition, translated from the 3rd German edition. Bruker Optick, GmbH.
- Delwiche SR, Pordesimo LO, Scaboo AM, Pantalone VR. 2006. Measurement of inorganic phosphorus in soybeans with near-infrared spectroscopy. J Agric Food Chem. 54:6951–6956. doi: 10.1021/jf060919n
- Faridi A, Golian A, France J, Heravi Mousavi A, Mottaghitalab M. 2014. Evaluation of broiler chicks responses to protein, methionine and tryptophan using neural network models. J Appl Anim Res. 42:327–332. doi: 10.1080/09712119.2013.867860
- Holechek JL, Shenk JS, Vavra M, Arthun D. 1982. Prediction of forage quality using near infrared reflectance spectroscopy on esophaegeal fistula samples from cattle on mountain range. J Anim Sci. 55:970–976. doi: 10.2527/jas1982.554971x
- Kadim IT, Mahgoub O, Al-Marzooqi W, Annamalai K. 2005. Prediction of crude protein, extractable fat, calcium and phosphorus contents of broiler chicken carcasses using near-infrared reflectance spectroscopy. Asian Australas J Anim Sci. 18:1036–1040. doi: 10.5713/ajas.2005.1036
- Karimi K, Ebadi A. 2014. Effects of sun-dried garlic and psyllium seed on growth performance, carcass characteristics and serum biochemicals of broiler chicks fed tallow-containing diets. J Appl Anim Res. 42: 145–152. doi: 10.1080/09712119.2013.822814
- McCann MEE, McCracken KJ, Agnew RE. 2006. The use of near infrared reflectance spectroscopy (NIRS) for prediction of the nutritive value of barley for growing pigs. Irish J Agric Food Res. 45:187–195.
- Mehri M, Nissiri-Moghaddam H, Kermanshahi H, Danesh-Mesgaran M. 2014. Ideal ratio of threonine to lysine in straight-run Cobb 500 broiler chickens from 15 to 28 d of age predicted from regression and broken-line models. J Appl Anim Res. 42:333–337. doi: 10.1080/09712119.2013.867861
- Melchinger AE, Schmidt GA, Geiger HH. 1986. Evaluation of near infrared reflectance spectroscopy for predicting grain and stover quality traits in maize. Plant Breed. 97:20–29. doi: 10.1111/j.1439-0523.1986.tb01297.x
- Osborne BG, Fearn T, Hindle PH. 1993. Practical NIR spectroscopy with applications in food and beverage analysis. Harlow, UK: Longman Scientific and Technical.
- Panda AK, Zaidi PH, Rama Rao SV, Raju MVLN. 2014. Efficacy of quality protein maize in meeting energy and essential amino acid requirements in broiler chicken production. J Appl Anim Res. 42:133–139. doi: 10.1080/09712119.2013.822812
- Roberts CA, Workman JR, Reeves JB. 2004. Near infrared reflectance spectroscopy in agriculture. Agron Monogr. 44:822. ASA, CSSA, and SSSA, Madison, WI.
- Ru YJ, Hughes RJ, Choct M, Kruk JA. 2003. Variation in nutritive value of commercial broiler diets. Asian Australas J Anim Sci. 16:830–836. doi: 10.5713/ajas.2003.830
- Sandra EK, Shimizu N, Barton II FE, Ohtsubo K. 2005. Near infrared transmission and reflectance spectroscopy for the determination of dietary fiber in barley cultivars. Crop Sci. 45:2307–2310. doi: 10.2135/cropsci2005.0013
- Tahir M, Shim MY, Ward NE, Westerhaus MO, Pesti GM. 2012. Evaluation of near-infrared reflectance spectroscopy (NIRS) techniques for total and phytate phosphorus of common poultry feed ingredients. Poult Sci. 91:2540–2547. doi: 10.3382/ps.2012-02211
- Williams PC. 2001. Implementation of near infrared technology. In: Williams PC, Norris KH. editors. Near-infrared technology in the agricultural and food industries. 2nd ed. St. Paul, MN: American Association of Cereal Chemists; p. 145–169.