
ABSTRACT
Goats are important from a socioeconomic perspective for the poor in arid regions, worldwide. Nevertheless, more than half of the local breeds in the world are threatened and have not been fully characterized. The Canindé is one of the main local breeds of northeastern Brazil and, like most, their effective numbers have fallen over the years and needs to be characterized. Many tools are available for assessing the phenotypic profile of a breed and multivariate techniques are important when considering all variables simultaneously. The present study utilized multivariate techniques for phenotypic characterization of the Canindé goat breed from 11 morphometric variables (HL = head length; FW = face width; HW = head width; BL = body length; CG = chest girth; WH = wither height; SRH = sacral region height; CW = croup width; CL = croup length, SP = shin perimeter and ES = ear size) and morphological variables of qualitative character (presence and absence of earrings, horns, beard, abnormal teat number and hair length) collected from herds from different states (populations) in the northeast of Brazil. Multivariate analysis allowed the differentiation and characterization of the evaluated individuals, HL, FW, WH, SRH and BL variables were the most important to define the phenotypic profile of the studied populations. Examined whether spatial organization of individuals was assessed in each state of the Brazil demonstrated considerable diversity of phenotypes within breeds from the different states. These data could be used successfully in a conservation breeding programme.
1. Introduction
Canindé is one of the major local breeds of northeastern Brazil and, like many, still needs to be better characterized. Genetic resource conservation is a set of actions taken in order to protect genetic patrimony, with emphasis on those that are under constant threat (Ribeiro et al. Citation2010), as in the case of the Canindé breed.
Phenotypic character study is the basis for the differentiation of groups and/or breeds and provides support for conservation programmes; it is a technique used to characterize genetic resources in many countries (Zepeda et al. Citation2002; Zaitoun et al. Citation2005; Revidatti et al. Citation2007; Carneiro et al. Citation2010; Jimcy et al. Citation2011; Aziz & AlHur Citation2013) .Many tools are available that can help determine the discriminatory power that variables have in describing breed patterns. These also aid in evaluation of the relative importance of variables, saving time and financial resources invested by researchers. In this field, multivariate analysis techniques have been very useful in support of characterization studies of breeds, as examples of the studies developed by Yakubu et al. (Citation2011) with African goats, Legaz et al. (Citation2011) in studies with Assaf sheep and Dekhili et al.’s (Citation2013) evaluation of Algerian goats.
According to Ferraudo (Citation1995), multivariate analysis (cluster analysis, main component analysis, canonical analysis, discriminant analysis and correspondence analysis) refers to all statistical methods that simultaneously analyse multiple measurements in a single individual and that are interrelated. It has been widely used in studies of breed characterization and genetic diversity as it provides descriptive analysis of the differences between populations, considering all variables together, providing a data overview (Cazar Citation2003; Dossa et al. Citation2007).
Multivariate analysis allows for greater discriminating power, eliminating those difficult to measure variables and those that contribute little towards explaining variation.
Therefore, the aim of this study was to reduce data dimensionality, eliminate redundant information and identify similarities by using multivariate analysis.
2. Material and methods
2.1. Data collection
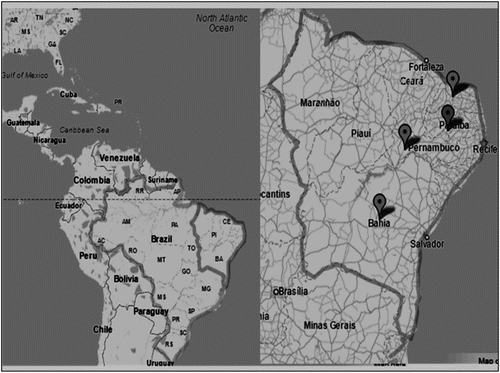
Data used in this study were obtained from 150 Canindé adult female goats () from different herds in Pernambuco (n = 9), Paraíba (n = 39), Rio Grande do Norte (n = 69) and Bahia (n = 33) states () (semi-arid region of Northeast Brazil, covering the largest area of the breed occurrence). The animals were in an extensive rearing system, with local pasture as the basis of herd feeding. Sampling was carried out from June 2011 to January 2012. A form containing animal identification and its herd, as well as morphology and morphometry information was used.
Figure 1. Adult females of Canindé goat breed in Boa Vista Municipality, Paraíba State, Brazil.
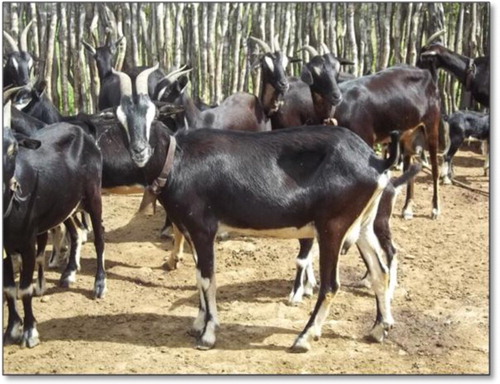
Figure 2. Pernambuco, Paraíba, Rio Grande do Norte and Bahia states of northeast Brazil.
Morphometric evaluation was performed with the aid of a measuring tape and considered 11 quantitative characteristics (according to Zepeda methodology 2002): HL = head length; FW = face width; HW = head width; BL = body length; CG = chest girth; WH = wither height; SRH = sacral region height; CW = croup width; CL = croup length; SP = shin perimeter and ES = ear size.
For morphological characterization, the animals were catalogued on the basis of presence or absence of qualitative characteristics such as earrings, horns, beard, abnormal teat number (politetia) and hair length (short or long).
2.2. Data analysis
Morphometric data were subjected to variance and descriptive analysis, using the Statistical Analysis System (SAS Citation1999). Averages were submitted to Tukey test at 5% probability. Multivariate statistical analysis was performed using the Statistica Citation2009 software, version 8.0. Hieracrchical clustering among morphometric variables was assessed by the nearest neighbour method, performed based on Euclidean distance.
Morphometric variables were subjected to factor analysis based on principal components analysis to identify characteristics best suited to breed characterization. The number of factors was established based on eigenvalues which explained a minimum of 70% of accumulated variation. Those with a value < 70% were discarded, according to the Jolliffe criterion (Citation1972, Citation1973).
Correspondence analysis was used to verify the association between qualitative morphological traits by plotting individuals in a multi-dimensional plan.
Morphometric and morphologic variables were subjected to canonical and discriminant analyses. Discrimination of individuals based on the Mahalanobis distance and composite variables were called canonical roots or discriminant functions. Each canonical root consisted of a linear combination (Z) of the independent variables (Yi) in order to maximize the correlation between Z and Yi. Linear combination of i variables Y, forming a discriminant function Z, can be represented in the following model:
In this model, μ1, μ2 … μi are estimated canonical coefficients for the data and Y1, Y2 … Yi represent independent variables, which are the different groups according to the states where the animals were evaluated (Rio Grande do Norte, Paraíba, Pernambuco, and Bahia).
Discriminant analysis was adopted to classify individuals into statistically different groups per state, based on morphometric and morphological characteristics. This type of analysis allows us to understand the differences between populations and predict the class or group which an individual belongs to (Hair et al. Citation1998).
3. Results and discussion
Averages (cm) and their respective standard deviations for the evaluated morphometric characteristics (according to state; populations) are shown in . A significant difference in the studied variables in different states was observed (p < .05), except for the BL characteristic ().
Table 1. Averages (cm) and their respective deviant-pattern for evaluated morphometric characteristics (Canindé breed), according to the state.
Animals raised in the states of Pernambuco and Bahia presented the highest averages of CG, WH, SRH and SP, showing that animals belonging to these states are taller than the animals raised in Paraíba and Rio Grande do Norte. However, these populations have similar body length (). In general, the local goats in the Northeast of Brazil are small animals, this result differs from the results obtained in the present study. This difference can be associated with the influence of crossbreeding with exotic mating and management techniques often adopted in the region. This highlights the need for a genetic management plan for the Canindé breed as a way of maintaining intrabreed genetic variability.
Such differences were also observed in studies on Canindé goats characterized in the states of Paraíba and Rio Grande do Norte developed by Silva et al. (Citation2004) which highlight the influence of location on the analysed morphometric characteristics. Lanari et al. (Citation2003) highlighted the influence of geographic isolation and introduction of exotic breeds into the heterogeneity observed in local goats of Patagônia, Argentina.
Animals with short hair (SL+), with horns (Ho+) without earrings (Waw) and normal top predominate in all the states (populations). The local goat breeds in the Northeast of Brazil show a morphology similar to those found in the present study. However, animals from Rio Grande do Norte are different from others because of a lack of beard (Br+) in most cases (). The beard is determined by the locus beard (Br), which contains the Brb (bearded) and Br+ (wild) alleles, which is an autosomal gene linked to sex, dominant in males and recessive in females.
Table 2. Frequency distribution of morphologic traits in Canindé goats in Pernambuco (PE), Paraíba (PB), Rio Grande do Norte (RN) and Bahia (BA) states, northeastern Brazil.
Traoré et al. (Citation2008) observed a high prevalence of animals with beards in local goats from Burkina Faso. Ozoje (Citation2002) observed 75% of animals with beards in a West African breed, a highly conserved characteristic.
Most of the correlations between the assessed variables were significant (p < .001) and ranged from 6% to 77% ().
Table 3. Person correlations between the evaluated morphometric variables on Canindé goats.
Low correlations between CG and ES and SP and CW were observed, indicating the independence of these variables. Correlations above 50% were observed for BL, SRH, CG and WH characteristics, related to animal size and length. The correlations found in the present study were higher than those obtained by Ribeiro et al. (Citation2004) which focused on Canindé goats under different environmental conditions and animal numbers. The presence of positive correlations between the assessed variables justifies the use of multivariate analysis. Group analysis () demonstrates relationships between the 11 morphometric variables performed in two distinct groups.
Figure 3. Dendogram obtained from the Euclidean distance and clustering method, highlighting the relationships between 11 morphometric variables. HL: head length; FW: face width; HW: head width; BL: body length; CG: chest girth; WH: wither height; SRH: sacral region height; CW: croup width; CL: croup length; SP: shin perimeter; ES: ear size.
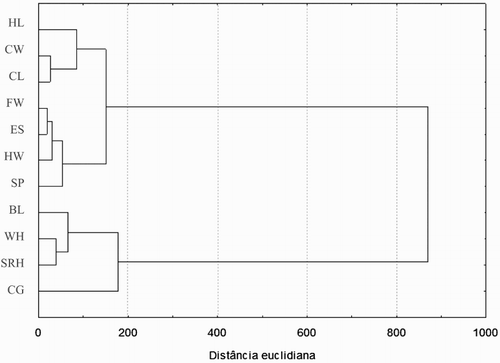
One group was formed by variables which define animal length and height (BL, SRH, WH, and CG) which correlated significantly. Another group comprised the remaining variables.
Five factors explained 76% of total variance of studied morphometric variables (). Okpeku et al. (Citation2011), studying local goats in southern Nigeria (based on five morphometric measurements), found two factors that explained 94.15% and 97.65% of the total variation in females and males, respectively. Yakubu et al. (Citation2011), evaluating morphometric characteristics of African goats, reported that more than 60% of variation was explained by the first component factor in a West African group and 80% for a red Sokoto group.
Table 4. Factors, eigenvalues, simple and total accumulated variation of morphometric traits of Canindé goat breed.
The commonalities found in this study ranged from 0.1854 to 0.7571 () and explain how much a particular characteristic contributes to explain the number of factors being considered (Morrison Citation1976). The SP characteristic showed low commonality, that is, contributed little towards explaining the total accumulated variation in the factors.
Table 5. Factor weights for the 11 morphometric measures of Canindé goats.
This may be associated with reduced factor loading of this variable in the first and second factors. HW showed greater commonality, because of the greater association of this variable with the first factor. FW was the second most important variable in the first factor. These characteristics appear to be important for describing breed and define the animal encephalic profile. The second factor can be termed ‘height factor’, since the loading characteristics were WH and SRH and are the most correlated variables. The trait with higher factor loading in the third factor was BL, defining it as ‘length factor’. In the fourth factor, ES was the greatest loading trait. SP was highlighted as the highest factor loading trait in the fifth (), indicating the lesser importance of these traits in breeding profile.
Conversely, Rodero et al. (Citation2003) reported that SP is indicative of animal hardiness and an important trait in studies of local goat characterization. Taking into consideration animal body areas, both the most important features in all five factors are representative of the main areas.
Okpeku et al. (Citation2011), in studies with goats in Nigeria, showed body size neck length were first and second factors. Herrera et al. (Citation1996), studying local goats in Andalusia, noted that the most discriminant variables were HL, CG, HW, and body weight. Deza et al. (Citation2007), comparing local with exotic goats in Argentina (Anglo Nubian and Saanen), reported that head profile, type and width of ears and type of horn were most discriminatory.
All distances between the populations () were significant (p < .001), indicating that despite belonging to the same breed, there are differences among populations.
Table 6. Distance of Mahalanobis, based on morphometrical and morphological characteristics of Canindé goats between the states.
Each breed corresponds to ecotypes strongly associated to their rearing system, shaping the groups and creating intrabreed diversity, which might be used in conservation programmes.
The longest distance occurred between RN and BA populations (14,.0) due to geographical isolation of these herds, consequently breaking the flow of genes across generations. The shortest distance was observed between PE and BA herds (5.55) because these populations are located very close to each other geographically. These groups consumed a similar diet and were more similar with regard to body size and body length ().
Traoré et al. (Citation2008) evaluated local goats of Bukina Faso (close proximity between evaluated populations) which explains the homogeneity between individuals. Jimcy et al. (Citation2011), with local goats in India, found greater distance between Thrissur goats. Dekhili et al. (Citation2013) found greater distance between local populations of goats in three different environmental areas in the northeast of Algeria.
In the present study, canonical analysis, based on morphometric and morphological characteristics, allowed identification of canonical variables (CAN1 and CAN2), which added 70% and 94% of total variation, respectively (), indicating large reduction in sample space, with little loss to explain the total variation (6%).
Table 7. Total canonical structure based on morphometric and morphological features of Canindé goats.
The majority of studies with goats suggest canonical analysis can reduce sample space with loss very close to this value (Zaitoun et al. Citation2005; Dossa et al. Citation2007; Traoré et al. Citation2008; Jimcy et al. Citation2011). The morphological characteristics showed the greatest contribution in the two canonical variables, which were (in increasing order of importance) hair length, politetia, presence of earring and beard. This suggests that morphology is important in defining breed patterns. A similar observation was reported by Deza et al. (Citation2007) in goats in Argentina.
As shown in , despite the trend of subset formation (highlighting the animals of Rio Grande do Norte) a connection between the herds was observed.
Figure 4. Canonical representation of the morphometric and morphological traits associated with individuals by state. RN: Rio Grande do Norte; PE: Pernambuco; PB: Paraíba; BA: Bahia.
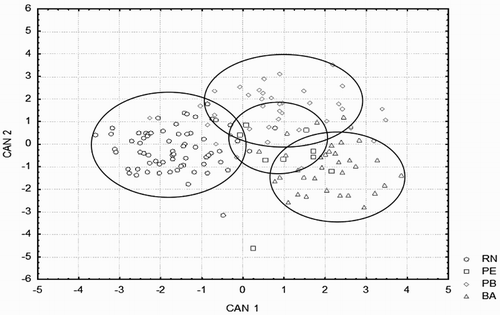
The animals of Pernambuco state are diluted among several groups, which explains the fact that these herds are derived from each other. This arrangement comes from gene flow, promoted by the exchange of male between herds, a common practice between breeders. Gene flow is important to keep genetic variability, mainly between herds of the same breed. Rocha et al. (Citation2007), in studies on Moxotó goats from Pernambuco, Paraíba and Rio Grande do Norte, observed the formation of distinct groups, promoted by geographic isolation, also observed by Oliveira et al. (Citation2010) in studies on these herds with molecular markers.
Most individuals of RN were classified according to the original population (95%), indicating reduced gene flow across populations. This is due to the greatest distances observed between individuals from RN (). In PE, just 66.87% of the individuals were classified in their original population.
In Paraíba State, 71% of the individuals were classified into their origin populational, and 18%, 2.6% and 7.6% were classed as individuals of RN, PE and Ba, respectively. 84.84% of the individuals of BA were grouped with their original population; 6% and 9% were classified as individuals of PE and PB. This indicates a strong connection between the herds, arising from gene flow, an important measure to maintain intrabreed genetic diversity and avoid isolation between herds. Classification errors observed in all groups are due to the connection between these herds, promoted by the exchange of males which is confirmed by the shortest distances between individuals in those groups ().
Table 8. Percentages of individual classification per state based on discriminant analysis.
Dimensions 1 and 2, identified through correspondence analysis (made on the basis of morphological variables) explained 93.08% and 96.89% of total data variance, respectively ().
Figure 5. Representation of correspondence analysis of morphologic variable, associated to the individuals per state in a bidimensional plan. Phorn: presence of horn; Shorthair: short hair; Pearring: presence of earring; Pbeard: presença presence of beard; CPoli: politetia.
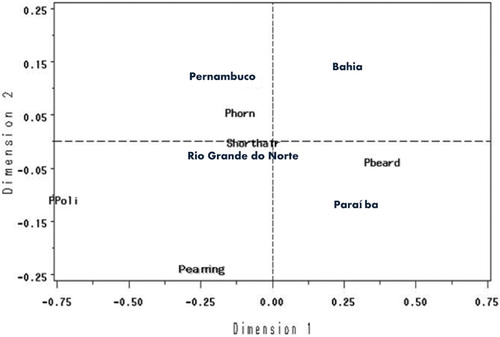
There was a prevalence of animals with Phorn, Shorthair and Pearring in PE and RN states (). On the other hand, there is a strong association of bearded animals in BA and PB. This suggests that the animals of PE and RN are distinct from those of PB and BA for the studied morphological traits.
4. Conclusion
We report that animals of different populations have different morphological and morphometric profiles but they are within the breed standard.
According to discriminant analysis, the qualitative hair, beard, earring, politetia, horn and morphometric (HL, FW, BL, WH and SRH) characteristics were the most important for breed characterization of Canindé goat breed.
Disclosure statement
No potential conflict of interest was reported by the authors.
Related Research Data
References
- Aziz MMA, Al Hur FS. 2013. Differentiation between three Saudi goat types using size-free canonical discriminant analysis. Emir J Food Agric. 25(9):723–735
- Carneiro H, Louvandini H, Paiva SR, Mernies B, McManus C. 2010. Morphological characterization of sheep breeds in Brazil, Uruguay and Colombia. Small Ruminant Res. 94:58–65. doi: 10.1016/j.smallrumres.2010.07.001
- Cazar RA. 2003. An exercise on chemometrics for a quantitative analysis course. J Chem Educ. 80(9):1026–1029. doi: 10.1021/ed080p1026
- Dekhili M, Bounechada M, Mannalah I. 2013. Multivariate analyses of morphological traits in Algerian goats, Sétif, north-eastern Algeria. Anim Genet Resour. 52:51–57. doi: 10.1017/S2078633613000040
- Deza C, Diaz MP, Varela L. 2007. Caracterización del caprino del Noroeste de La província de Córdoba (Argentina) y su relácion com La aptitud produtiva. Sitio Argentino de Produção Animal. 1–7. Available from: http://www.produccion-animal.com.ar/produccion_caprina/produccion_caprina/107-Deza-caprinoscriollos.pdf
- Dossa LH, Wollny C, Gauly M. 2007. Spatial variation in goat populations from Benin as revealed by multivariate analysis of morphological traits. Small Ruminant Res. 73:150–159. doi: 10.1016/j.smallrumres.2007.01.003
- Ferraudo AS. 1995. Técnicas de Análise Multivariada. São Caetano do Sul: 1ª Edição.
- Hair JF, Anderson RE, Tatham RL, Black WC. 1998. Multivariate Data Analysis. 5th ed. Upper Saddle River, NJ: Prentice Hall.
- Herrera M, Rodero E, Gutierrez MJ, Pena F, Rodero JM. 1996. Application of multifactorial discriminant analysis in the morphostructural differentiation of Andalusian caprine breeds. Small Ruminant Res. 22:39–47. doi: 10.1016/0921-4488(96)00863-2
- Jimcy J, Raghavan KC, Sujatha KS. 2011. Diversity of local goats in Kerala, India, based on morpho-biometric traits. Livest Res Rural Dev., 23:5. Available from: http://www.lrrd.org/lrrd23/5/jimc23119.htm
- Jolliffe IT. 1972. Discarding variables in a principal component analysis. I: artificial data. Appl Stat. 21:160–173. doi: 10.2307/2346488
- Jolliffe IT. 1973. Discarding variables in a principal component analysis. II: real data. Appl Stat. 22:21–31. doi: 10.2307/2346300
- Lanari MR, Taddeo H, Domingo E, Centeno MP, Gallo L. 2003. Phenotypic differentiation of exterior traits in local Criollo goat population in Patagonia (Argentina). Arch Tierz Dummerstorf. 46:347–356.
- Legaz E, Cervantes, I, Perez-Cabal MA, De la Fuente LF, Martinez R, Goyache F, Gutiérrez JP. 2011. Multivariate characterization of morphological traits in Assaf (Assaf. E) sheep. Small Ruminant Res. 100:122–130. doi: 10.1016/j.smallrumres.2011.06.005
- Morrison DF. 1976. Multivariate statistical methods. 2nd ed. New York: McGraw-Hill Company; 415.
- Okpeku M, Yakubu A, Peters SO, Ozoje MO, IkeobiI CON, Adebambo OA, Imumorin IG. 2011. Application of multivariate principal component analysis to morphological characterization of indigenous goats in Southern Nigeria. Acta Agr Slov. 98(2):101–109.
- Oliveira JCV, Ribeiro, MN, Rocha LL, Gomes-Filho MA, Delgado JV, Martinez AM, Menezes MPC, Bettencourt CM, Gama LT. 2010. Genetic relationships between two homologous goat breeds from Portugal and Brazil assessed by microsatellite markers. Small Ruminant Res. 93:79–87. doi: 10.1016/j.smallrumres.2010.05.002
- Ozoje MO. 2002. Incidence and relative effects of qualitative traits in West African Dwarf goats. Small Ruminant Res. 43:97–100. doi: 10.1016/S0921-4488(01)00264-4
- Revidatti MA, Prieto PN, De La Rosa S, Ribeiro MN, Capellari yA. 2007. Cabras criollas de la región norte Argentina. Estudio de variables e índices zoométricos. Archivos de Zootecnia. 56:479–482.
- Ribeiro MN, Pimenta Filho EC, Cruz GRB, Arnauld BL, Oliveira SMP, Rodrigues DS, Gama LT. 2010. Estrutura genética de populações e importância para conservação e melhoramento de raças em perigo. In: Ximenes LJF, Martins GA, Morais OR, Costa LA, Nascimento JLS, ( Org.). editors. Ciência e Tecnologia na Pecuária Caprina e Ovina. 1st ed. Fortaleza: BNB, vol. 5; p. 340–362.
- Ribeiro MN, Da Silva JV, Pimenta Filho EC, Sereno yJRB. 2004. Estudio de lãs correlaciones entre características fenotípicas de caprinos naturalizados. Archivos Zootecnia. 53:337–340.
- Rocha LL, Da Benício RC, Oliveira JCV, Ribeiro MN, Delgado eJV. 2007. Avaliação morfoestutural de caprinos da raça Moxotó. Archivos de Zootecnia. 56:483–488.
- Rodero E, Herrera M, Peña F, Molina A, Valera M, Sepúlveda yN. 2003. Modelo morfoestrutural de los caprinos lecheros españoles florida y payoya em sistemas extensivos. Rev Cient. 13(5):403–412.
- SAS, SAS/STAT User's guide. Version 8. v.2. Cary: SAS Institute Inc. 1999. (Software Estatístico).
- Silva JV, Ribeiro MN, Pimenta Filho EC, Sereno JRB. 2004. Caracterización fenotípica de caprinos naturalizados en Brasil. Archivos de Zootecnia, Córdoba, n. prelo.
- STATISTICA (data analysis software system), version 8. 2009. ( Software Estatístico).
- Traore A, Tamboura HH, Kabore A, Royo LJ, Fernandez I, Alvarez I, Sangare M, Bouch-El D, Poivey JP, Francois D, … Goyache F. 2008. Multivariate analyses on morphological traits of goats in Burkina Faso. Arch Tierzucht. 51:588–600.
- Yakubu A, Salako AE, Imumorin IG. 2011. Comparative multivariate analysis of biometric traits of West African Dwarf and Red Sokoto goats. Trop Anim Health Prod. 43:561–566. doi: 10.1007/s11250-010-9731-y
- Zaitoun IS, Tabbaa MJ, Bdour S. 2005. Differentiation of native goat breeds of Jordan on the basis of morphostructural characteristics. Small Ruminant Res. 56:173–182. doi: 10.1016/j.smallrumres.2004.06.011
- Zepeda JSH, Franco Guerra FJ, Garcia MH, Serrano, ER, Vázquez S, Delgado-Bermejo JV. 2002. Estudio de los Recursos Genéticos de México: Características Morfológicas y Morfoestructurales de los Caprinos Locais de Puebla. Archivos de Zootecnia. 51(193–194):53–64.