
ABSTRACT
Bovine-specific microsatellite markers were used to assess the genetic variation in Belahi cattle. Both within-breed (Belahi) and between-breed (Sahiwal, Gir, Tharparkar, Rathi, Nagori, Mewati, Kankrej and Belahi breeds) diversity indices were estimated. Sixteen microsatellite loci were polymorphic with more than five alleles per locus. Mean allelic diversity was 9.31, with a total of 149 alleles. Polymorphism information content varied from 0.31 (TGLA227) to 0.87 (CSSM33) with an average of 0.71. Estimate of Nei’s gene diversity was 0.72 ± 0.15. The observed and expected heterozygosity at different loci were 0.69 ± 0.17 and 0.71 ± 0.15 and varied from 0.30 (TGLA227) to 0.88 (TGLA122) and 0.32 (TGLA227) to 0.88 (CSSM33), respectively. Within-population inbreeding estimates (FIS) for Belahi cattle was 0.0337, indicating an average deficiency of 3.37%. Belahi cattle revealed the presence of genetic diversity within population and there was no significant heterozygosity excess indicating the absence of genetic bottleneck in the recent past. Global FST estimates demonstrated that 85% of the total variation was contributed by within-breed genetic differentiation, while 15% genetic variation was present across different breeds. Nei’s standard genetic distance estimates among the studied milch breeds varied from 0.27 (Tharparkar and Rathi) to 0.51 (Tharparkar and Sahiwal), whereas in studied dual-purpose breeds, it varied from 0.07 (Kankrej and Mewati) to 0.90 (Belahi and Mewati). Unweighted Pair Group Method with Arithmetic Mean based phylogenetic tree constructed from the Nei’s genetic distances revealed that Sahiwal and Belahi cattle were grouped together in one cluster. However, Kankrej and Mewati were found to be closely related breeds.
1. Introduction
Local cattle are integral contributor of food, agricultural power, agrarian culture and heritage and biodiversity as well. (FAO Citation2007)
Livestock genetic resources in India comprise 190.90 million cattle, 37.28% of the total livestock (BAHS Citation2014), of which 11.62% of indigenous cattle have been described and categorized into 44 different populations, including 39 distinct and registered cattle breeds. On the utility basis, these have been classified as milch, draught or dual purpose. Among the identified breeds, only 5 breeds are exclusively for dairy purpose and 10 are for milk and draught purpose. Of the total indigenous cattle genetic resource, hardly 6–7% are well defined. These defined breeds are well adapted across varied agro-climatic conditions of India. However, huge cattle genetic resource still remains untapped, which needs to be identified and utilized for milk production, especially the less-known and migratory cattle populations. Moreover, such cattle resources play a crucial role in securing livelihood and in the well-being of the traditional rural livestock keepers. One such newly registered cattle breed, Bos indicus, from North Himalayan foothills is Belahi (Breed Accession Number: INDIA_CATTLE_0532_BELAHI _03038). This rare migratory breed has about 20,000 animals and is well adapted to local environment and is an excellent dual-purpose (milk and draught) cattle genetic resource under extensive management system and provides livelihood security to Gujjar pastoralists of the region (Vohra et al. Citation2014). Belahi cattle is a distinct population based on body biometry traits, management practices and utility. Besides they possess geographically distinct breeding tract from other extant cattle breeds of the country (Vohra et al. Citation2012).
Genetic differentiation and diversity analysis of native breeds is an important step in genetic characterization, as it allows the evaluation of unexplored genetic variability. Assessment of genetic variability present in a breed is vital and it should be a basic component for working out conservation strategies and for designing genetic improvement programmes for a particular breed. Recently, microsatellite or short tandem repeat (STR)-based markers have been used to characterize the genetic variability, within and between populations. They are neutral markers and have high variability, widespread distribution throughout the genome and have shown a co-dominant inheritance. Microsatellites are best suited to evaluate genetic diversity (Metta et al. Citation2004; Li et al. Citation2005; Yoon et al. Citation2005; Sodhi et al. Citation2005, Citation2006; Pandey, Rekha, Singh, et al. Citation2006, Pandey, Rekha, Yatender, et al. Citation2006; Sharma et al. Citation2013) and relationships among cattle populations from Africa, Europe and Asia (Moazami-Goudarzi et al. Citation1997; Machugh et al. Citation1998; Martín-Burriel et al. Citation1999; Mommens et al. Citation1999; Beja-Pereira et al. Citation2003; Jordana et al. Citation2003). Using a set of bovine-specific microsatellite markers, Mukesh et al. (Citation2004) studied the genetic diversity (both within and between) and relationship among the three important Indian cattle breeds, namely Sahiwal, Hariana and Deoni. Moreover, microsatellite markers had also been used as suitable tool for linkage mapping, identification of quantitative trait loci, parentage determination (Bruford & Wayne Citation1993). Although the genetic relationship between some indigenous cattle breeds of India have been reported earlier, the important migratory cattle breed, Belahi, was not studied before. The allelic diversity of Belahi breed and its genetic relationship with other indigenous cattle breeds is poorly understood. Hence, the present study was undertaken with the objectives of evaluating within-breed diversity of Belahi cattle and to assess between-breed diversity using multi-locus STR markers and to establish the phylogenetic relationship among the important Indian cattle breeds of India.
2. Material and methods
2.1. Populations studied
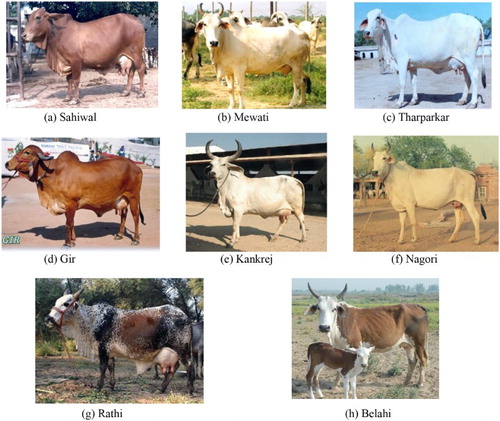
A total of 48 random animals were taken from different villages, covering the entire native tract of each breed. During sampling the care was taken that no two individuals are related, that is, all the individual have different sire and dam and are genetically unrelated as far as possible. Within-breed diversity indices were estimated in Belahi cattle and its between-breed diversity was compared with Sahiwal, Gir, Tharparkar, Rathi, Nagori, Mewati and Kankrej breeds of cattle. Belahi (a less-known migratory cattle) derived its name based on typical body colour pattern, which is a mix of reddish brown coat colour with white face, abdomen and extremities ((h)). Utility of Belahi cattle is a milch-cum-draught breed (dual purpose). Animals of Belahi cattle are distributed in North Himalayan foothills with its breeding tract in North eastern parts of Haryana, Punjab and Himachal Pradesh (Vohra et al. Citation2012). Sahiwal cattle are distributed in North-western parts of Punjab and Rajasthan, border areas between India and Pakistan (Nivsarkar & Gupta Citation2000). Tharparker, Gir and Kankrej cattle are found in Rajasthan and Gujarat states, whereas Nagori and Rathi are the breeds of Rajasthan. Sahiwal is a heavy-built milch breed with brownish red coat colour ((a)). Mewati animals are found in North-western parts of Haryana, eastern Rajasthan and Western Uttar Pradesh (Singh et al. Citation2007) and are usually white in colour with neck, shoulders and quarters of a darker shade ((b)). Tharparkar has been developed as a typical breed adapted to the desert conditions and Tharparkar animals are white or light grey in colour ((c)). Gir is a milch breed and animals of the breed are pure red/speckled red in colour with basic skin colour as white with red or black patches with typical convex head and pendulous ears ((d)) (Singh et al. Citation2006). Kankrej is a dual-purpose migratory cattle. The animals of Kankrej breed have thick skin, broad chest, straight and powerful body with white, grey and iron grey coat colours ((e)) (Vohra et al. Citation2011). Like Tharparker, Nagori are white to light grey in colour and have a proportionately built body ((f)). Rathi is a medium-sized breed with symmetrical body. Rathi animals are usually brown with white patches all over the body ((g)).
Figure 1. Different cattle breeds studied: (a) Sahiwal, (b) Mewati, (c) Tharparkar, (d) Gir, (e) Kankrej, (f) Nagori, (g) Rathi and (h) Belahi.
2.2. Sample collection and isolation of genomic DNA
Blood samples were collected aseptically in EDTA-coated tubes from all the animals under study. Genomic DNA was isolated from blood samples following phenol–chloroform extraction method, as described by Sambrook and Russel (Citation2001). DNA concentration was quantified by spectrophotometric method at OD 260: 280.
2.3. Polymerase chain reaction amplification of microsatellite loci
Belahi cattle were genotyped using 16 microsatellite markers. The details of the primers are presented in . Forward primer of each microsatellite marker was 5′-labelled with FAM (Blue), VIC (Green), NED (Yellow) or PET (Red) fluorescence tags in order to perform fragment length analysis of the polymerase chain reaction (PCR) products with automated DNA sequencer (ABI 3100). For accurate sizing, primers producing fragment size >75 bp were preferred. The microsatellite loci with overlapping size range were labelled with different dyes to facilitate multiplexing. Each PCR was carried out in 15 μl reaction volume consisting of 200 µM of each dNTP, 5 pM of each primer, 1.5 mM MgCl2 and 1.2U Taq polymerase (Invitrogen, CA). Amplification was performed using MASTERCYCLER EP (Eppendorf, Germany) with an initial denaturation at 95°C for 2 min followed by 30 cycles of 94°C for 60 s, respective annealing temperature (50–65°C) for 60 s and 72°C for 60 s, with a final extension for 10 min at 72°C. After completion of PCR cycle, amplification was confirmed by running a small aliquot of PCR product on 2% agarose gel. To maximize the throughput, products amplified by different primers with different dyes were pooled for one capillary injection. For fragment sizing, GeneScan-500 LIZ™ Size Standard (Applied Biosystems) was used as the internal standard. Internal lane size standard was run with every sample for accurate sizing. The samples were loaded on to ABI PRISM 3100 DNA analyser for genotyping using 36 cm array. For calculation of the molecular weight (size) of different alleles/DNA fragments, Gene Scan software was used.
Table 1. Microsatellite loci information, primer sequences with fluorescent tag and PCR amplification conditions used for analysing individual sample.
2.4. Statistical analysis
Different within-breed diversity measures were estimated using POPGENE software (Yeh et al. Citation1999). Allele frequencies estimated were utilized for assessing polymorphism information content (PIC) values as per Botstein et al. (Citation1980). To compute estimates of exact probabilities (p value) for departure from Hardy–Weinberg equilibrium among the microsatellite loci was investigated. The neutrality of all the markers employed in this study was checked with POPGENE software by applying Ewens–Watterson test. The test calculates the quantity F, which is equal to the sum of squared allele frequencies.
Genetic bottleneck tests are rooted in a wider class of population genetic methods aimed at detecting departures from expectations under mutation-drift equilibrium. Population genetic tests of mutation-drift equilibrium typically contrast two different indices of genetic diversity. One measure is expected to be only marginally affected by the underlying process causing deviations from mutation-drift equilibrium and represents a baseline against which the second, more sensitive, diversity index is compared. Examples of genetic diversity indices employed in mutation-drift equilibrium tests that are expected to be less affected by a population bottleneck initially are nucleotide diversity, heterozygosity and the variance and range in microsatellite allele size. In contrast, a greater reduction is expected in the number of alleles and segregating sites, particularly rare ones. In the present study, to estimate the bottleneck events in the investigated Indian cattle breed, two different approaches were followed. The first approach based on the heterozygosity excess consisted of three tests: sign test, standardized differences test and a Wilcoxon signed-rank test. These methods test for the departure from mutation-drift equilibrium based on heterozygosity excess or deficiency. The probability distribution was established using 1000 simulations under three models: infinite allele model (IAM), stepwise mutation model (SMM) and two-phase mutation model (TPM). The test was conducted using Bottleneck 1.2.01 software (Piry et al. Citation1999). Another test that was used to depict the bottleneck analysis was based on graphical representation of mode-shift equilibrium. This is based on the assumption that in bottlenecked populations one or more of the common allele classes have a higher number of alleles than the rare allele class. This test was re-scaled so that frequency distribution of the allele frequency classes in each population would be based on equal increments of 0.05.
For establishing genetic relationships of Belahi cattle with other cattle breeds, microsatellite data generated for Belahi cattle were compared with microsatellite data already generated in the lab for native breeds adapted to arid and semi-arid regions of north-western India (Sodhi et al. Citation2011). The cattle breeds and their respective sample sizes (given in parenthesis) analysed in the study are Sahiwal (48) from Punjab and National Dairy Research Institute, Karnal, Haryana; Gir (48) and Kankrej (32) from Gujarat; Tharparkar (47), Rathi (47), Nagori (40) and Mewati (48) from Rajasthan. Different F-statistics estimates – total inbreeding estimate (F), global inbreeding estimate (f) and measurement of population differentiation (θ) which are analogous to Wright’s (Citation1951, Citation1978) FIT, FIS and FST, respectively – were estimated using the program FSTAT ver. 2.9.3.2 (Goudet Citation2002). Means and standard deviations of F-statistics parameters were obtained across breeds by using the Jackknifing procedure over all loci. Population differentiation was also analysed by exact test based on the principle that whether the allelic composition is independent of population assignment. Nei’s DS and DA-based methods (Nei Citation1972) were applied to calculate between-breed genetic distances using microsatellite allele frequency data.
3. Results and discussion
Present investigation is the first detailed genetic analysis of Belahi cattle using microsatellite markers. All microsatellite loci amplified well and exhibited sufficiently high levels of polymorphism, making them effective in detecting genetic variation in the studied cattle breed. Various variability parameters (i.e. observed and effective number of alleles and expected heterozygosity at different microsatellite markers) are presented in .
Table 2. Genetic heterogeneity estimates at each microsatellite locus in Belahi cattle.
3.1. Markers informativeness
Average PIC value indicates the informativeness of a genetic marker. The PIC estimates showed that most of the loci were highly informative with an overall mean of more than 0.71 ± 0.14 () as usually more than 0.5 PIC is desirable for microsatellite markers for better efficiency of marker in analysing genetic diversity among native Indian cattle breed. Locus TGLA227 showed minimum PIC value (0.32), whereas highest PIC values were observed at locus CSSM08 (0.87). Rehman and Khan (Citation2009) reported a little higher PIC (0.74) in Hariana cattle, whereas Pandey, Rekha, Yatender, et al. (Citation2006) and Sodhi et al. (Citation2006) reported a little lower PIC value of 0.66 and 0.60, respectively, in Kherigarh and Tharparkar cattle breeds; a probable reason for this could be the difference in number of microsatellite loci used to evaluate PIC. However, about 87.5% of the markers were observed to be highly informative (PIC > 0.50) and the remaining 12.5% (that is MM8 and TGLA227) were also reasonably informative (0.50 > PIC > 0.31) in Belahi cattle. Our findings are in agreement with Kumar et al. (Citation2003), Metta et al. (Citation2004), Mukesh et al. (Citation2004), Sodhi et al. (Citation2006) and Pandey, Rekha, Yatender, et al. (Citation2006) in various indigenous cattle breeds.
3.2. Genetic diversity and within-breed genetic variation
In total 149 microsatellite alleles were observed across 16 loci surveyed in 48 animals of Belahi cattle with mean number of 9.31 alleles at each locus. The studied 16 microsatellite loci were found to be polymorphic with 5 or more than 5 alleles per locus. The most polymorphic marker was HEL1 with a total of 15 alleles and the least polymorphic markers were BM1824 with 5 alleles (). Most of the loci showed a similar trend in terms of allele numbers with the earlier characterized cattle breeds. The observed number of alleles in Belahi cattle was higher than observed in other Indian breeds (Mukesh et al. Citation2004; Pandey, Rekha, Singh, et al. Citation2006; Pandey, Rekha, Yatender, et al. Citation2006), namely Hariana (6.5), Sahiwal (5.2), Deoni (5.9), Kenkatha (5.95) and Kherigarh (3.77) cattle. Our findings had shown moderately higher number of alleles; this could be due to the presence of higher heterogeneity present in Belahi population. The effective number of alleles (Ne) across all loci was distinctively less () than the observed values ranging from 1.47 (TGLA227) to 7.53 (CSSM33). On analysing the data for heterozygosity, the average expected gene diversity (Hexp) over all loci was sufficiently high and ranged from 0.32 (TGLA227) to 0.87 (CSSM08) with an overall mean of 0.72 ± 0.15. Only two loci (MM8 and TGLA227) exhibited Hobs values less than 0.400, whereas at 13 other loci, Hobs was more than 0.60. The mean values of Hobs were lower at most of the loci than the Hexp, which reflected less heterozygous status of population than it was expected. However, considerable high heterozygosity values indicated the existence of substantial genetic variability in the studied population. Similar high values for observed and expected heterozygosity have been observed for Kherigarh (0.71) cattle (Pandey, Rekha, Singh, et al. Citation2006) However, many workers reported comparatively lower mean expected heterozygosity, 0.67 in Tharparkar cattle (Sodhi et al. Citation2006) and Hariana cattle (Rehman & Khan Citation2009); 0.59 in Deoni cattle (Mukesh et al. Citation2004) and 0.68 in Kherigarh cattle (Pandey, Rekha, Yatender, et al. Citation2006). The mean observed heterozygosity values, though lower than the expected values, exhibited failure of significant differences suggesting random mating in Belahi cattle. Shannon’s Information Index, which measures the level of diversity, was sufficiently high in Belahi cattle with an overall mean of 1.62. Within-population inbreeding estimates (FIS) for Belahi cattle is depicted in . The estimate ranged between −0.17 and 0.23 and was positive in most of the cases with an average FIS value of 0.033. Thus, on an average deficiency of 3.37% of heterozygotes existed in Belahi cattle. Our results were similar to those reported by Sharma et al. (Citation2013) in Bachaur, Shahbadi, Purnea and Siri cattle from Northeast of India. Slightly higher inbreeding estimates of 0.14 and 0.18 were reported in Tharparkar and Kherigarh cattle, respectively (Pandey, Rekha, Singh, et al. Citation2006; Sodhi et al. Citation2006). However, comparatively higher inbreeding estimates were reported in Sahiwal (0.32), Kenkatha (0.21) and Hariana (0.25) cattle (Mukesh et al. Citation2004; Pandey, Rekha, Yatender, et al. Citation2006; Rehman & Khan Citation2009). Our findings suggests that Belahi cattle has considerable genetic variability with very low inbreeding, compared to other indigenous cattle breeds of India; the probable reason could be the migratory nature and use of sires from diverse locations. All the 10 of 16 markers except INRA35, INRA63, BM1824, ILSTS11, CSRM60 and TGLA122 contributed to this observed heterozygote shortage. Heterozygote deficiency analysis revealed deviations from Hardy–Weinberg equilibrium (p < .01) at 7 of 16 loci in Belahi cattle. It is difficult to predict the exact basis of this departure, but the probable reasons could be the presence of null alleles (Callen et al. Citation1993), Wahlund effect, physical linkage and epistatic selection.
Ewens–Watterson neutrality test was performed for each of the 16 microsatellite loci. The observed sum of squared allele frequencies (Obs. F) was compared with 95% confidence intervals (CI) for expected sum of squared alleles using 5000 simulations. The overall test for neutrality showed that observed F values were within the lower and upper limits of the 95% CI region for most of the loci. Only for TGLA122 and TGLA227 microsatellite loci (), the observed F values were marginally outside the upper and lower limits of the 95% CI region. All other loci in were neutral with observed homozygosity values higher than the expected homozygosity (Min F), thus indicating the absence of selection in the population except for two regions which point towards the selection for some economic trait.
Table 3. The Ewens–Watterson test for neutrality at each microsatellite locus in Belahi cattle.
3.3. Bottleneck analysis
Bottle neck hypothesis was explored in Belahi cattle population. According to this hypothesis, if the population that has experienced the recent reduction, effective population size exhibit a correlation in reduction of allele numbers and gene diversity. In a population at mutation-drift equilibrium (i.e. the effective size of which has remained constant in the recent past), there is approximately an equal probability that a locus shows a gene diversity excess or a gene diversity deficit. Populations that have experienced a recent reduction of their effective population size exhibit a correlative reduction of the allele numbers and gene diversity (He, or Hardy–Weinberg heterozygosity) at polymorphic loci. But the allele numbers is reduced faster than the gene diversity. Thus, in a recently bottlenecked population, the observed gene diversity is higher than the expected equilibrium gene diversity. However, the allele number is reduced faster than the gene diversity. Therefore, in a population experiencing bottleneck, the observed gene diversity is higher than the expected gene diversity which is computed from the observed number of alleles, under the assumption of a constant-size (equilibrium) population (Luikart et al. Citation1998). Three different tests, namely sign rank, standardized differences and Wilcoxon tests under all the three models (Cornuet et al. 1996) of microsatellite evolution (IAM, SMM and TPM) were employed to investigate whether Belahi cattle populations has undergone recent bottleneck (). Most often, gene diversity excess has been demonstrated only for loci evolving under the IAM. If the locus evolves under the strict SMM, there can be situations where this gene diversity excess is not observed (Cornuet & Luikart Citation1996). However, few loci follow the strict SMM and as soon as they depart slightly from this mutation model towards the IAM, they will exhibit a gene diversity excess as a consequence of a genetic bottleneck. Because few microsatellite loci follow the strict (one-step) SMM, it is recommend using the TPM test. The TPM is intermediate to the SMM and IAM. Most microsatellite data sets better fit the TPM than the SMM or IAM. However, TPM consists of mostly one-step mutations, with a small percentage (5–10%) of multi-step changes (Luikart et al. Citation1998). To check whether a population exhibits a significant number of loci with gene diversity excess, three tests (i.e. sign test, standardized differences test and Wilcoxon test) were conducted. Amongst the three tests, Wilcoxon’s test is considered best as it works well with as few as four polymorphic loci and any number of individuals, although 15–40 individuals and 10–15 polymorphic loci is generally recommended to get good results. Conversely, sign test suffers from low statistical power and standardized differences test requires at least 20 polymorphic loci (Luikart & Cornuet Citation1997). The values for three tests conducted for the Belahi cattle were significant and thereby null hypothesis of mutation-drift equilibrium was rejected. Our findings were similar to those reported by Deepika and Salar (Citation2012), who reported absence of recent genetic bottleneck in grey-coloured cattle breeds (Hariana, Nagori, Mewati, Tharparkar and Kankrej) of India. Thus, Belahi cattle revealed moderate genetic diversity within population; although the population is deviating from mutation-drift equilibrium (except IAM), there was no significant heterozygosity excess indicating the absence of genetic bottleneck in the recent past.
Table 4. Different test for mutation-drift equilibrium in the 16 microsatellite loci in Belahi cattle.
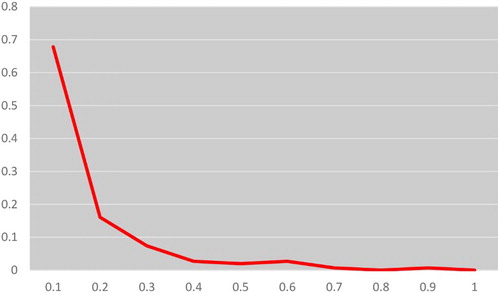
Another powerful test of qualitative graphical method based on mode-shift distortion was also utilized to visualize the allele frequency spectra as an indicator for genetic bottleneck. The qualitative descriptor of the allele frequency distribution (mode-shift indicator) which discriminates bottlenecked populations from stable populations (Luikart & Cornuet Citation1997). No mode-shift (Luikart & Cornuet Citation1997) was detected in the frequency distribution of alleles, and the alleles with the lowest frequencies (0.01–0.1) were found to be most abundant (). The results indicated the absence of any recent bottlenecks in Belahi cattle.
Figure 2. Mode-shift test for bottleneck analysis in Belahi cattle.
3.4. Between-breed diversity and analysis of F-statistics and gene flow for microsatellite loci in different milch and dual-purpose cattle breed
The multi-locus data generated for Belahi cattle were compared with similar data on Sahiwal, Gir, Tharparkar, Rathi, Nagori, Mewati and Kankrej breeds of cattle. Population differentiation was examined by fixation indices FIT, FIS and FST using the methods of Weir and Cockerham (Citation1984) for each of the 16 analysed loci. As presented in , mean estimates of F-statistics over loci were F(FIT) = 0.1985 (total inbreeding estimate), f(FIS) = 0.0506 (within-population inbreeding estimate) and θ(FST) = 0.1558 (population differentiation). The global deficit of heterozygotes across population (FIT) amounted to 19.85% (p < .05). An overall significant deficit of heterozygotes (FIS) of 5.1% (p < .05) occurred across the analysed loci. From bootstrap analysis, the true value of FIS-statistic, with a 95% CI, ranged from −0.09 (CSRM60) to 0.253 (TGLA227). Except for four loci (CSSM08, CSRM60, ILSTS011 and HEL1), all other loci contributed significantly to the heterozygote deficit within population (FIS). Three loci (TGLA227, MM12 and ILST006) contributed maximally for the observed deficit (), while all other loci except CSSM08, CSRM60, ILSTS011 and HEL1 significantly affected the global heterozygote deficit (FIT). The value of breed differentiation obtained in our study was similar to those reported for other indigenous and exotic cattle breeds. For example, 11.3% in Hariana, Deoni and Sahiwal (Mukesh et al. Citation2004), 11.2% in 7 European cattle (Machugh et al. Citation1998), 9% in Swiss cattle (Schmid et al. Citation1999) and 10.7% in 20 North European cattle breeds (Kantanen et al. Citation2000).
Table 5. Global F-statistics (within-population and between-population inbreeding estimate, and measurement of population differentiation) and gene flow for each microsatellite locus in different milch and dual utility cattle breeds.
The genetic differentiation values (FST) per locus varied from 0.05 (MM8) to 0.51 (HEL1) with an average of 0.156 across all the loci. All the microsatellite loci (p < .05) significantly contributed to this differentiation. The FST values implied that overall genetic differentiation among breeds was moderate, but significantly different from zero. Average FST value indicated that 15.6% of the total genetic variation corresponded to breed differences while the remaining 84.4% corresponded to differentiation among individuals. The effective number of migrants (Nm) was estimated as 1.35 pointing to moderate gene flow and continuity among different cattle breeds. Our results were not in agreement with Deepika and Salar (Citation2012), who reported lower F-statistic (FST = 0.07; FIS = 0.03; FST = 0.07) and higher gene flow (Nm = 4.06) in 10 breeds of grey colour indigenous cattle of India. This could be due to admixture of Hariana cattle with other grey colour indigenous cattle, while it is not the case with Belahi cattle.
3.5. Genetic distance and phylogenetic relationship
Nei’s genetic distances among eight different milch cattle breeds are presented in . The least distance (0.06) was found between Mewati with Kankrej cattle. The highest (0.90) genetic distance was observed between Mewati and Belahi cattle. The distance among the milch breeds (Sahiwal, Gir and Tharparkar) varied from 0.40 (Gir and Sahiwal) to 0.51 (Tharparkar and Sahiwal), whereas the distance among the dual-purpose breed (Kankrej, Mewati, Rathi and Belahi) varied between 0.36 (Rathi and Belahi) and 0.90 (Belahi and Mewati). Thus, the genetic distance among dual-purpose cattle breeds was found to be higher than that from milch breeds studied.
Table 6. Nei’s genetic identity and genetic distance estimates among different milch and dual-purpose cattle breeds.
Nei’s genetic distances were used to prepare genogram tree to delineate phylogenetic relationship among cattle populations and are presented in . Kankrej and Mewati breeds showed closest relationship. Similarly, Tharparkar and Rathi grouped together in one cluster. Noteworthy finding is that Belahi cattle was clubbed with Sahiwal breed in a separate cluster and genetic closeness of Belahi cattle with Sahiwal (a good milch cattle) indicates the milk potential of this rare migratory cattle of North India. Probable reason for this similarity could be nearby geographical locations of these two breeds. Moreover, the stake holders of both Belahi and Sahiwal breeds of cattle are same (Gujjars) and it is hypothesized that during the course of time Belahi sub-group must have been separated Sahiwal cattle or migrated away towards foothills, leading to difference in climate. However, genetic divergence time and drift further needs to be studied for these cattle breeds.
Figure 3. Genogram showing the different clusters of milch and dual-purpose cattle from India.
4. Conclusion
The present work thus clearly demonstrates the effectiveness of studied STR markers in delineating the existing diversity levels, population structure, phylogeny and inferring the level of inbreeding among populations, even though the studied cattle breeds are evolutionary close populations with less between-breed differentiations. The present study revealed the first-hand information on analysis of genetic diversity in Belahi cattle, thus providing valuable insight to its existing genetic variability. Although Belahi cattle lacks the pan India distribution and has a lower population size (approx. 20,000), despite that, a comparatively higher degree of variability was realized, implying that sufficient genetic diversity exist in Belahi cattle breed. This fact, together with distinctive environmental adaptation (migratory cattle) of Belahi cattle, consolidates the significance of its conservation as a valuable pure breed and its utilization as dual-purpose cattle from North India. Results obtained from the present study will be helpful in designing breeding plan for genetic improvement, as well as for setting up priority in conservation for Belahi cattle.
Acknowledgement
Authors show sincere gratitude to all the livestock keepers who allowed sample collections from their animals. Assistance of Smt. Parvesh Kumari, Technical Officer and Miss Preeti, Senior Research Fellow, from ICAR-NBAGR is duly acknowledged.
Additional information
Funding
Related Research Data
References
- BAHS. 2014. Basic animal husbandry statistics. New Delhi: Department of Animal Husbandry and Dairying, Ministry of Agriculture, Govt. of India.
- Beja-Pereira A, Alexandrino P, Bessa I, Carretero Y, Dunner S, Ferrand N, Jordana J, Laloe D, Moazami-Goudarzi K, Sanchez A, Canon J. 2003. Genetic characterization of South Western European bovine breeds: a historical and bio geographical reassessment with a set of 16 microsatellites. J Hered. 94:243–250. doi: 10.1093/jhered/esg055
- Botstein DR, White RL, Skolnick M, Davis RW. 1980. Construction of a genetic linkage map in man using restriction fragment length polymorphisms. Am J Hum Genet. 32:314–331.
- Bruford MW, Wayne RK. 1993. Microsatellites and their application to population genetic studies. Curr Opin Genet Dev. 3:939–943. doi: 10.1016/0959-437X(93)90017-J
- Callen DF, Thompson AD, Shen Y. 1993. Incidence and origin of ‘Null’ alleles in the (AC)n microsatellite markers. Am J Hum Genet. 52:922–927.
- Cornuet JM, Luikart G. 1996. Analysis of two tests for detecting recent population bottlenecks from allele frequency data. Genetics. 144:2001–2014.
- Deepika, Salar RK. 2012. Genetic diversity and bottleneck analysis of indigenous grey cattle breeds of India based on microsatellite data. DHR Int J Biomed Life Sci. 3(1):174–184. Available from: http://www.doublehelixresearch.com/files/journals/dhr-ijbls/vol-3/issue-1/1.pdf.
- FAO. 2007. Uses and values of animal genetic resources. In: The State of the World’s Animal Genetic Resources for Food and Agriculture. Commission on Genetic Resources for Food and Agriculture. Rome: Food and Agriculture Organization of United Nations; p. 77–100.
- Goudet J. 2002. FSTAT computer package for PCs. Lausanne: Institute of Ecology, UNIL.
- Jordana J, Alexandrino P, Beja-Pereira A, Bessa I, Cañón J, Carretero Y, Dunner S, Laloe D, Ferrand N, Moazami-Goudarzi K, Sánchez A, Ferrand N. 2003. Genetic structure of eighteen local South European beef cattle breeds by comparative F-statistics analysis. J Ani Breed Genet. 120:73–87. doi: 10.1046/j.1439-0388.2003.00384.x
- Kantanen J, Olsaker I, Holm LE, Lien S, Vilkki J, Brusgaard K, Eythorsdottir E, Danell B, Adalsteinsson S. 2000. Genetic diversity and population structure of 20 North European cattle breeds. J Hered. 91:446–457. doi: 10.1093/jhered/91.6.446
- Kumar P, Freeman AR, Loftus RT, Gallard C, Fuller DQ, Bradley DG. 2003. Admixture analysis of South Asian cattle. Heredity. 91:43–50. doi: 10.1038/sj.hdy.6800277
- Li MH, Nogovitsina E, Kiselyova AT, Kantanen J, Ivanova Z, Erhardt G, Vilkki J, Popov R. 2005. Genetic contribution of indigenous Yakutian cattle to two hybrid populations, revealed by microsatellite variation. Asian Aust J Anim. 18:613–619. doi: 10.5713/ajas.2005.613
- Luikart G, Allendorf FW, Cournuet JM, Sherwin WB. 1998. Distortion of allele frequency distributions provides a test for recent population bottlenecks. J Hered. 89:238–247. doi: 10.1093/jhered/89.3.238
- Luikart G, Cornuet JM. 1997. Empirical evaluation of a test for identifying recently bottlenecked populations from allele frequency data. Conserv Biol. 12:228–237. doi: 10.1046/j.1523-1739.1998.96388.x
- Machugh DE, Loftus RT, Cunningham P, Bradley DG. 1998. Genetic structure of seven European cattle breeds assessed using 20 microsatellite markers. Anim Genet. 29:333–340. doi: 10.1046/j.1365-2052.1998.295330.x
- Martín-Burriel I, García-Muro E, Zaragoza P. 1999. Genetic diversity analysis of six Spanish native cattle breeds using microsatellites. Anim Genet. 30:177–182. doi: 10.1046/j.1365-2052.1999.00437.x
- Metta M, Kanginakudru S, Gudiseva N, Natarajan J. 2004. Genetic characterization of the Indian cattle breeds, Ongole and Deoni (Bos indicus), using microsatellite markers – a preliminary study. BMC Genet. 5:16. doi:10.1186/1471-2156-5-16.
- Moazami-Goudarzi K, Laloe D, Furet JP, Grosclaude F. 1997. Analysis of genetic relationships between 10 cattle breeds with 17 microsatellites. Anim Genet. 28:338–345. doi: 10.1111/j.1365-2052.1997.00176.x
- Mommens G, Peelman LJ, Van Zeveren A, D’Ieteren G, Wissocq N. 1999. Microsatellite variation between an African and five European Taurine breeds results in a geographical phylogenetic tree with a bison out group. J Ani Breed Genet. 116:325–330. doi: 10.1046/j.1439-0388.1999.00224.x
- Mukesh M, Sodhi M, Bhatia S, Mishra BP. 2004. Genetic diversity of Indian native cattle breeds as analysed with 20 microsatellite loci. J Ani Breed Genet. 121:416–424. doi: 10.1111/j.1439-0388.2004.00468.x
- Nei M. 1972. Genetic distance between populations. Am Nat. 106:283–292. doi: 10.1086/282771
- Nivsarkar AE, Gupta SC. 2000. Characterization and conservation of cattle genetic resources. J Ani Breed Genet. 22:129–139.
- Pandey AK, Rekha S, Singh Y, Prakash B, Ahlawat SPS. 2006. Genetic diversity studies of Kherigarh cattle based on microsatellite markers. J Genet. 85:117–122. doi: 10.1007/BF02729017
- Pandey AK, Rekha S, Yatender S, Prakash B, Ahlawat SPS. 2006. Evaluation of genetic variability in Kenkatha cattle by Microsatellite markers. Asian Aust J Anim. 19:1685–1690. doi: 10.5713/ajas.2006.1685
- Piry S, Luikart G, Cornuet JM. 1999. Bottleneck: a computer programme for detecting recent reductions in the effective population size using allele frequency data. J Hered. 90:502–503. doi: 10.1093/jhered/90.4.502
- Rehman MS, Khan MS. 2009. Genetic diversity of Hariana and Hissar cattle from Pakistan using microsatellite analysis. Pak Vet J. 29:67–71.
- Sambrook J, Russel DW. 2001. Molecular cloning: a laboratory manual. 3rd ed. Vol 1. New York: Cold Spring Harbor Laboratory Press.
- Schmid M, Saitbekova N, Gaillard C, Dolf G. 1999. Genetic diversity in Swiss cattle breeds. J Ani Breed Genet. 116:1–8. doi: 10.1111/j.1439-0388.1999.00165.x
- Sharma R, Maitra A, Singh PK, Tantia MS. 2013. Genetic diversity and relationship of cattle populations of East India: distinguishing lesser known cattle populations and established breeds based on STR markers. Springerplus. 2:359. doi: 10.1186/2193-1801-2-359
- Singh PK, Asija K, Pundir RK, Tajane KR, Mukesh M, Sodhi M, Prakash B, Gurmej S, Ahlawat SPS. 2006. Cattle genetic resource of India – GIR Monograph # 39 (2006). Karnal: National Bureau of Animal Genetic Resources.
- Singh PK, Pundir RK, Asija K, Mukesh M, Sodhi M, Prakash B, Ahlawat SPS. 2007. Cattle genetic resource of India – MEWATI Monograph # 56 (2007). Karnal: National Bureau of Animal Genetic Resources.
- Sodhi M, Mukesh M, Mishra BP, Ahlawat SPS, Prakash B, Sobti RC. 2011. Microsatellite analysis of genetic population structure of Zebu cattle (Bos indicus) breeds from North-Western region of India. Anim Biotechnol. 22:16–29. doi:10.1080/10495398.2011.536091.
- Sodhi M, Mukesh M, Mishra BP, Mitkari KR, Prakash B, Ahlawat SPS. 2005. Evaluation of genetic differentiation in Bos indicus cattle breeds from Marathwada region of India using microsatellite polymorphism. Anim Biotechnol. 16:127–137. doi: 10.1080/10495390500263310
- Sodhi M, Mukesh M, Prakash B, Ahlawat SPS, Sobti RC. 2006. Microsatellite DNA typing for assessment of genetic variability in Tharparkar breed of Indian zebu (Bos indicus) cattle, a major breed of Rajasthan. J Genet. 85:165–170. doi: 10.1007/BF02935326
- Vohra V, Niranjan SK, Joshi BK. 2012. Belahi cattle: uniform but distinct germplasm of Haryana. J Anim Res. 2:47–51.
- Vohra V, Niranjan SK, Mishra AK, Joshi BK. 2014. Belahi cattle pastoralism in the Himalayan foot hills. Proceed Aust Soc Anim Prod. 2014:317.
- Vohra V, Niranjan SK, Singh PK, Sadana DK, Joshi BK. 2011. Pastoral management of Kankrej cattle during migration between Western dry land and Trans Gangetic plain of India. Indian J Dairy Sci. 64:501–507.
- Weir BS, Cockerham CC. 1984. Estimating F-statistics for the analysis of population structure. Evolution. 38:1358–1370. doi: 10.2307/2408641
- Wright S. 1951. The genetic structure of populations. Ann Eugenics. 15:323–354. doi: 10.1111/j.1469-1809.1949.tb02451.x
- Wright S. 1978. Evolution and the genetics of natural population. Variability within and among natural population, vol. 4. Chicago: University of Chicago Press.
- Yeh FC, Yang R-C, Boyle TBJ, Ye A-H, Mao JX. 1999. POPGENE version 1.32, the user friendly software for population genetic analysis. Molecular Biology and Biotechnology Centre, University of Alberta, Canada. Available from: http://www.ualberta.Ca/-fyeh/fyeh.
- Yoon D-H, Kong H, Oh J, Lee J, Cho B, Kim J, Jeon K, Jo C, Jeon G, Lee H. 2005. Establishment of an individual identification system based on microsatellite polymorphisms in Korean cattle (Hanwoo). Asian Aust J Anim. 18:762–766. doi: 10.5713/ajas.2005.762