
ABSTRACT
The treatment and residual effects of linseed oil (LSO) and safflower oil (SFO) supplementation on milk and blood metabolites of cows was investigated. Twenty-six cows were grouped according to parity and days in milk and assigned equally to one of two treatments: a control diet + 5%SFO or 5%LSO for 28 days (treatment period, TP). The TP was preceded by a control period of 28 days (all animals on control diet). After treatment, animals were returned to control diet for 28 days (posttreatment period, PTP). Blood and milk samples were collected weekly. Feed intake decreased with LSO and SFO (p <.05), while body weight (BW) increased steadily (p <.0001) throughout. Non-esterified fatty acid (NEFA) and triacylglyceride (TAG) increased (p <.0001) during treatments. Beta-hydroxybutyric acid increased (p <.0001) with SFO only. Milk urea nitrogen (MUN) and fat decreased (p <.0001) with both supplements. NEFA/MUN and milk fat content returned to control levels one week or three weeks after treatment, respectively. TAG did not return to initial concentrations by the end of PTP. The residual effects of feeding LSO or SFO on the physiology of cows were still active up to three weeks after cessation of treatments.
1. Introduction
Dietary unsaturated fatty acids (UFA) may modulate the metabolism of dairy cows and hence influence the levels of some blood metabolites like glucose, non-esterified fatty acid (NEFA), triacylglyceride (TAG), beta-hydroxybutyric acid (BHBA) and milk components like fat, protein, urea nitrogen and lactose. Non-esterified fatty acids are one of the most important metabolites in the blood of dairy cows, especially in the transition period (3 weeks before and 3 weeks after parturition) (Li et al. Citation2013). Elevated concentrations of NEFA and BHBA have been used as indicators of excessive negative energy balance associated with increasing risk of diseases during the transition period in dairy cows (LeBlanc et al. Citation2005; Chapinal et al. Citation2011).
The origin of milk urea nitrogen (MUN) is mainly from excess ammonia that is released from dietary protein degradation in the rumen or from deamination of excess dietary amino acids. MUN is routinely used in dairy herds as a non-invasive measurement to monitor the protein status of animals and the efficiency of nitrogen utilization (Broderick and Clayton Citation1997; Jonker et al. Citation1998). Milk lactose determines milk osmolality and its synthesis determines the rate of water secretion in milk (Miglior et al. Citation2006). It should be noted that the water content of milk largely determines milk fat and protein concentrations (Henao-Velásquez et al. Citation2014).
Materials rich in UFA have been shown to influence blood glucose and NEFA levels in dairy cows (Salehi et al. Citation2015). Supplementing the diets of periparturient cows with conjugated linoleic acids (CLAs) (600 g/d of rumen inserted-CLA) decreased blood NEFA concentration while glucose was increased during the first week of lactation (Odens et al. Citation2007). Increased NEFA levels in blood plasma of cows fed diets supplemented with flaxseed (linseed) and fish oil have been reported (Drackley Citation1999; Gonthier et al. Citation2005; Petit et al. Citation2002).
Oil and seeds from plant products like linseed, soybean, safflower, sunflower and fish oil with high concentrations of UFA have been used to enhance the milk content of beneficial fatty acids (FA) such as CLA, n-3 and n-6 FA (Shingfield and Griinari Citation2007; Shingfield et al. Citation2010). Linseed oil (LSO) is rich in alpha-linolenic acid (ALA, an n-3 FA), about 52–63% of total fat (Suksombat et al. Citation2013) thus making it an attractive fat supplement in ruminant diets. Safflower oil (SFO) from the seeds of Carthamus tinctorius L (Yenice variety) is colourless and flavourless and rich in linoleic acid (about 76% of total fat, a polyunsaturated FA) (He and Armentano Citation2011).
Although numerous investigations have considered the effects of dietary supplementation with UFA including LSO and SFO on milk and blood components, it is not clear what residual effects these nutrients have on the physiology of the animal including blood metabolites and milk components or for how long effects are active after withdrawal of treatment. In this study, we examined the treatment and post-treatment effects of dietary supplementation of cows’ diets with 5% LSO or 5% SFO on milk composition and blood metabolites of lactating Holstein cows.
2. Materials and methods
2.1. Experimental animals and diets
Twenty-six Canadian Holstein cows (BW = 667.9 ± 197 kg; milk yield = 35 ± 10 kg/day) in mid-lactation (150 ± 50 DIM) were used. They were grouped according to parity and number of days in milk (DIM) and randomly assigned to one of two dietary treatments: The first group (13 cows) received a control diet (consisted of a total mixed ration [TMR] of corn and grass silages [50:50] and concentrates) supplemented with 5% SFO (SFO treatment), on dry matter (DM) basis, while the second group (13 cows) received the control diet supplemented with 5% LSO (LSO treatment, on DM basis) () for 28 days (treatment period, TP). This period of supplemental feeding was preceded by a stabilization period of 28 days during which time all cows were placed on the control diet (control period, CP). After the TP, the animals were returned to the control diet for another 28 days (post-treatment period, PTP). The animals were housed in individual tie stalls and fed individually. They had ad libitum access to feed and water at all times. Feed intake was monitored on a daily basis by weighing the TMR offered and the refusals. The animals were weighed at the beginning and end of each feeding period.
Table 1. Ingredients and chemical composition of the experimental diets.
Procedures for animal care and use were according to the national codes of practice for the care and handling of farm animals (Canadian Council on Animal Care, Citation2009) and approved by the animal care and ethics committee of Agriculture and Agri-Food Canada.
2.2. Blood collection and determination of blood metabolites
Blood samples were collected aseptically once a week from the caudal vein of each animal into ethylenediaminetetraacetic acid-coated vacutainer tubes. Samples were centrifuged at 7500g for 20 min at room temperature. Plasma was transferred into 2 mL tubes and stored at−20°C until analysed for the concentrations of BHBA, glucose, NEFA and TAG. Beta-hydroxybutyrate was determined by means of beta-hydroxybutyrate reagent set kit (BioPacific Diagnostic Inc. Vancouver, BC, Canada), glucose by glucose trinder assay kit (Genzyme Diagnostics, Charlottetown, PE, Canada), NEFA by Wako Chemicals (Kit HR series NEFA-HR, Richmond, VA, USA) and TAG by enzychrom TAG assay kit (Bioassay System, Hayward, CA, USA) following manufacturers’ instructions.
2.3. Milk collection and analysis
Cows were milked twice daily (8:00 am and 6:00 pm). Equal volume of the composite sample of am and pm milking (40 mL each) was pooled and sent to a commercial laboratory (Valacta Laboratories Inc., Ste-Anne-de-Bellevue, QC, Canada) for the analysis of fat, protein, somatic cell count (SCC), urea and lactose contents. Test-day milk fat, protein, urea and lactose contents were determined using MilkoScan FT 6000 Series mid-range infrared Fourier-transform infrared-based spectrometers (Foss, Hillerod, Denmark), while milk SCC was determined by means of Fossomatic flow cytometric cell counter (Fossomatic 5000, Foss electric, Hillerod, Denmark). Daily milk yield for each cow was recorded with electronic milk meters (MU-480, De Laval Inc. Kansas City, USA).
2.4. Determination of the fatty acid composition of experimental oil
Determination of FA profile was carried out according to O'Fallon et al. (Citation2007). The resulting FAME were analysed by method of GC using a Hewlett Packard 6890N gas chromatographic system (Agilent Technology, Wilmington, DE, USA) equipped with a flame ionization detector and an autosampler (Hewlett Packard, Avondale, PA, USA). The gas chromatographic capillary column used was SLB-IL111 (100 m × 0.25 mm, 0.2 µm in thickness, Supelco, Bellefonte, PA, USA). The gas carrier used was hydrogen at 1 mL/min constant flow with the linear velocity of 26 cm/s. The oven temperature was set at a start temperature of 40°C for 1 min, then rate 1 at 80–170°C for 1 min, followed by rate 2 at 40–195°C for 2 min and finally rate 3 at 20–210°C for 15 min. The injection port and detector temperatures were set at 250°C. The split ratio was set to 100:1 and the injection volume was 1 µl. Individual FAME peaks were identified by comparison of retention times with FAME standards (GLC No. 463 and No. UC-59-M, Nu-Chek Prep Inc., Elysian, MN, USA). C13:0 was the internal standard. Agilent Technologies Chemstation B.04.03 software was used for data analysis.
2.5. Statistical analyses
Statistical analyses were performed with SAS version 9.3 software (SAS Institute Inc. Cary, NC, USA). Effects of treatments on blood metabolites (glucose, TAG, BHBA and NEFA), milk components (fat, urea nitrogen, lactose, SCC and protein) and milk yield were analysed using a completely randomized design with repeated measures and mixed effects analysis of variance (ANOVA). There were more than two conditions to compare thus making the application of ANOVA F-test more powerful than a t-test (Cui and Churchill Citation2003). The statistical model included the fixed effects of treatment and day and random effect associated to cow,where Yijk, observation for animal j receiving treatment i at day k; μ, general mean; αi, fixed effect of treatment i (i = A,B); dij, random effect associated with animal j in treatment i = error term for treatment effect; τk, fixed effect of day k; ατik, interaction between treatment i and day k; eijk, random error.
3. Results
3.1. Feed intake and body weight
The feed consumption was similar for both treatments ((A) and ). Daily feed intake decreased slightly during the TP (p < .001) with both SFO and LSO, and PTP (p < .05) as compared to the CP ((A) and ). Feed intake was similar between the TP and PTP for both treatments ((A)).
Figure 1. Effect of treatments on feed intake (kg) (A) and body weight (kg) (B) of cows during the three experimental periods (control, treatment and post-treatment periods).
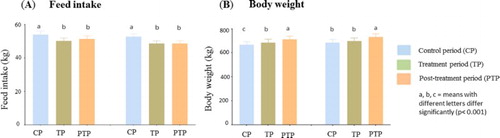
Table 2. Daily feed intake (mean ± standard error) of cows whose diets were supplemented with 5% safflower oil or 5% linseed oil on dry matter basis.
Body weight of cows increased progressively and significantly during the entire period of the experiment (p < .0001). For LSO treatment, BW of cows increased from 667.8 ± 25.8 to 686 ± 27.5 kg (p < .001) at the end of the TP and to 710.6 ± 27.9 kg (p < .001) at the end of the PTP. For SFO treatment, the increase in BW (CP = 685.4 ± 25.9 kg) at the end of the TP (696.8 ± 27.6 kg) was not significant (p = .079), while the increase at the end of the PTP (730.7 ± 27.1 kg) was significant (p < .001) ((B)). Comparison between treatments showed similar effects of LSO and SFO on feed intake and body weight gain.
3.2. Effect of treatments on blood metabolites
The concentrations of blood NEFA and TAG increased (p < .0001) during treatment with LSO and SFO as compared to the control period ((A,B)). Weekly trends show a rapid increase in NEFA and TAG concentrations for both treatments with onset of supplementation until maximum values were reached on day +28 (TP, last day of treatment) (165.05 ± 12.40 and 0.10 ± 0.01 mmol/L for LSO and 134.90 ± 11.91 and 0.10 ± 0.10 mmol/L for SFO) as compared to day −14 (89.90 ± 14.08 and 0.06 ± 0.01 mmol/L for LSO and 73.73 ± 7.28 and 0.05 ± 0.01 mmol/L for SFO), respectively (). With the withdrawal of treatments, there was a sharp drop in NEFA levels for both LSO and SFO until they reached control levels by day +35 (PTP) (). Unlike NEFA, the concentration of TAG did not return to control levels even after 28 days (day +56) of withdrawal of treatment ((B) and ).
Figure 2. Comparison of the effect of treatments on blood metabolites during the different experimental periods (control, treatment and post-treatment periods).
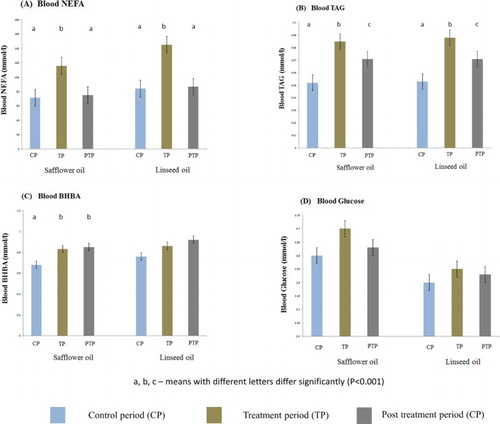
Table 3. Daya effects of treatments (5% safflower oil or 5% linseed oil) on blood metabolites.
Slight but significant increase (p < .0001) in BHBA concentration during SFO supplementation was observed but not with LSO supplementation ((C)). Furthermore, BHBA concentrations increased generally throughout the entire experimental periods and the highest values were recorded during the PTP ((C) and ). Overall, BHBA levels continued to increase up to about four weeks after withdrawal of treatments ((C) and ).
Treatment with LSO or SFO did not affect blood glucose concentrations ((D) and ) and there were also no significant differences in blood glucose levels during the different experimental periods (CP, TP and PTP) for both treatments ((D)). Comparison between treatments showed no differences between the effects of LSO and SFO on blood NEFA, TAG, BHBA and glucose.
3.3. Effect of treatments on milk production and component yields
Results of milk yield (kg) during the entire period of the experiment are shown in (A) and . There was a decrease in milk yield with increasing days in lactation for both treatments. Significant decrease (p < .05) was reached on day +28 (32.30 ± 2.94) and day +35 (31.70 ± 2.88) as compared to day −14 (36.50 ± 2.77) for LSO and on day +21 (30.29 ± 3.01), day +28 (26.91 ± 2.94), day +35 (26.05 ± 2.88), day +42 (27.70 ± 2.80) and day +56 (28.38 ± 2.81) as compared to day −14 (34.89 ± 2.77) for SFO ().
Figure 3. Comparison of the effect of treatments on milk components during the different experimental periods (control, treatment and post-treatment periods).
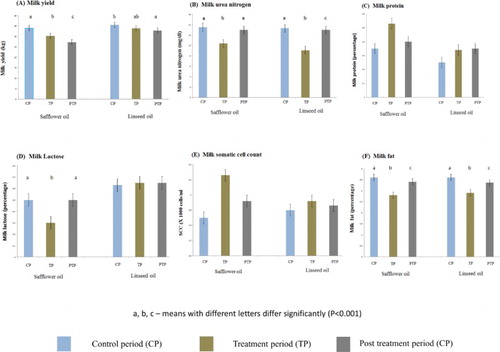
Table 4. Daya effects of treatments (5% safflower oil or 5% linseed oil) on milk component yields.
MUN levels decreased (p < .0001) during the TP as compared to CP and PTP for SFO and LSO ((B)). Weekly trends indicate that MUN levels decreased rapidly during the first week of treatment (p < .0001), then gradually until reaching minimum levels by day +28 (p < .0001) for both treatments (). When treatments were withdrawn, MUN levels increased rapidly, reaching control levels by day +35 for both treatments, exactly one week after cessation of treatments ().
Milk protein content increased slightly during dietary supplementation with 5% SFO but not with 5% LSO (). In fact, initial slight decrease for SFO or increase for LSO in milk protein content during the first week of treatment recovered and increased to levels above control values by day +28 for SFO (3.8% ± 0.1, p < .05) and LSO (3.4 ± 0.1, p = .07) and then decreased slightly for both treatments (but never reached control levels) after one week of cessation of treatments (). However, no effect of treatments on milk protein% was evident when the different experimental periods were compared ((C)).
Significant reduction (p < .0001) in milk lactose content was recorded during dietary supplementation with 5% SFO (4.30 ± 0.20%, day +28) as compared to the CP (4.60 ± 0.10%, day −14) and PTP (4.60 ± 0.10%, day +42) while no significant effect was recorded with LSO supplementation ((D) and ). Treatments had no effects on milk SCC in this study when the different experimental periods were compared ((E)). Although weekly trends showed significant differences in milk SCC, there was no specific trend ().
Safflower oil and LSO supplementation had similar effects on milk fat content ((F) and ). There was a gradual decline in milk fat content from the onset of supplementation, being noticeable by day +7 and reaching minimum (p < .001) levels by day +21 and day +28 for SFO and LSO, respectively, as compared to CP (day −14). When both supplements were withdrawn after 28 days of treatment, milk fat content increased gradually and reached values comparable to control levels as early as three weeks after cessation of treatments and control values at four weeks after cessation of treatments (). When the experimental periods were compared, dietary supplementation with LSO or SFO resulted in significant decreases (p < .0001) ((F)) in milk fat content during the TP as compared to the CP. Interestingly, milk fat % was significantly different (p < .05) between the CP and PTP, being higher during the CP ((F)). Comparison between treatments showed no differences between the effects of LSO and SFO on milk yield, MUN, protein and fat contents, lactose and SCC.
4. Discussion
The Goal of this study was to investigate the treatment and post-treatment effects of dietary supplementation of cows’ diets with 5% LSO or 5% SFO on milk and blood metabolites of mid-lactation dairy cows. To measure post-treatment effects with more confidence, control, treatment and post-treatment data were obtained on the same animals to reduce bias that could arise from control animals of different genetic background. Furthermore, experimental animals were in the same stage of lactation (mid-lactation) and samples were collected within a short period of time meaning that changes in measured parameters due to a change in lactation stage was not expected to influence results.
Feeding cows with 5% LSO or SFO resulted to slight but significant reductions in feed intake during the TP in this study but this did not translate to reductions in BW. In fact, BW of animals increased progressively with time suggesting that there was enough energy from oils for animals’ growth even during the period of supplemental feeding. Furthermore, reduction in feed intake especially during the first week of supplementation might be attributed to reduced palatability of the feed as a result of oil addition to the diets. Feed intake of animals, however, started to increase by the second week of supplementation but did not return to control levels even after four weeks of withdrawal of supplementation, suggesting that treatment with 5% LSO or 5% SFO might have prolonged negative effects on animal’s appetite. It has been suggested previously that addition of about 10.4% of whole flaxseed to the diet of cows might reduce DM intake (Petit et al. Citation2002). It should be noted that the effect of UFA supplementation on DM intake vary with the amount of fat added, source of forage and the forage: concentrate ratio of the diet (Benchaar et al. Citation2012). In this study, milk production of cows decreased generally throughout the experimental period. Mid-lactation cows were used and consistent with the lactation curve, milk production declined linearly with increasing days in lactation. Concentrations of MUN were reduced by supplemental feeding in this study suggesting that UFA rich ingredients could greatly influence milk MUN content. This is supported by the fact that MUN levels declined rapidly and returned to control levels exactly one week after withdrawal of treatments. Our data are supported by Chichlowski et al. (Citation2005) who reported significantly lower concentrations of MUN and reduced (not significant) blood urea nitrogen concentrations of cows fed ground canola seeds as compared to control. Our data, however, contrast observations by several authors who found no significant effects of diets rich in UFA on MUN levels in Italian (Marchesini et al. Citation2009) and Brown Swiss cows (Sigl et al. Citation2010). In one of the studies, a high fibre diet was used suggesting that the composition of the diet is an important factor (Marchesini et al. Citation2009). The concentration of urea in milk is monitored in many dairy herds as an indicator of the efficiency of protein utilization (Rafieei Citation2011), as well as nitrogen elimination to the environment. MUN value can be elevated when excess rumen degradable protein is fed to the cows or when rumen degradable protein is not balanced with the dietary non-fibre carbohydrates. When this happens, the unutilized portion of the dietary crude protein is converted to urea by the liver and is deposited into milk, blood and urine (Powell et al. Citation2014). In this study, it is probable that treatment with UFA enhanced dietary protein utilization and rumen microbial protein yield and consequently amino acid availability which increased milk protein concentrations (significantly higher for SFO by day +28). Also, reduced MUN levels during the treatment periods were still within normal levels suggesting that, the level of supplements used can be adopted as a management tool to enhance efficient dietary protein utilization while reducing nitrogen excretion to the environment. MUN is a by-product of dairy cattle protein metabolism. It is a normal component of milk and comprises about 20–75% of milk non-protein nitrogen (Islam et al. Citation2015). It is the major end product of nitrogen metabolism in dairy cows and synthesized primarily in the liver and transported in blood to the kidney where it is excreted in urine. While in blood, its concentration equilibrates rapidly with other body fluids including milk (Gustafsson and Palmquist Citation1993).
Milk protein content was increased slightly (for SFO by day +28) by dietary supplements in this study. Our result is supported by several authors who reported an increase (Fuentes et al. Citation2008; Petit et al. Citation2002) but contradicts reports that recorded a decrease (Ward et al. Citation2002) or who found no effect (Dhiman et al. Citation2000; Huang et al. Citation2008) of supplemental feeding of a variety of UFA ingredients to dairy cows on milk protein content. Milk SCC was not affected by treatments in this study. Animals were well cared for and farm management ensures excellent practices that reduced infection rates during the entire period of the experiment.
In this study, milk lactose content was reduced significantly with dietary supplementation with SFO but not with LSO. Our data on LSO are supported by several authors who observed no effect of feeding UFA on milk lactose concentration (Martin et al. Citation2008; Secchiari et al. Citation2003; Dai et al. Citation2011).
As expected, milk fat content decreased by 34.2% and 29.9% with 5% LSO and 5% SFO supplementation, respectively. This result is consistent with reports by other authors (Bell et al. Citation2006; Murphy et al. Citation2008; Angulo et al. Citation2012) who recorded reductions of up to 50% in milk fat content following supplementation of dairy cow diets with a variety of materials rich in UFA, generally referred to as milk fat depression. Dietary lipids are extensively altered by bacterial metabolism in the rumen with marked effects on bacterial populations and rumen microbial processes leading to diet-induced changes in the rumen environment (biohydrogenation) (Bauman and Griinari Citation2003). During this process, the rumen environment alters the pathways of biohydrogenation and increased rumen outflow of trans-isomer like trans-10, cis-12-CLA which is one intermediate shown unequivocally to inhibit milk fat synthesis (Bauman and Griinari Citation2003; Bauman et al. Citation2011). However, increases in ruminal trans-10,cis-12-CLA formation do not provide a universal justification for the decline in milk fat during diet-induced milk fat depression, signifying that other biohydrogenation intermediates may also be involved (Shingfield and Griinari Citation2007). The supplemental ingredients used in this study were rich in ALA (LSO) or LA (SFO) and caused reductions of about 34.2% and 29.9% in milk fat content, respectively, thus supporting the notion that other intermediates of biohydrogenation other than trans-10,cis-12-CLA were also involved. Furthermore, we analysed the FA content of a subset of the same animals (12) and observed significant increase in the contents of trans-10, cis-12-CLA by treatments (Ibeagha-Awemu et al. Citation2016) thus supporting its involvement in the process of depressing milk fat production in this study. Moreover, gene expression data showed a down-regulation of genes involved in mammary lipogenesis or milk fat synthesis (Ibeagha-Awemu et al. Citation2016) and supported by several studies in which cows were fed milk fat-depressing diets (Ahnadi et al. Citation2002; Harvatine and Bauman Citation2006; Angulo et al. Citation2012). Interestingly, the factors that were responsible for the inhibitory effect on milk fat synthesis in this study continued to have an effect up to three weeks after withdrawal of supplemental feeding, suggesting that the FA intermediates were not immediately cleared from the system after removal of the dietary supplements. This may account for the significant low milk fat content in the PTP as compared to the CP in this study.
Increased levels of TAG during dietary supplementation with 5% LSO or 5% SFO in this study may be a result of increased availability of ruminal biohydrogenation products of PUFA (Ibeagha-Awemu et al. Citation2016) which were absorbed or eventually transported and stored in the adipose tissues and liver as TAG. NEFAs are derived from TAG and vice versa which might explain why similar results were recorded for both parameters in this study. Our findings are in agreement with Vafa et al. (Citation2010) who reported a similar increase in TAG concentration in serum when cows in early lactation received increasing levels of dietary FA from canola seeds (1% canola oil + 1% fish oil or 2% canola oil) but contradicts Alizadeh et al. (Citation2010) who found no influence of dietary supplementation of different combinations of cotton and safflower seeds on blood TAG of Holstein cows in the early stage of lactation. It has been demonstrated that supplemental fat can increase the blood NEFA concentration of dairy cows during the transition period and early lactation (Rennó et al. Citation2014). Blood NEFA returned to control levels by day +35, exactly one week after the withdrawal of treatment thus suggesting that increased NEFA levels in the blood of treated animals were from increased availability of ruminal biohydrogenation products of PUFAs. However, TAG levels never returned to control levels even after 28 days of withdrawal of treatment suggesting that the conversion process of NEFA to TAG and its transportation as low-density lipoprotein from blood to the liver may be slower than its breakdown. Vast amount of NEFA is metabolized in the liver through three main steps or pathways; the first step involves complete oxidation leading to production of water, adenosine triphosphate and carbon dioxide, the second step involves incomplete oxidation leading to the production of ketones, while the third step results to esterification of triacylglyceride (Li et al. Citation2013). High blood NEFA content can be incompletely oxidized to ketones (BHBA) or esterified to triacylglyceride leading to ketosis (fatty liver syndrome) (Adewuyi et al. Citation2005) or secreted in milk by the udder (Drackley Citation1999).
Our results on BHBA ((C) and ) are in line with Mendoza et al. (Citation2008) who notated that dietary supplementation with whole sunflower seeds (rich in PUFA) tended to increase BHBA concentrations in grazing dairy cows. However, Alizadeh et al. (Citation2010) reported a linear decline in blood BHBA when cows at the early stage of lactation were fed diets supplemented with safflower seeds (1.4 kg per cow per day). Moussavi et al. (Citation2007) also observed no significant effect of supplemental feeding of 5% fish meal and n-3 FAs to early lactating dairy cows on BHBA.
Generally, treatments did not affect blood glucose concentrations in this study ((D) and ) which is consistent with reports by other authors (Rafalowski and Park Citation1982; Sigl et al. Citation2010).
5. Conclusion
Dietary supplementation of cows’ diets with 5% SFO or 5% LSO influenced blood metabolites and milk components during the treatment and post-treatment periods. Unlike NEFA, the concentration of TAG did not return to control levels even after 28 days (day+56) of withdrawal of treatment. Overall, BHBA levels continued to increase after withdrawal of treatments, reaching significant levels by day +49 (three weeks after cessation of treatment). Milk fat content decreased by 34.2% (LSO) or 29.9% (SFO) during treatments and its concentrations returned to control levels after three weeks of cessation of treatments. Milk protein content increased slightly during treatment (significant for SFO by day +28) and decreased to control levels one week after cessation of treatments. MUN was decreased by both treatments and levels increased rapidly following withdrawal of treatments reaching control levels by day +35, exactly one week after cessation of treatments. Our data shows that the residual effects of feeding UFA on the physiology of dairy cows were still active up to three weeks after cessation of treatments.
Disclosure statement
No potential conflict of interest was reported by the authors.
Additional information
Funding
References
- Adewuyi AA, Gruys E, van Eerdenburg FJ. 2005. Non esterified fatty acids (NEFA) in dairy cattle. A review. Vet Q. 27:117–126. doi: 10.1080/01652176.2005.9695192
- Ahnadi CE, Beswick N, Delbecchi L, Kennelly JJ, Lacasse P. 2002. Addition of fish oil to diets for dairy cows. II. Effects on milk fat and gene expression of mammary lipogenic enzymes. J Dairy Res. 69:521–531. doi: 10.1017/S0022029902005769
- Alizadeh A, Ghorbani G, Alikhani M, Rahmani H, Nikkhah A. 2010. Safflower seeds in corn silage and alfalfa hay based early lactation diets: A practice within an optimum forage choice. Anim Feed Sci Technol. 155:18–24. doi: 10.1016/j.anifeedsci.2009.09.014
- Angulo J, Mahecha L, Nuernberg K, Nuernberg G, Dannenberger D, Olivera M, Boutinaud M, Leroux C, Albrecht E, Bernard L. 2012. Effects of polyunsaturated fatty acids from plant oils and algae on milk fat yield and composition are associated with mammary lipogenic and SREBF1 gene expression. Animal. 6:1961–1972. doi: 10.1017/S1751731112000845
- Bauman DE, Griinari JM. 2003. Nutritional regulation of milk fat synthesis. Annu Rev Nutr. 23:203–227. doi: 10.1146/annurev.nutr.23.011702.073408
- Bauman DE, Harvatine KJ, Lock AL. 2011. Nutrigenomics, rumen-derived bioactive fatty acids, and the regulation of milk fat synthesis. Annu Rev Nutr. 31: 299–319. doi: 10.1146/annurev.nutr.012809.104648
- Bell JA, Griinari JM, Kennelly JJ. 2006. Effect of safflower oil, flaxseed oil, monensin, and vitamin E on concentration of conjugated linoleic acid in bovine milk fat. J Dairy Sci. 89:733–748. doi: 10.3168/jds.S0022-0302(06)72135-X
- Benchaar C, Romero-Perez GA, Chouinard PY, Hassanat F, Eugene M, Petit, HV, Cortes C. 2012. Supplementation of increasing amounts of linseed oil to dairy cows fed total mixed rations: effects on digestion, ruminal fermentation characteristics, protozoal populations, and milk fatty acid composition. J Dairy Sci. 95:4578–4590. doi: 10.3168/jds.2012-5455
- Broderick GA, Clayton MK. 1997. A statistical evaluation of animal and nutritional factors influencing concentrations of milk urea nitrogen. J Dairy Sci. 80:2964–2971. doi: 10.3168/jds.S0022-0302(97)76262-3
- Canadian Council on Animal Care. 2009. Guidelines on the care and use of farm animals in research, teaching and testing. http://www.ccac.ca/Documents/Standards/Guidelines/Farm_Animals.pdf
- Chapinal N, Carson M, Duffield TF, Capel M, Godden S, Overton M, Santos JEP, LeBlanc SJ. 2011. The association of serum metabolites with clinical disease during the transition period. J Dairy Sci. 94:4897–4903. doi: 10.3168/jds.2010-4075
- Chichlowski MW, Schroeder JW, Park CS, Keller WL, Schimek DE. 2005. Altering the fatty acids in milk fat by including canola seed in dairy cattle diets. J Dairy Sci. 88:3084–3094. doi: 10.3168/jds.S0022-0302(05)72990-8
- Cui X, Churchill GA. 2003. Statistical tests for differential expression in cDNA microarray experiments. Genome Biol. 4:210. doi: 10.1186/gb-2003-4-4-210
- Dai XJ, Wang C, Zhu Q. 2011. Milk performance of dairy cows supplemented with rapeseed oil, peanut oil and sunflower seed oil. Czech J Anim Sci. 6:181–191.
- Dhiman TR, Satter LD, Pariza MW, Galli MP, Albright K, Tolosa MX. 2000. Conjugated linoleic acid (CLA) content of milk from cows offered diets rich in linoleic and linolenic acid. J Dairy Sci. 83:1016–1027. doi: 10.3168/jds.S0022-0302(00)74966-6
- Drackley JK. 1999. ADSA foundation Scholar Award. Biology of dairy cows during the transition period: the final frontier? J Dairy Sci. 82:2259–2273. doi: 10.3168/jds.S0022-0302(99)75474-3
- Fuentes MC, Calsamiglia S, Sánchez C, González A, Newbold JR, Santos JEP, Rodríguez-Alcalá LM, Fontecha J. 2008. Effect of extruded linseed on productive and reproductive performance of lactating dairy cows. Livest Sci. 113:144–154. doi: 10.1016/j.livsci.2007.03.005
- Gonthier C, Mustafa AF, Ouellet DR, Chouinard PY, Berthiaume R, Petit HV. 2005. Feeding micronized and extruded flaxseed to dairy cows: effects on blood parameters and milk fatty acid composition. J Dairy Sci. 88:748–756. doi: 10.3168/jds.S0022-0302(05)72738-7
- Gustafsson AH, Palmquist DL. 1993. Diurnal variation of rumen ammonia, serum urea, and milk urea in dairy cows at high and low yields. J Dairy Sci. 76:475–484. doi: 10.3168/jds.S0022-0302(93)77368-3
- Harvatine KJ, Bauman DE. 2006. SREBP1 and thyroid hormone responsive spot 14 (S14) are involved in the regulation of bovine mammary lipid synthesis during diet-induced milk fat depression and treatment with CLA. J Nutr. 136:2468–2474.
- He M, Armentano LE. 2011. Effect of fatty acid profile in vegetable oils and antioxidant supplementation on dairy cattle performance and milk fat depression. J Dairy Sci. 94:2481–2491. doi: 10.3168/jds.2010-3755
- Henao-Velásquez AF, Múnera-Bedoya OD, Herrera AC, Agudelo-Trujillo JH, Cerón-Muñoz MF. 2014. Lactose and milk urea nitrogen: fluctuations during lactation in Holstein cows. Rev Bras Zootecn. 43:479–484. doi: 10.1590/S1516-35982014000900004
- Huang Y, Schoonmaker JP, Bradford BJ, Beitz DC. 2008. Response of milk fatty acid composition to dietary supplementation of soy oil, conjugated linoleic acid, or both. J Dairy Sci. 91:260–270. doi: 10.3168/jds.2007-0344
- Ibeagha-Awemu EM, Li R, Ammah AA, Dudemaine P-L, Bissonnette N, Benchaar C, Zhao X. 2016. Transcriptome adaptation of the bovine mammary gland to diets rich in unsaturated fatty acids shows greater impact of linseed oil over safflower oil on gene expression and metabolic pathways. BMC Genomics. 17:1–23. doi: 10.1186/s12864-016-2423-x
- Islam MR, Uddin MN, Akanda MR, Khan MMH, Baset MA, Belal SA. 2015. Effect of milk urea nitrogen of dairy cows in relation to breed. Iranian J Appl Anim Sci. 5:279–283.
- Jonker JS, Kohn RA, Erdman RA. 1998. Using milk urea nitrogen to predict nitrogen excretion and utilization efficiency in lactating dairy cows. J Dairy Sci. 81:2681–2692. doi: 10.3168/jds.S0022-0302(98)75825-4
- LeBlanc SJ, Leslie KE, Duffield TF. 2005. Metabolic predictors of displaced abomasum in dairy cattle. J Dairy Sci. 88:159–170. doi: 10.3168/jds.S0022-0302(05)72674-6
- Li P, Liu Y, Zhang Y, Long M, Guo Y, Wang Z, Li X, Zhang C, Li X, He J, Liu G. 2013. Effect of non-esterified fatty acids on fatty acid metabolism-related genes in calf hepatocytes cultured in vitro. Cell Physiol Biochem. 32:1509–1516. doi: 10.1159/000356588
- Marchesini G, Andrighetto I, Stefani AL, Berzaghi P, Tenti S, Segato S. 2009. Effect of unsaturated fatty acid supplementation on performance and milk fatty acid profile in dairy cows fed a high fibre diet. Ital J Anim Sci. 8:391–403. doi: 10.4081/ijas.2009.391
- Martin C, Rouel J, Jouany JP, Doreau M, Chilliard Y. 2008. Methane output and diet digestibility in response to feeding dairy cows crude linseed, extruded linseed, or linseed oil. J Anim Sci. 86:2642–2650. doi: 10.2527/jas.2007-0774
- Mendoza A, Alejandro M, Daniela C, Mark AC, Daniel C. 2008. Whole sunflower seeds as a source of polyunsaturated fatty acids for grazing dairy cows: effects on metabolic profiles and resumption of postpartum ovarian cyclicity. Livest Sci. 119:183–193. doi: 10.1016/j.livsci.2008.04.005
- Miglior F, Sewalem A, Jamrozik J, Lefebvre DM, Moore RK. 2006. Analysis of milk urea nitrogen and lactose and their effect on longevity in Canadian dairy cattle. J Dairy Sci. 89:4886–4894. doi: 10.3168/jds.S0022-0302(06)72537-1
- Moussavi AR, Gilbert RO, Overton TR, Bauman DE, Butler WR. 2007. Effects of feeding fish meal and n-3 fatty acids on milk yield and metabolic responses in early lactating dairy cows. J Dairy Sci. 90:136–144. doi: 10.3168/jds.S0022-0302(07)72615-2
- Murphy JJ, Coakley M, Stanton C. 2008. Supplementation of dairy cows with a fish oil containing supplement and sunflower oil to increase the CLA content of milk produced at pasture. Livest Sci. 116:332–337. doi: 10.1016/j.livsci.2008.02.003
- Odens LJ, Burgos R, Innocenti M, VanBaale MJ, Baumgard LH. 2007. Effects of varying doses of supplemental conjugated linoleic acid on production and energetic variables during the transition period1. J Dairy Sci. 90:293–305. doi: 10.3168/jds.S0022-0302(07)72630-9
- O'Fallon JV, Busboom JR, Nelson ML, Gaskins CT. 2007. A direct method for fatty acid methyl ester synthesis: application to wet meat tissues, oils, and feedstuffs. J Anim Sci. 85:1511–1521. doi: 10.2527/jas.2006-491
- Petit HV, Dewhurst RJ, Scollan ND, Proulx JG, Khalid M, Haresign W, Twagiramungu H, Mann GE. 2002. Milk production and composition, ovarian function, and prostaglandin secretion of dairy cows fed omega-3 fats. J Dairy Sci. 85:889–899. doi: 10.3168/jds.S0022-0302(02)74147-7
- Powell JM, Rotz CA, Wattiaux MA. 2014. Potential use of milk urea nitrogen to abate atmospheric nitrogen emissions from Wisconsin dairy farms. J Environ Qual. 43:1169–1175. doi: 10.2134/jeq2013.09.0375
- Rafalowski W, Park CS. 1982. Whole sunflower seed as a fat supplement for lactating cows. J Dairy Sci. 65:1484–1492. doi: 10.3168/jds.S0022-0302(82)82372-2
- Rafieei H. 2011. Responses of milk urea nitrogen content to dietary rume degradable protein level in lactating Holstein dairy cows. Iranian J Appl Anim Sci. 1:111–116.
- Rennó FP, Freitas Júnior JEd, Gandra JR, Maturana Filho M, Verdurico LC, Rennó LN, Barletta RV, Vilela FG. 2014. Effect of unsaturated fatty acid supplementation on digestion, metabolism and nutrient balance in dairy cows during the transition period and early lactation. Rev Bras Zootecn. 43:212–223. doi: 10.1590/S1516-35982014000400008
- Salehi R, Colazo M, Oba M, Ambrose D. 2015. A prepartum diet supplemented with oilseeds high in oleic or linoleic acid reduced GnRH-induced LH release in dairy cows during second week postpartum. Reprod Biol Endocrinol. 13:69. doi: 10.1186/s12958-015-0060-x
- Secchiari P, Antongiovanni M, Mele M, Serra A, Buccioni A, Ferruzzi G, Paoletti F, Petacchi F. 2003. Effect of kind of dietary fat on the quality of milk fat from Italian Friesian cows. Livest Sci. 83:43–52. doi: 10.1016/S0301-6226(03)00043-5
- Shingfield KJ, Bernard L, Leroux C, Chilliard Y. 2010. Role of trans fatty acids in the nutritional regulation of mammary lipogenesis in ruminants. Animal. 4:1140–1166. doi: 10.1017/S1751731110000510
- Shingfield KJ, Griinari JM. 2007. Role of biohydrogenation intermediates in milk fat depression. Eur J Lipid Sci Technol. 109:799–816.
- Sigl T, Schlamberger G, Kienberger H, Wiedemann S, Meyer HHD, Kaske M. 2010. Rumen-protected conjugated linoleic acid supplementation to dairy cows in pregnancy and early lactation: effects on milk composition, milk yield, blood metabolites and gene expression in liver. Acta Vet Scand. 52:16–16.
- Suksombat W, Meeprom C, Mirattanaphrai R. 2013. Milk production, milk composition, live weight change and milk fatty acid composition in lactating dairy cows in response to whole linseed supplementation. Asian-Australas J Anim Sci. 26:1111–1118. doi: 10.5713/ajas.2013.13027
- Vafa TS, Naserian AA, Moussavi ARH, Valizadeh R, Mesgaran MD, Khorashadizadeh MA. 2010. Effects of different levels of fish oil and canola oil on productive performance of Holstein dairy cows. Indian J Anim Res. 44:79–86.
- Ward AT, Wittenberg KM, Przybylski R. 2002. Bovine milk fatty acid profiles produced by feeding diets containing solin, flax and canola. J Dairy Sci. 85:1191–1196. doi: 10.3168/jds.S0022-0302(02)74182-9