
ABSTRACT
Refractometry has been proposed as a farm technique to estimate the IgG concentration in colostrum. In order to validate the method in goat colostrum using a clinical refractometer, 216 colostrum and milk samples were obtained from 54 dairy goats. Samples were evaluated for protein concentration using a clinical refractometer and IgG concentration was measured using a commercial ELISA. The r2 for the linear regression between refractometry value and IgG concentration measured by ELISA was 0.79, and the area under the receiver operating characteristics curve was 0.99. The proposed cut-off value using the clinical refractometer was 10 mg/mL. At this point, the sensitivity, specificity, negative predictive value, positive predictive value, Youden’s index and accuracy were 100%, 95.19%, 100%, 76.32%, 0.95% and 95.83%, respectively.
Introduction
Goat kids are hipogammaglobulinaemic at birth due to the special characteristic of the synepitheliochorial placenta that did not allow the IgG transport from the goat to the goat kid (Castro et al. Citation2011). This anatomical and physiological characteristic gives to colostrum an essential role in the neonate immunity. Colostrum feeding will provide enough IgG to the neonate goat kid until his immune system will be able to generate it by himself (Moretti et al. Citation2013). Also, colostrum has been used as a supplement in other species (Akdemir et al. Citation2018). An adequate colostrum feed is related with positive repercussions on growth, health and a reduction in mortality rate (Arguello et al. Citation2004; Furman-Fratczak et al. Citation2011; Nagyova et al. Citation2017). The range of colostrum IgG concentration is wide, it was from 7 to 159 mg/mL (Quigley et al. Citation2013) in the healthy udder of cows, but when inflammation is present, IgG concentration may be affected (Watanabe et al. Citation2017). In addition, the source of immunoglobulins has an effect on the IgG concentration in blood (Rana et al. Citation2016). It is important to note the differences in colostrum composition observed between dairy species (Hernandez-Castellano et al. Citation2016). Due to all of these factors, the colostrum IgG concentration must be checked before to feed the animals in order to reduce the presence of Failure of Passive Transfer cases and assure a good health and growth in the ruminant neonates in the modern dairy farms. The golden reference method for determining the IgG concentration in colostrum is the Radial Immune Diffusion (RID) according to the techniques described by Mancini et al. (Citation1965), also ELISA has been used for the same objectives in cow (Gelsinger et al. Citation2015) and in goat colostrum (Rodriguez et al. Citation2009). But RID and ELISA are time-consuming, expensive and laboratory- dependent techniques so that these techniques are not suitable to use on a day-to-day basis in dairy farms. The technique to measure colostrum IgG in the farm must be cheap, user-friendly and with a good correlation with golden techniques. Nowadays some other techniques are also used in farms. Densitometer or colostrometer is used daily in cow dairy farms (Lokke et al. Citation2016), but colostrometer needs a specific temperature to run it adequately (Bartier et al. Citation2015), and its use is not extended in dairy goat farm. For the past 10 years, refractometry has been used for determining the IgG concentration in the colostrum in farms (Chigerwe et al., Citation2008; Quigley et al. Citation2013) observing a significant correlation between Brix index and colostrum IgG concentration in dairy cows. Although more types have been observed in Brix refractometers (Phipps et al., Citation2016), clinical ones have been successfully used in cow colostrum (Vandeputte et al., Citation2011). As the literature is limited in reference to the use of clinical refractometer for measuring colostrum IgG in dairy goats, the present study was conducted.
Materials and methods
The experiment was not under the directive 2010/63/UE due to the practices not caused pain, suffering, distress or lasting equivalent to, or higher than, that caused by the introduction of a needle in accordance with good veterinary practice.
Animals
This study was performed at the Faculty of Veterinary Medicine (Universidad de Las Palmas de Gran Canaria, Spain). Two hundred and sixteen colostrum and milk samples were obtained from 2010 to 2017 from 54 dairy goats of Majorera Breed from partum to 40 days of lactation. Samples were obtained according to the previous experiments (Capote et al., Citation2006). Briefly, animals were milked in a milking parlour at 42 KPa of vacuum pressure, 50:50 ratio and 100 pulse per minute. Four samples were obtained from each goat on different dates. One sample was obtained in each of the four periods of 10 days between partum and 40 days of lactation. Samples were aliquoted in 5 mL tubes and frozen at –80° centigrade.
Refractometry and ELISA
Colostrum samples were defrosted in a water bath at 20°C before analysis. . Approximately 50 μL of colostrum was placed on the prism and the sample cover was lowered. A clinical refractometer (Atago, USA) with a scale for serum protein ranging from 0 to 12 mg/mL was used after calibration with distilled water. The refractometer was then held up to a light source, and the serum total protein value was read at the line between the light and dark areas that appeared on the scale. The refractometer prism was washed with distilled water between samples. Samples with readings higher than scale were diluted 1:1 with distilled water and measured again, the second reading result was multiply by two. Quantification of IgG in colostrum samples was performed using goat IgG ELISA kits (Bethyl Laboratories, Montgomery, TX) following the procedure described by Capote et al. (Citation2006), Rodriguez et al. (Citation2009) and Dunn et al. (Citation2017).
Statistical analysis
The SAS (Version 9.4., SAS Institute Inc., Cary, NC, USA) program package was used for statistical analysis. The relationship between refractometer and ELISA IgG concentrations was studied using the PROC REG. Break points using a clinical refractometer, assuming IgG concentration higher than 20 mg/mL measured by ELISA as a good colostrum, were evaluated by sensitivity, specificity, positive predictive value, negative predictive value and accuracy. Youden index was calculated as sensitivity plus specificity minus one according to Ruopp et al., Citation2007. The receiver operating characteristics (ROC) curve and the area under the curve (AUC) were calculated as a measure of the quality of the cut-off points according to Bartens et al., Citation2016.
Results and discussion
Two hundred and sixteen colostrum and milk samples were analysed. The IgG concentration mean value, according to the ELISA results, was 7.93 12.37 with a maximum of 54.03 and a minimum of 0.12 mg/mL. Refractometer mean value, for protein concentration, was 6.78 3.16 with a maximum of 18 and a minimum of 3.6 mg/mL. Based on ELISA IgG concentration, 29 samples were of good quality (IgG ≥ 20 mg/mL) and 187 samples were of poor quality (IgG < 20 mg/mL). The aim of the present study was to evaluate the clinical refractometer as an easy and cheap tool to predict the colostrum quality. The variability in the IgG concentration in the colostrum is huge, as it has been reported previously by (Baumrucker et al., Citation2014), to obtain a wide range of IgG concentrations is crucial to evaluate any predictive method. The present study displays a narrower range than that previously reported by (Bartens et al., Citation2016) in cow, but similar to other studies in dairy goats (Sanchez-Macias et al., Citation2014).
Samples were frozen after obtained, but previous studies have demonstrated that one freeze–thaw cycle has little effect in IgG goat colostrum concentration (Arguello et al., Citation2003) or refractometer reading (Morrill et al., Citation2015).
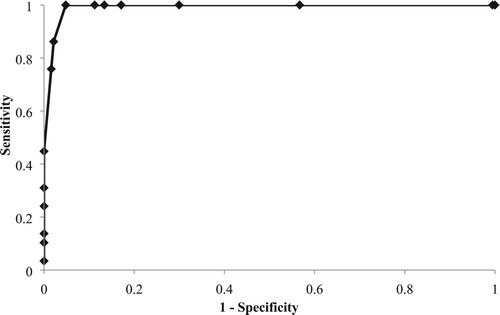
The relationship between IgG concentration measured by ELISA and clinical refractometer was established using a linear regression shown in . No data are available for goat colostrum/milk, but the r2 in the present study (0.79) is higher than that in the recently published studies in cows (Bielmann et al., Citation2010, Quigley et al., Citation2013, Bartier et al., Citation2015), although r2 values of cows were obtained using a brix refractometer. Arguello et al. (Citation2005) reported a similar r2 using the colostrum colour as a predictor of IgG concentration in the goat colostrum. In addition to the results of r2, displays an AUC value of 0.99. Referred AUC values for hydrometer and optical and digital brix refractometers ranged from 0.71 to 0.81 in colostrum from dairy cows (Bartens et al., Citation2016). Higher AUC values in the ROC curves mean a better quality of the cutpoints.
Figure 1. Regression of Colostral IgG concentration by ELISA and clinical refractometer.
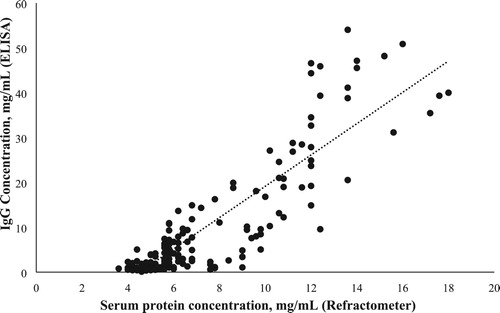
Figure 2. Receiver operating characteristic curve for clinical refractometer.
shows the cut-off value, sensitivity, specificity, negative predictive value, positive predictive value, Youden index and accuracy for the clinical refractometer as a tool to estimate the IgG concentration in colostrum and milk using the ELISA as a gold technique. The highest accuracy (95.83%) was observed at 10 mg/mL as a cut-off value, in coincidence with the highest sensitivity (100%), negative predictive value (100%) and Youden index (0.95). These values are similar to those reported previously in colostrum from dairy cows using a brix refractometer (Quigley et al., Citation2013; Bielmann et al., Citation2010). The value of AUC observed in the present study (10 mg/mL) can be used as a cut-off value point in goat colostrum using a clinical refractometer as a predictor device. The use of a brix refractometer is an easy, cheap and accurate method to estimate the goat colostrum quality in farm.
Table 1. Diagnostic test characteristics to use clinical refractometer to estimate that goat colostrum IgG concentration is higher than 20 mg/mL.
Acknowledgments
The authors acknowledge the support of Dr Candelaria Juste de Santa Ana (Universidad de Las Palmas de Gran Canaria).
Disclosure statement
No potential conflict of interest was reported by the authors.
ORCID
Noemí Castro http://orcid.org/0000-0002-3026-2031
Anastasio Arguello http://orcid.org/0000-0002-4426-0678
References
- Akdemir F, Bayril T, Baran MS, Yildiz AS, Kahraman M, Orhan C, Sahin K. 2018. The effect of dietary colostrum powder on performance, carcass yields and serum lipid peroxidation levels in Japanese quails (Coturnix coturnix japonica). J Appl Anim Res. 46(1):39–43. doi: 10.1080/09712119.2016.1257431
- Arguello A, Castro N, Capote J. 2005. Short communication: evaluation of a color method for testing immunoglobulin G concentration in goat colostrum. J Dairy Sci. 88(5):1752–1754. doi: 10.3168/jds.S0022-0302(05)72849-6
- Arguello A, Castro N, Capote J, Gines R, Acosta F, Lopez JL. 2003. Effects of refrigeration, freezing-thawing and pasteurization on IgG goat colostrum preservation. Small Ruminant Res. 48(2):135–139. doi: 10.1016/S0921-4488(02)00277-8
- Arguello A, Castro N, Capote J, Tyler JW, Holloway NM. 2004. Effect of colostrum administration practices on serum IgG in goat kids. Livest Prod Sci. 90(2-3):235–239. doi: 10.1016/j.livprodsci.2004.06.006
- Bartens MC, Drillich M, Rychli K, Iwersen M, Arnholdt T, Meyer L, Klein-Jobstl D. 2016. Assessment of different methods to estimate bovine colostrum quality on farm. New Zeal Vet J. 64(5):263–267. doi: 10.1080/00480169.2016.1184109
- Bartier AL, Windeyer MC, Doepel L. 2015. Evaluation of on-farm tools for colostrum quality measurement. J Dairy Sci. 98(3):1878–1884. doi: 10.3168/jds.2014-8415
- Baumrucker CR, Stark A, Wellnitz O, Dechow C, Bruckmaier RM. 2014. Short communication: immunoglobulin variation in quarter-milked colostrum. J Dairy Sci. 97(6):3700–3706. doi: 10.3168/jds.2013-7107
- Bielmann V, Gillan J, Perkins NR, Skidmore AL, Godden S, Leslie KE. 2010. An evaluation of brix refractometry instruments for measurement of colostrum quality in dairy cattle. J Dairy Sci. 93(8):3713–3721. doi: 10.3168/jds.2009-2943
- Capote J, Arguello A, Castro N, Lopez JL, Caja G. 2006. Short communication: correlations between udder morphology, milk yield, and milking ability with different milking frequencies in dairy goats. J Dairy Sci. 89(6):2076–2079. doi: 10.3168/jds.S0022-0302(06)72276-7
- Castro N, Capote J, Bruckmaier RM, Arguello A. 2011. Management effects on colostrogenesis in small ruminants: a review. J Appl Anim Res. 39(2):85–93. doi: 10.1080/09712119.2011.581625
- Chigerwe M, Tyler JW, Middleton JR, Spain JN, Dill JS, Steevens BJ. 2008. Comparison of four methods to assess colostral IgG concentration in dairy cows. Javma-J Am Vet Med A. 233(5):761–766. doi: 10.2460/javma.233.5.761
- Dunn A, Duffy C, Gordon A, Morrison S, Arguello A, Welsh M, Earley B. 2017. Comparison of single radial immunodiffusion and ELISA for the quantification of immunoglobulin G in bovine colostrum, milk and calf sera. J Appl Anim Res. 46(1):758–765. doi: 10.1080/09712119.2017.1394860
- Furman-Fratczak K, Rzasa A, Stefaniak T. 2011. The influence of colostral immunoglobulin concentration in heifer calves’ serum on their health and growth. J Dairy Sci. 94(11):5536–5543. doi: 10.3168/jds.2010-3253
- Gelsinger SL, Smith AM, Jones CM, Heinrichs AJ. 2015. Technical note: comparison of radial immunodiffusion and ELISA for quantification of bovine immunoglobulin G in colostrum and plasma. J Dairy Sci. 98(6):4084–4089. doi: 10.3168/jds.2014-8491
- Hernandez-Castellano LE, Almeida AM, Renaut J, Arguello A, Castro N. 2016. A proteomics study of colostrum and milk from the two major small ruminant dairy breeds from the canary islands: a bovine milk comparison perspective. J Dairy Res. 83(3):366–374. doi: 10.1017/S0022029916000273
- Lokke MM, Engelbrecht R, Wiking L. 2016. Covariance structures of fat and protein influence the estimation of IgG in bovine colostrum. J Dairy Res. 83(1):58–66. doi: 10.1017/S0022029915000734
- Mancini G, Carbonara AO, Heremans JF. 1965. Immunochemical quantitation of antigens by single radial immunodiffusion. Immunochemistry. 2(3):235–254. doi: 10.1016/0019-2791(65)90004-2
- Moretti DB, Nordi WM, Lima AL, Pauletti P, Machado-Neto R. 2013. Enterocyte IgG uptake in the small intestine of goat kids during the period of passive immunity acquisition. Small Ruminant Res. 114(1):182–187. doi: 10.1016/j.smallrumres.2013.05.012
- Morrill KM, Robertson KE, Spring MM, Robinson AL, Tyler HD. 2015. Validating a refractometer to evaluate immunoglobulin G concentration in jersey colostrum and the effect of multiple freeze-thaw cycles on evaluating colostrum quality. J Dairy Sci. 98(1):595–601. doi: 10.3168/jds.2014-8730
- Nagyova V, Tothova C, Nagy O. 2017. The impact of colostrum intake on the serum protein electrophoretic pattern in newborn ruminants. J Appl Anim Res. 45(1):498–504. doi: 10.1080/09712119.2016.1218886
- Phipps AJ, Beggs DS, Murray AJ, Mansell PD, Stevenson MA, Pyman MF. 2016. Survey of bovine colostrum quality and hygiene on northern victorian dairy farms. J Dairy Sci. 99(11):8981–8990. doi: 10.3168/jds.2016-11200
- Quigley JD, Lago A, Chapman C, Erickson P, Polo J. 2013. Evaluation of the brix refractometer to estimate immunoglobulin G concentration in bovine colostrum. J Dairy Sci. 96(2):1148–1155. doi: 10.3168/jds.2012-5823
- Rana P, Prajapati C, Saini A, Sharma M. 2016. Effect of different immunoglobulin sources on haematology and serum biochemistry of beetal kids under stall-fed conditions. J Appl Anim Res. 44(1):248–251. doi: 10.1080/09712119.2015.1031777
- Rodriguez C, Castro N, Capote J, Morales-delaNuez A, Moreno-Indias I, Sanchez-Macias D, Arguello A. 2009. Effect of colostrum immunoglobulin concentration on immunity in Majorera goat kids. J Dairy Sci. 92(4):1696–1701. doi: 10.3168/jds.2008-1586
- Ruopp MD, Perkins NJ, Whitcomb BW, Schisterman EF. 2007. Youden index and optimal cut-point estimated from observations subject to a lower limit of detection. Am J Epidemiol. 165(11):S67–S67.
- Sanchez-Macias D, Moreno-Indias I, Castro N, Morales-delaNuez A, Arguello A. 2014. From goat colostrum to milk: physical, chemical, and immune evolution from partum to 90 days postpartum. J Dairy Sci. 97(1):10–16. doi: 10.3168/jds.2013-6811
- Vandeputte S, Detilleux J, Rollin F. 2011. Comparison of four refractometers for the investigation of the passive transfer in beef calves. J Vet Intern Med. 25(6):1465–1469. doi: 10.1111/j.1939-1676.2011.00816.x
- Watanabe A, Hata E, Slama P, Kimura K, Hirai T. 2017. Characteristics of mammary secretions from Holstein cows at approximately 10 days before parturition: with or without intramammary infection. J Appl Anim Res. 46(1):604–608. doi: 10.1080/09712119.2017.1368524