
 ?Mathematical formulae have been encoded as MathML and are displayed in this HTML version using MathJax in order to improve their display. Uncheck the box to turn MathJax off. This feature requires Javascript. Click on a formula to zoom.
ABSTRACT
Limited data are available on the relationship between seasonal diets and macronutrient and energy intake of domestic Asian elephants. The effects of age, sex and season on the nutrient composition and intake of food were investigated using 16 domesticated Asian elephants of different ages and sexes. There were no significant seasonal differences in the protein content of the major food plants. However, a seasonal variation in the intake of protein was evident. We used geometric modelling of non-protein (NP) neutral detergent fibre (NDF) and protein to examine seasonal nutrient variability within different ages, sexes and physiological states. The model suggested that most individual elephants maintained their recommended metabolizable energy intake from their diet across all seasons. However, we had anticipated less energy intake from poor diet due to less protein and higher NDF in the feeding ground during winter, pre-monsoon and monsoon seasons. Despite eating a lower variety of plants with less protein and higher NDF, elephants maintained a consistent pattern of diet intake in these seasons, suggesting that they acquired the recommended energy intake by regulating their diet, most likely through over-ingesting low-quality, non-complementary food as they did not have the opportunity to select from a variety of plants.
GRAPHICAL ABSTRACT
Introduction
Domesticated elephants in Nepal play an important role in the conservation and management of national parks and their surrounding forests (DNPWC Citation2011). Government-owned elephants are mainly used for patrolling and for research purposes within the park, whereas privately-owned elephants are for the most part used for recreational riding by tourists in the buffer zones of parks and reserves (Kharel Citation2005). Due to the increasing demand for elephants for patrolling and park management duties, and the difficulty in legally procuring elephants from India, an elephant breeding centre was established in Chitwan National Park in 1986 (Pradhan et al. Citation2011). These semi-wild domesticated elephants are provisioned with food in the camp and are also allowed to forage in the national park and the buffer zone forests during daily excursions guided by mahout (elephant keeper).
Despite intensive conservation efforts, there is a lack of available information on the food preferences and macronutrient composition of the diets of the elephants that have access to these two food sources. Of particular importance is how the selected diets compare to the recommended nutrient intakes for elephants. Appropriate nutrition is critical for normal growth and the maintenance of good health by elephants (Stevenson & Walter Citation2006), and nutrient requirements may vary according to age, sex, season and workload (especially for domestic elephants). A better understanding of elephant diet in Nepal is especially important considering the poor health of a sizable number of domestic elephants in that country, and their role in the harbouring and spread of tuberculosis (DNPWC Citation2011). Furthermore, the dietary or nutrient requirements of free-ranging elephants have not been definitively established (Ullrey et al. Citation1997). This is a complex challenge because it requires an understanding of food supply, nutritional characteristics of foods, food digestibility, and the animal’s nutritional requirements (Rothman et al. Citation2011).
The aims of this study are to examine the diet and macronutrient compositions of the foods consumed by domestic elephants in Nepal and whether age, sex, season or disease status (tuberculosis) affect these patterns of nutrient composition using a proportion-based nutritional geometry framework, the right-angled mixture triangle (RMT). Information from this study will aid in the dietary management and thus the husbandry and conservation of these animals in terms of the management and restoration of their provisioned food and their natural habitat respectively.
Materials and methods
Study area
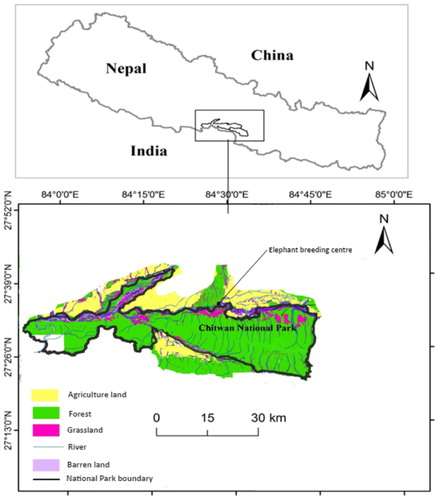
The Chitwan National Park (Figure ) is located in the lowland Terai region of Nepal. The core area of the park covers 932 km2 and is surrounded by a buffer zone of 750 km2 (55% agricultural land and 45% community forest) (Straede & Helles Citation2000). The park is ecologically diverse, spanning early stages of succession on alluvial flood plains along the Narayani, Rapti and Rew watersheds to climax forest in the foothills and on the slopes of the Churia Range (Chanchani et al. Citation2014). The forests are composed predominantly of deciduous and semi-deciduous species. Sal (Shorea robusta) dominates in the Chitwan National Park, whereas the low-lying areas alongside the rivers are covered by a variety of riverine forests dominated by simal (Bombax malabaricum), vellar (Trewia nudiflora) and tall grasslands (DNPWC & PPP Citation2000; Bhattarai & Kindlmann Citation2012).
Figure 1. Map of study area (Chitwan National Park) in Nepal.
Daily activity and feeding regime of domesticated elephants in the elephant breeding centre
Domestic elephants are taken by their keepers (mahouts) to forage in nearby forests daily at around 5:30 am and returned to the camp around 9:30 am. The mahouts also collect fodder and woody browse en-route, which they feed the elephants during the morning and to a lesser extent in the evening. At around 10 am, elephants are ridden by mahouts into the National Park where they are allowed to forage freely and returned to the camp at approximately 4 pm. From around 4:30–5:00 pm the elephants are provided with food pellets, locally called kucchi (Locke Citation2011), which consist of a mixture of grain, molasses and salt, wrapped with grasses such as siru (Imperata cylindrica). At this time, they are also provisioned with fodder like, grasses and woody browse and individually tethered with 1−2 m chain to separate wooden posts under cover of a tin roof until the following morning (Varma & Ganguly Citation2011).
Data collection
We surveyed a total of 16 domesticated elephants of known tuberculosis status (positive or negative) across four different seasons (dry, winter, pre-monsoon and monsoon). The information on the disease status of the elephants was collected from the national park office. Our study included young and adult males, and adult females (pregnant, lactating and non-lactating). The elephants were classified into three age-based categories: 8–16; 22–32; and 43–69 years old. Elephants were observed in all four seasons: Eight elephants were surveyed during dry season, seven in winter, nine in pre-monsoon, and eight in monsoon season. Each elephant was observed consecutively for three to four full days in grassland and sal (S. robusta) mixed-forest from morning through evening. We completed a total of 116 observation-days, spanning all four seasons between 2012 and 2013. Details of the observed elephants are provided in Table .
Table 1 . Name, age, sex, season surveyed and disease status of 16 domestic Asian elephants in the elephant breeding centre in Chitwan, Nepal.
The duration of daily feeding and feeding breaks were recorded. Two types of feeding breaks were defined: (1) long breaks, which were more than 15 min without any ingestion of food; and (2) short breaks of 5–15 min between feeds. Data on the plant species consumed by the elephants and the number of mouthfuls of each species were obtained by continuously following the animals while they were feeding. To estimate mouthful size, a minimum of five mouthfuls were removed from the elephants’ mouths before ingestion. This was used to calculate an estimated mouthful weight for each type of plant species consumed. For the browse and woody parts, a unit count was done using a pre-defined length and breadth of the eaten part for reference (Rothman et al. Citation2012). To avoid disturbance, the animals were observed from a distance of 5–10 m (Chandra et al. Citation1990). The local names of the ingested plants were provided in the field by field assistants when possible. Samples of each plant species were gathered and sent to the National Plant Herbarium, Kathmandu, for scientific identification. All samples were collected on the day of consumption from the actual plants or from several adjacent plants of the same species. Plants were weighed immediately in the field using an Ohaus Scout Pro Portable Electronic Balance. The samples were oven dried to constant weight the following day at 60°C for 12 h at the National Trust for Nature Conservation (NTNC) office at Sauraha, before being transported to the feed analysis lab at the National Agricultural Research Centre in Kathmandu. The samples were ground in a Wiley mill using a 1 mm sieve before nutritional analysis.
Availability of the natural food plants was estimated using data collected from a recent survey of wild elephant foods in the area (Koirala et al. Citation2016).
Nutritional analysis
Nutritional analyses were run in duplicate, including those for dry matter (DM), crude protein (CP), ether extract (EE), neutral detergent fibre (NDF), acid detergent fibre (ADF), acid detergent lignin (ADL), ash and non-structural carbohydrate (NSC). All analyses and calculations were performed on dry matter basis. The CP concentration was determined using the Kjeldahl method (AOAC Citation1990). The CP was calculated by multiplying nitrogen (N) by 6.25. All macronutrient analysis was conducted according to AOAC standard methods recommended for animal feed (Rothman et al. Citation2012). NDF, ADF and ADL content of food items were measured by sequential analysis (Goering and Van Soest Citation1970; Van Soest et al. Citation1991). NSC was calculated using the following established equation: % NSC = 100 − (%CP + %NDF + %EE + %Ash) (Rothman et al. Citation2012). Crude fat (CF) was calculated by subtracting 1% from the EE value (Rothman et al. Citation2012) to account for indigestible waxes and fats.
DM digestibility was estimated by comparing the proportion of lignin in the diet to the proportion of lignin in the faeces using the following calculation adapted from Van Soest (Citation1994):
The NDF digestion coefficient was estimated using the following calculation:
Energy intake and balance
According to an energy balance study by Pagan and Hintz (Citation1986), metabolized energy averages 87% of the relative digestible energy (DE) intake in non-ruminant herbivores. In this study, DE and metabolized energy (ME) were estimated by the basal metabolic rate. Thus ME = MJ per kg0.75per day, with the DE converted to ME using an efficiency of 87% – i.e. ME = DE × 0.87 (Pagan & Hintz Citation1986). Based on this DE: ME ratio, the relative DE intake recommendations thus become 0.68 (DE) MJ per kg per day. This estimate of relative DE for maintenance was used to assess the adequacy of DE intake in the current study because it is commonly used to evaluate requirements of other hindgut fermenters such as horses, rhinos and tapirs (Romani et al. Citation2014).
The energy conversion values used were 17 kJ/g (4.0 kcal/g) for protein, 37 kJ/g (8.9 kcal/g) for fat, 17 kJ/g (4.0 kcal/g) for carbohydrates (FAO Citation2002) and 12.56 kJ/g (3.0 kcal/g) for NDF (Hohmann et al. Citation2012).
We used the right-angled mixture triangle (RMT), a multi-dimensional approach for modelling nutritional mixtures (Raubenheimer Citation2011), to visualize and compare the proportions of macronutrients and fibre in the foods and diets of elephants across different disease status, age–sex groups and seasons. Using this approach, we modelled energy from NDF and non-protein macronutrients (NSC + CF) in foods and in daily diet intake on the y- and x-axes, respectively. Energy from CP was represented on the third axis (i-axis; Raubenheimer Citation2011). These nutrients were modelled as a percentage of energy that each contributes to the sum of energy from all energy-giving nutrients included in the model (i.e. NDF + (NSC + CF) + CP). The i-axis variable (in this case CP) is implicit given the values of the x- and y-variables since %x + %y + %i = 100% of energy and therefore once %x and %y are stipulated so too is %i (Raubenheimer Citation2011). We used SPSS (IBM SPSS Statistics 22) to make comparisons of the macronutrient composition of the diet across seasons, female physiological state, age class, disease (TB) and gender pattern of intake and balance of crude protein (CP), NDF and non-protein macronutrient energy (CF + NSC) using one-way ANOVA and independent sample t-test. We ascertained the TB status of the elephants using the veterinary records of individuals. Proportional data (i.e. % energy from macronutrient or fibre values expressed as a proportion) were transformed using a “logit” transformation to approximate normality before running the ANOVA (Warton & Hui Citation2011). Spearman’s correlation was used to look for a relationship between availability of provisioned foods and their intakes by elephants.
Results
Feeding regime
Across all seasons 70% of the diet was provisioned food (browse, grass and pellets) while natural feeding (browse and grass) formed 30% of the elephant’s diet. In the dry season, browse formed 72% of the overall total diet and pelleted food and grass contributed 21% and 7%, respectively. In other seasons, approximately 90% of the diet comprised grass, with the remainder being pelleted food and browse. The list of food types eaten in each season is given in Table .
Table 2. List of natural and provisioned foods (browse, grass and pellet) eaten by elephants in different seasons of the year.
Seasonal differences in the nutritional content of key plants
Of the 45 food items consumed, we analysed the nutrient content of the 35 plant species and pellets that were observed to occur most commonly in the diet. In addition, eight composite dung samples for each individual were collected in each season for nutritional analysis.
There was no significant seasonal difference in the CP content for any of the key food items consumed by elephants (F 3, 31 = 1.72, p = 0.179) (Figure ). There was, however, a wide variation among species in the CP content. The highest CP content (20.6%) was found in narkat (Phragmites karka) followed by kutmiro (Litsea monopetala; 17.4%) in the dry season (1st season) (Figure ), with the lowest concentration of CP found in dhaddi (Saccharum bengalensis; 0.5%) in pre-monsoon (3rd season).
Figure 2. Seasonal nutrient content percentages of top ten most important key food items.
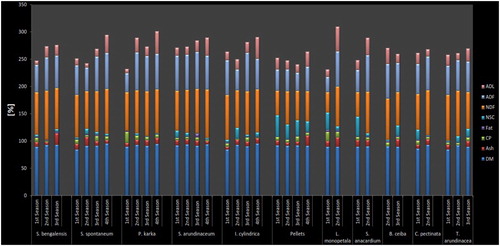
NDF content in food was highest in the monsoon season (4th season) (mean = 77.5, SD = 12.7), and lowest in the dry season (mean = 66.2, SD = 16.6) (Figure ). There was, however, no significant seasonal difference in the NDF content of food (F 3, 31 = 0.98, p = 0.411). Among species, the highest NDF content was found in dhaddi (S. bengalensis) in winter (2nd season) with 89.9% (Figure ), followed by barua (Saccharum arundinaceum) during the monsoon season with 88.6%. The lowest NDF was found in kutmiro (Litsea monopetala) in the dry season with 37.2%, followed by debre lahara (Spatholobus parviflorus) with 41.9%.
Seasonal differences in nutrient intake
We found a significant correlation (Spearman’s rho = 0.79, p = <0.01) between availability of provisioned foods and the intake of these foods within the provisioning environment. However, there was no correlation between availability and intake in the free-ranging environment (Spearman’s rho = 0.42, p = 0.165).
There was significant seasonal variation in dry matter intake (DMI) (F 3, 28 = 6.38, p = 0.002), with higher DMI intakes as a percent of body weight being observed in the dry season compared with other seasons (p = 0.008). There was a negative correlation between DMI and NDF in the diet across all seasons (r = −0.504, p = 0.003).
Dietary CP varied significantly across seasons (F 3, 502 = 12.55, p =≤ 0.01). In the dry season, average dietary CP energy content was 13% (±0.57 SE), in winter 12% (± 0.37 SE), pre-monsoon 11% (±0.56 SE) and in the monsoon season 15% (±0.62 SE). The consumption of NDF energy varied widely across seasons (F 3, 502 = 6.13, p =≤ 0.01), being lowest during the dry season and highest during winter (see Figure (A−D)).
Diet digestibility
Using lignin as an internal marker, the overall DM digestibility of foods consumed by elephants was not found to vary by season (F 3, 28 = 0.65 p = 0.584), age or sex (p = 0.8). However, the protein digestibility varied significantly with the season (F 3, 28 = 10.02, p = <0.001). Overall, diets were less digestible in dry months with more browse, with NDF and ADF digestibility of 22% and 5%, while highest digestibility was seen in the pre-monsoon season where digestibility of NDF and ADF were 38% and 36% respectively. Table compares the comparative digestibilities observed in this study with findings from captive elephants in India, Europe and New Zealand. In our study, the overall average CP, NDF and ADF digestibilities were 59.8%, 29.9% and 19.1% respectively, which are relatively less than other reports of diet digestibilities in elephants. Also, the fat digestibilities observed in our study were comparatively higher than for most of the captive elephants studied except for the Indian elephants (Nair & Ananthasubramaniam Citation1979). We analysed digestibility based on a wide range of food plants, while other researchers analysed digestibility based on a single plant species. Despite not being directly comparable, these comparisons can still give some insight into variation in digestibility and the relationship with the type of food provisioned.
Table 3. Comparative digestibility of different nutrients in Asian elephants’ diets.
Energy intake and macronutrient balance
The estimated daily intakes of DE (expressed as MJ/kg0.75) are summarized by age–sex class and compared with Thailand domestic elephants and Auckland Zoo captive elephant and with the recommended energy intake from Pagan and Hintz (Citation1986) in and (A−D). In the present study, the relative DE calculations (MJ per kg per day) were based on apparent DE and varied between 0.4 and 1.7 MJ per kg0.75 per day. In the dry season (1st season), data revealed that all elephants in the study, except elephant 7, had DE intake higher than the recommendations (Pagan & Hintz Citation1986) (A). Likewise, in winter (2nd season) and in the pre-monsoon season (3rd season), all elephants had higher DE intakes than the recommendations (BC). In the monsoon season (4th season), all elephants except elephant numbers 4 and 12 had higher DE intake than the recommendations (D). The average daily gross energy intake (GEI) ranged between 740 and 1494 MJ per day (A−D), and the apparent DE ranged between 208 and 609 MJ per day.
A positive correlation was found between body weight (BW) and GEI (r = 0.30, p = 0.09). The DE intake was found to vary with age class (F 2, 15 = 4.6, p = 0.02): the age class between 8 and 16 years was found to be ingesting most energy (0.95 MJ (DE) per kg0.75 per day), and the age class between 43 and 69 years had the lowest energy intake (0.68 MJ (DE) per kg0.75 per day).
Geometric analysis
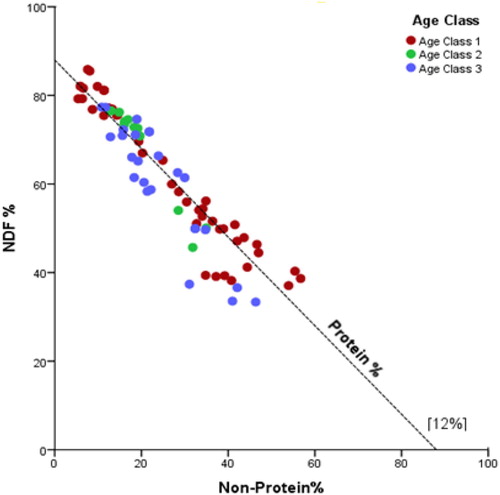
Geometric modelling suggested that overall dietary energy from CP varied less than energy derived from NDF and non-protein macronutrients (Figure ), both in terms of absolute variation (standard error) and variation standardized for the mean (coefficient of variation). Averaged across all feeding days, % CP contribution to energy of the multi-season diet was 12.4% CP (±0.94 SE, CV = 0.14), 27.5% NSC + CF (± 5.9 SE, CV = 0.42) and 60% NDF (± 6.2 SE, CV = 0.21).
Figure 3. Right-angled mixture triangle (RMT) showing the seasonal balance of crude protein (CP), Neutral detergent fibre (NDF) and non-protein macronutrient energy (CF + NSC). Protein is shown on the implicit z-axis, with the dashed reference line indicating 12% crude protein.
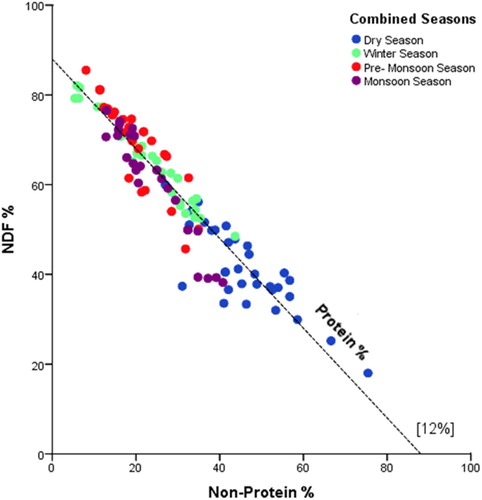
Variance in the ratio of % fibre: non-protein energy was in part due to seasonal variation (Figure ). The most pronounced seasonal difference was apparent during the dry season, where the diet of elephants tended to be higher in NSC + CF energy and lower in NDF energy than during other seasons.
To examine the variance in macronutrient balance within seasons, We examined plots of individual intakes for each season, which suggested that there was more between-individual than within-individual variance (Figure ). In the dry season, three elephants (Narayanikali, Ganeshkali and Karnalikali) had wider ranges of intakes, while others showed more consistent intake ratios. There is no significant difference in both non-protein and NDF intake between individuals (t 14 = 1.20, p = 0.25) (Figure (A)). In the other seasons, there were significant differences in the intake of non-protein and NDF intake between individuals (winter: t 14 = –0.85, p = <0.001; pre-monsoon: t 14 = –11.1, p = <0.001; monsoon: t 14 = –7.3, p = <0.001) (Figure (B−D)).
Figure 4. (A–D) Right-angled mixture triangle (RMT) showing the seasonal variation and intake balance of macronutrient and NDF in individual elephants.
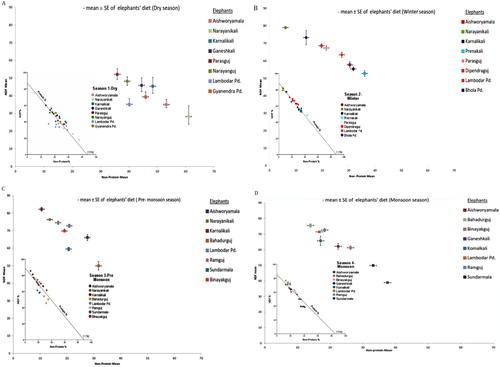
The dietary %protein energy varied across seasons from 11% to 15% (Figure (A–D)). The dietary % protein energy for elephant, Ganeshkali in the monsoon season was high with lowest intake of NDF energy.
There was greater variance in NDF (F 2.57 = 8.8, p =< 0.01) and non-protein energy (F 2.57 = 14.2, p =< 0.01) in lactating, non-lactating and pregnant females, while protein was less variable (F 2.57 = 4.198, p = 0.20). Lactating females showed higher demand for energy from non-protein (NSC + CF) and NDF (Figure ).
Figure 5. Nutrient balance of different reproductive status of female elephants.
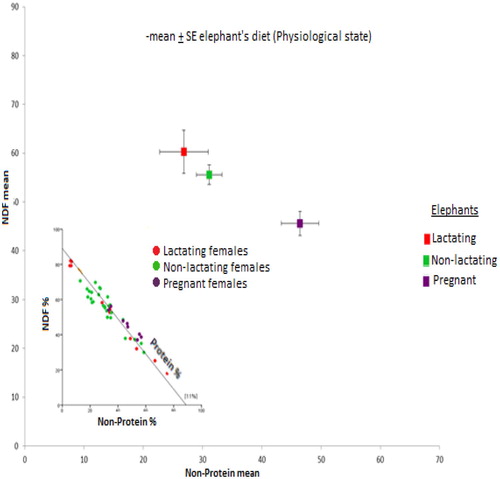
In pregnant elephants NDF variation was lower than non-protein, with a consistent intake of protein energy.
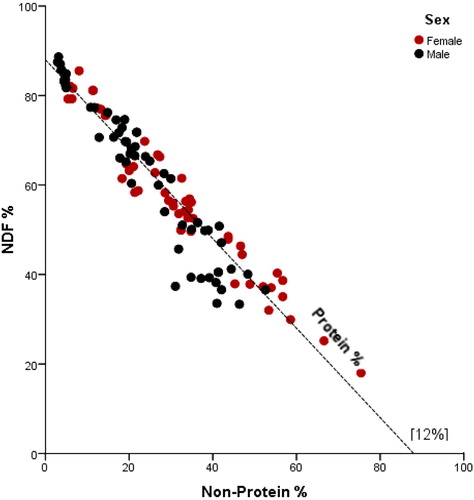
Overall, females had an average of 11% of energy ingested as protein, while males had a higher intake at 14% (t 111 = –2.32, p = 0.02) (Figure ).
Figure 6. Right-angled mixture triangle (RMT) showing the comparative percentage of male and female daily energy intake from crude protein (CP), NDF and non-protein macronutrients (NSC + CF).
Tuberculosis-positive individuals had a lower proportion of energy intake contributed by CP than did elephants that did not have TB (t 78 = –1.95, p = 0.05) (Figure ). Age class 1 (aged between 8 and 16 years) was found to consume more protein, NSC and NDF energy than other age groups (Figure ).
Figure 7. Right-angled mixture triangle (RMT) showing the comparative percentage of tuberculosis-positive and tuberculosis-negative individuals’ daily energy intake from crude protein (CP), NDF and non-protein macronutrients (NSC + CF).
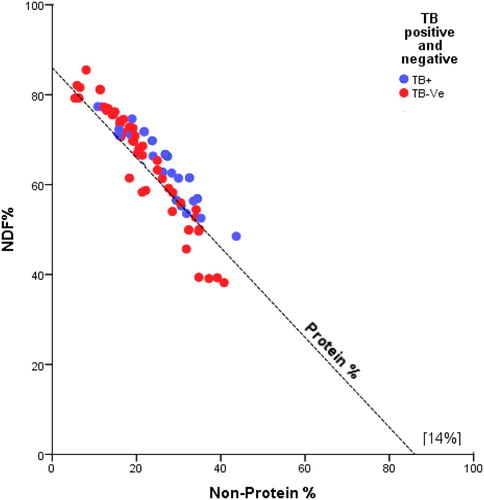
Figure 8. Right-angled mixture triangle (RMT) comparing across the different age groups the percentage of daily energy intake from crude protein (CP), NDF and non-protein macronutrients (NSC + CF).
Discussion
Adequacy diet
Seasonal nutrient content and intake
This study indicates there was no significant seasonal difference in nutritional content in any of the key food plants eaten by elephants. In a similar study, seasonal variation was found in selected plants eaten by wild elephants in northern India (Datta Citation2009). However, in that study the percent nitrogen content did not vary (Datta Citation2009). The percent NDF content in elephant food in Assam India did not vary significantly by season, while there was variation in NDF in food plants among some forested and non-forested sites (Das et al. Citation2014). The differences between these and our study could be attributed to the high variability in nutrient dynamics, but there are relatively few studies across different region and years (Heady et al. Citation1991) that would help to explain the changing patterns of the nutrient content of foods (Eviner & Firestone Citation2007).
Our results suggest that despite having an overall low content of CP in their food, the proportion of digestible protein in the diet in winter, pre-monsoon and monsoon feeding seasons was relatively higher than in the dry season. This higher protein dry matter intake is likely to be due to increased protein digestibility, which ranges from 29% to 80%, together with relatively more food intake with higher DDM (digestible dry matter).
Although the precise dietary requirements for particular nutrients for elephants are not well-known, because of their similarity to horses it has been proposed that an estimated CP intake for captive elephants is 8–10% of dry weight at maintenance and 12–14% and higher for the growth of juveniles and in other physiological states, such as late pregnancy and lactation (Ullrey et al. Citation1997).
Dry matter intake (DMI)
All elephants were found to have DMI between 1.6% and 1.9% (average 1.8%) of body weight, which was within the recommended range. The broad recommendation for the DMI of an elephant is based mostly on extrapolation from the diet of a horse (Oftedal et al. Citation1996) and also from studies undertaken in European zoo facilities. Results from these studies indicate that the daily dry matter requirements for Asian elephants are between 1.5% and 1.9% of body weight (Ullrey et al. Citation1997). The variation in the DMI in our study is due to different physiological states, such as pregnancy and lactation in females, sex, age, health status (TB present/absent) and habitat. On average, in the dry season elephants had a relatively greater DMI per unit BW and a lower digestible dry matter %, with the utilization of less protein per day due to lower protein digestibility. This result aligns with other findings of a negative relationship between dry matter intake (DMI) and dry matter digestibility across and within forages (Edouard et al. Citation2008). Seasonal changes in elephant feeding habits have also been reported in studies carried out in other countries (Field and Ross Citation1976; Sukumar Citation1990, Citation1993).
Fibre content and digestibility
The difference in individual intake of non-protein (NSC + CF) and NDF in the dry season were higher than in other seasons. In the dry season, elephants used a wider range of habitat and browse and grass species. The dry season showed a relatively higher protein content and lower NDF content in food, and a higher DMI/BW than the other seasons. However, the higher proportion in consumption of woody browse with higher contents of lower digestibility of NDF during this season led to a lower consumption of digestible energy. In winter, pre-monsoon and monsoon seasons, the numbers of species consumed was lower, and the elephants foraged in mostly grassland habitat. The crude protein content was low, with higher NDF and lower DMI/BW than in the dry season. Elephants are thought to be adapted to eat high-fibre foods. As hindgut fermenters, it has been suggested that their response to a decrease in food quality is to increase consumption so as to maintain rates of energy and nutrient absorption (Edouard et al. Citation2008). Some studies have shown that digestibility falls off with forage quality (less protein and higher fibre), however in terms of intake, these studies have found no significant relationship with forage quality (Duncan Citation1992; Edouard et al. Citation2008). In general, therefore, it seems that elephants can compensate for decreasing quality of food by eating more (Janis Citation1976) so as to obtain the levels of digestible energy and protein required for maintenance. The increase in consumption in winter, pre-monsoon and monsoon seasons could be related to the quality of forages, especially the % NDF dry matter content in food. There is an inverse relationship between NDF and dry matter intake; however, the increasing neutral detergent fibre digestibility (NDFD) could lead to higher consumption of dry matter. The increased NDFD is likely to be due to lower lignification in grass species during the sampling period. The lignin: ADF ratio has been used to predict fibre digestibility (Goering & Van Soest Citation1970). Despite having less crude protein in the food with relatively better NDFD, all individuals except two in winter, pre-monsoon and monsoon seasons met their metabolized digestible energy quantity. The higher intake of dry matter leads to the conclusion that if nutritionally balanced foods are not available in enough quantities to meet the daily requirements, individuals can reach their nutritional target by eating more nutritionally imbalanced complementary foods. The elephants in this study showed this trend, obtaining lower density energy sources from grasses, with 65% of energy from NDF, 14% from protein, 5% from fat and 16% from NSC.
Seasonal variation in macronutrient and fibre intake
Geometric analysis of the diet across the four seasons suggests that there was a seasonal, physiological and age class influence on macronutrient intake patterns in these elephants. The model suggests that there is a seasonal difference in their intake of NDF, NP (NSC + CF) and protein. The pattern of macronutrient intake in winter, pre-monsoon and monsoon seasons suggests that there is more inter-individual heterogeneity in macronutrient intake than intra-individual heterogeneity. This may be an example of variance among individual intake targets (Senior et al. Citation2015). This variation among individuals and within the group of elephants showed different responses to a decrease or increase in forage quality: most of the elephants compensated for low nutritional value of the forage by increasing intake. The influence of forage quality (digestibility, fibre content, CP) on the intake of elephants has not been well studied. The digestibility of forage did not decline consistently with forage quality (fibre and CP content). The results of our intake data analysis of the elephants in winter, pre-monsoon and monsoon seasons were consistent with those found for horses fed grass hay (Edouard et al. Citation2008) as there was more NDF and higher intakes of grasses in these seasons. Individual elephants can increase their intake as forage quality declines, but not all individuals respond in the same way on all forages. Thus, less inter-individual than intra-individual variation in food intake in the dry season could likely be due to the difference in individual physiological characteristics of elephants along with different and wider selection of plant foods. In the other seasons, the inter-individual variation in intake was greater than intra-individual variation as the difference in physiological variation was less with individual elephants and there were fewer plant species available for selection.
Most elephants maintained relatively constant proportional protein energy in the diet, but different individuals achieved this using different ratios of NPE/NDF energy. This protein regulation is like that reported for a captive elephant in Auckland Zoo, which kept protein proportion constant but used more NDF when in the forest compared with when offered provisioned food (Koirala Citation2018). This pattern of variation suggests that elephants in winter, pre-monsoon and monsoon seasons utilized a greater percentage of NDF energy with less energy from non-protein to maintain a constant level of protein in the diet. The less variation of nutrient intake by the same individual with a tighter clustering in the protein diagonal axis suggests that elephants maintain the nutrient intake so as to have little variance in the ratio of protein: non-protein energy. To achieve an optimal protein percentage and to keep this constant when protein becomes deficient in the repeatedly grazed feeding grounds in the winter, pre-monsoon and monsoon seasons, they increased the proportional intake of energy from NDF. Positive selection of protein by ungulates (Field Citation1976) and African and Asian elephants has been reported by other researchers (McCullagh Citation1969; Sukumar Citation1990). The geometric models have indicated that the energy contribution by NDF in the elephant diet was crucial for regulating protein balance. The results of this regulation in macronutrient balance provide strong evidence in support of our finding that overall there was optimal digestible or metabolized energy for most of the elephants in our study ().
In comparison, the geometric analysis of the diet of the elephants in the dry season suggests that food was more diverse, and the inter individual intake variation was less than during the other seasons. The non-protein and protein energy percentages were high, while NDF was low. All elephants except one maintained the recommended metabolized energy ().
Although the majority of the elephants maintained their metabolized energy however, relatively the tuberculosis positive individual consumed less protein energy than TB negative individuals. This might contribute to instances where protein calorie deficient results in rapidly fatal tuberculosis infection (Gupta et al. Citation2009).
Conclusion
This study showed that all the elephants met the recommended DMI and variable digestible energy. However, DMI is less informative than is digestible energy intake (Romani et al. Citation2014). Increased NDF digestibility will result in higher energy values, and perhaps more importantly, increased forage intakes. This study revealed that in all seasons most elephants acquired recommended energy intakes and reached a preferred level of nutrient composition, with tighter regulation of protein and varying balance of non-protein and NDF energy. An unexpected result was that in the winter, pre-monsoon and monsoon seasons, the elephants met recommended energy intake through higher energy contribution by NDF (through better NDFD), with a constant ratio of protein, despite having lower protein content in their food. This is likely to be because the elephants compromised by overeating NDF to compensate for the lower energy from protein. Feeding a nutritionally imbalanced food with a much higher percentage of energy from NDF may not show an immediate impact. However, the long-term imbalance of protein, NDF and non-protein energy may have associated costs and may lead to many health-related problems, which needs to be studied further. Thus, this study recommends rotational feeding in different habitats so that elephants are able to access a full variety of complementary balanced food rather than repeatedly grazing in an area with fewer species.
Acknowledgements
We thank the Institute of forestry, Tribhuvan University and the Department of National Park and Wildlife Conservation, the government of Nepal; for their support.
Disclosure statement
No potential conflict of interest was reported by the authors.
Additional information
Funding
References
- AOAC . 1990. Official methods of analysis. 15th ed. Arlington (VA): Association of Analytical Chemists.
- Bhattarai BP , Kindlmann P. 2012. Habitat heterogeneity as the key determinant of the abundance and habitat preference of prey species of tiger in the Chitwan National Park, Nepal. Acta Theriol. 57:89–97. doi: 10.1007/s13364-011-0047-8
- Chanchani P , Lamichhane BR , Malla S , Maurya K , Bista A , Warrier R , Nair S , Almeida M , Ravi R , Sharma R , Dhakal M. 2014. Tigers of the Transboundary Terai Arc Landscape: status, distribution and movement in the Terai of India and Nepal. Kathmandu : National Tiger Conservation Authority, Government of India, and Department of National Park and Wildlife Conservation, Government of Nepal NTNC/DNPWC.
- Chandra MS , Ravoof AKI , Khan IA. 1990. Feeding behaviour of captive elephants. Myforest. 26:239–242.
- Clauss M , Loehlein W , Kienzle E , Wiesner H. 2003. Studies on feed digestibilities in captive Asian elephants (Elephas maximus). J Anim Physiol Anim Nutr. 87:160–173. doi: 10.1046/j.1439-0396.2003.00429.x
- Das BJ , Saikia BN , Baruah KK , Bora A , Bora M. 2014. Nutritional evaluation of fodder, its preference and crop raiding by wild Asian elephant (Elephas maximus) in Sonitpur District of Assam. Veterinary World. 7:1082–1089. doi: 10.14202/vetworld.2014.1082-1089
- Datta SB. 2009. Nutritional ecology of Asian elephants (Elephas maximus) in Chilla Range of Rajaji National Park, Uttarakhand [doctoral dissertation]. Saurashtra University.
- DNPWC and PPP . 2000. Royal Chitwan National Park and buffer zone, resource profile. Kathmandu : Babar Mahal.
- DNPWC, Department of National Park and Wildlife Conservation . 2011. Nepal Elephant Tuberculosis Control and management Action Plan (2011-2015). Kathmandu : Government of Nepal, MOFSC, DNPWC.
- Duncan P. 1992. Horses and grasses: the nutritional ecology of equids and their impact on the Camargue. New-York (NY ): Springer Science & Business Media.
- Edouard N , Fleurance G , Martin-Rosset W , Duncan P , Dulphy JP , Grange S , Baumont R , Dubroeucq H. 2008. Voluntary intake and digestibility in horses: effect of forage quality with emphasis on individual variability. Animal. 2:1526–1533. doi: 10.1017/S1751731108002760
- Eviner VT , Firestone MK. 2007. Mechanisms determining patterns of nutrient dynamics. In: M. Stromberg , J. M. Corbin , C. D’Antonio , editor. California grasslands: ecology and management. Berkeley (CA): UC Press; p. 94–106.
- FAO . 2002. Food and nutrition papermethods of analysis and conversion factor report of a technical workshop.
- Field CR. 1976. Palatability factors and nutritive values of the food of buffaloes (Synercus caffer) in Uganda. Afr J Ecol. 14:181–201. doi: 10.1111/j.1365-2028.1976.tb00163.x
- Field CR , Ross IC. 1976. The savannah ecology of Kidepo Valley National Park. Afr J Ecol. 14:1–15. doi: 10.1111/j.1365-2028.1976.tb00148.x
- Foose TJ. 1982. Trophic strategies of ruminant versus nonruminant ungulates [doctoral dissertation]. University of Chicago.
- Goering HK , Van Soest PJ. 1970. Forage fiber analyses (apparatus, reagents, prcedures, and some applications). Washington (DC): USDA Agr Handb.
- Gupta KB , Gupta R , Atreja A , Verma M , Vishvkarma S. 2009. Tuberculosis and nutrition. Lung India. 26:9. doi: 10.4103/0970-2113.45198
- Hackenberger MK. 1987. Diet digestibilities and ingesta transit African elephants [masters dissertation]. University of Guelph, Canada.
- Heady HF , Bartolome JW , Pitt MD , Savelle GD , Strou MC. 1991. California prairie. In: R.T. Coupland , editor. Natural grasslands: introduction and Western Hemisphere. Amsterdam : Elsevier; p. 313–335.
- Hohmann G , Robbins MM , Boesch C. 2012. Feeding ecology in apes and other primates. Cambridge (CA): Cambridge University Press.
- Janis C. 1976. The evolutionary strategy of the equidae and the origins of rumen and caecal digestion. Evolution. 30:757–774. doi: 10.1111/j.1558-5646.1976.tb00957.x
- Kharel F. 2005. The challenge of managing domesticated Asian elephants in Nepal. Italy : FAO. http://www.fao.org/docrep/005/ad031e/ad031e0e.htm on 8/07/2015.
- Koirala RK. 2018. Nutritional ecology of Asian elephant (Elephas maximus) and human-wildlife interactions [doctoral dissertation]. Massey University.
- Koirala RK , Raubenheimer D , Aryal A , Pathak ML , Ji W. 2016. Feeding preferences of the Asian elephant (Elephas maximus) in Nepal. BMC Ecol. 16(54).
- Locke P. 2011. The ethnography of captive elephant management in Nepal: a synopsis. Gajah. 34:32–40.
- McCullagh K. 1969. The growth and nutrition of the African elephant II. The chemical nature of the diet. Afr J Ecol. 7:91–97. doi: 10.1111/j.1365-2028.1969.tb01197.x
- Nair VB , Ananthasubramaniam CR. 1979. Studies on the nutritional-requirements of the elephant (Elephas-maximus). 1. Evaluation of the nutritive-value of palm leaf (Caryota-urens). Indian Vet J. 56:667–671.
- Oftedal OT , Baer DJ , Allen ME. 1996. The feeding and nutrition of herbivores. In: Kleimann DG , Allen ME , Thompson KV , Lumpkin S , editor. Wild mammals in captivity: principles and techniques. Chicago : University of Chicago Press; p. 129–138.
- Pagan JD , Hintz HF. 1986. Equine energetics. I. Relationship between body weight and energy requirements in horses. J Anim Sci. 63:815–821. doi: 10.2527/jas1986.633815x
- Pradhan NM , Williams AC , Dhakal M. 2011. Current status of Asian elephants in Nepal. Gajah. 35:87–92.
- Raubenheimer D. 2011. The right-angled mixture triangle. Bull Ecol Soc Am. 92:294–297. doi: 10.1890/0012-9623-92.3.294
- Reichard TA , Ullrey DE , Robinson PT. 1982. Nutritional implications of dental problems in elephants. Proceedings of the Second Annual Dr Scholl Nutrition Conference on the Nutrition of Captive Wild Animals, Chicago, p. 63–67.
- Romani S , Angkawanish T , Bampenpol P , Pongsopawijit P , Sombatphuthorn P , Nomsiri R , Silva-Fletcher A. 2014. Diet composition, food intake, apparent digestibility and body condition score of the captive Asian elephant (Elephas maximus): a pilot study in two collections in Thailand. J Zoo Wildl Med. 45:1–14. doi: 10.1638/2011-0261R3.1
- Rothman JM , Chapman CA , Van Soest PJ. 2012. Methods in primate nutritional ecology: a user’s guide. Int J Primatol. 33:542–566. doi: 10.1007/s10764-011-9568-x
- Rothman JM , Raubenheimer D , Chapman CA. 2011. Nutritional geometry: Gorillas prioritize non-protein energy while consuming surplus protein. Biol Lett. 7:847–849. doi: 10.1098/rsbl.2011.0321
- Senior AM , Charleston MA , Lihoreau M , Buhl J , Raubenheimer D , Simpson SJ. 2015. Evolving nutritional strategies in the presence of competition: a geometric agent-based model. PLoS Comput Biol. 11(3):e1004111. doi: 10.1371/journal.pcbi.1004111
- Stevenson MF , Walter M. 2006. Management guidelines for the welfare of zoo animals. In: Elephants: Loxodonta africana and Elephas maximus. 2nd ed. London : British and Irish Association of Zoos and Aquariums; p. 217.
- Straede S , Helles F. 2000. Park-people conflict resolution in Royal Chitwan National Park, Nepal: buying time at high cost? Environ Conserv. 27:368–381. doi: 10.1017/S0376892900000424
- Sukumar R. 1990. Ecology of Asian elephant in Southern India II: feeding ecology and crop raiding patterns. J Trop Ecol. 6:33–53. doi: 10.1017/S0266467400004004
- Sukumar R. 1993. The Asian elephant: ecology and management. Cambridge : Cambridge University Press.
- Ullrey DE , Crissey S , Hintz HF. 1997. Elephants: nutrition and dietary husbandry—fact Sheet 004. East Lansing (MI): Nutrition Advisory Group Handbook.
- Van Soest PJ. 1994. Nutritional ecology of the ruminant. Ithaca (NY): Cornell University Press.
- Van Soest PJ , Robertson JB , Lewis BA. 1991. Methods for dietary fiber, neutral detergent fiber, and non-starch polysaccharides in relation to animal nutrition. J Dairy Sci. 74:3583–3597. doi: 10.3168/jds.S0022-0302(91)78551-2
- Varma S , Ganguly S. 2011. Investigations into population, management, welfare and a review of elephant training by Working Elephant Programme of Asia (WEPA), and WWF Finland at Bardia Hattisar.
- Warton DI , Hui FKC. 2011. The arcsine is asinine: the analysis of proportions in ecology. Ecology. 92:3–10. doi: 10.1890/10-0340.1