
 ?Mathematical formulae have been encoded as MathML and are displayed in this HTML version using MathJax in order to improve their display. Uncheck the box to turn MathJax off. This feature requires Javascript. Click on a formula to zoom.
ABSTRACT
Linear and nonlinear models were used to evaluate the effect of heterosis on the components of the lactation curves of different crossbred groups of cows from Girolando cattle. Data consisted of 233,587 test-day milk yield records from 33,995 primiparous cows from 1998 and 2014. The Wood’s linear model (WDlin), Wood’s nonlinear model (WDnlin), Wilmink’s model (WL) and Ali and Schaeffer’s model (ASH) were used to estimate individual peak milk yield (PY), day of peak milk yield (PT), 305-day milk yield (TMY), different persistency measures and parameters of lactation curves. The quality of fit of models was different for the genetic groups. The WL model was used to the estimation of heterosis because of the best fit of lactation curve. The heterosis effect was significant (P < .001) for TMY, PY and for the ‘a’ parameter of WL model (initial production). For TMY and PY, crossbred cows presented 14.64% and 20.60% larger yields than the average of the parental breeds, respectively. The heterosis effect from crossbreeding presents more benefits for the components of initial stage of milk yield and milk yield at the peak and with a lesser extent with the two final stages (persistency).
1. Introduction
Milk production in Brazil has made considerable increased considerably in the last decades, from 11.1 million litres in 1980 to more than 35 billion litres of milk in 2014 (Prata et al. Citation2015). It was estimated that about 80% of the milk produced in Brazil comes from cows that have Holstein and Gyr genes in their genetic composition (Silva et al. Citation2015). The crossbreeding between those two breeds (Holstein and Gyr) has been an important tool in order to increase milk yield and reproductive efficiency and improve the adaptation of animals in the tropical conditions, which uses the benefits from the heterosis expression and complementarity between breeds (Canaza-Cayo et al. Citation2014; Prata et al. Citation2015). Such benefits have contributed to the beginning of Girolando cattle formation in 1940 (Silva et al. Citation2015).
Animals with different genetic compositions from different crossbreedings present large genetic variation. In such a heterogenous group, individual lactation curves are useful for predicting the performance of milk yield (Pereira et al. Citation2016). Many mathematical models have been developed in order to describe the shape of the lactation curve and its graphical trajectory along days in milk (Ali and Schaeffer Citation1987; Wood Citation1967, Wilmink Citation1987). The modelling of lactation curve may predict the level of production with high accuracy as well as permit understanding the pattern of milk yield under different environmental conditions (Şeahin et al. Citation2015). Thus, functions that describe milk production in time can be very applicable in genetic breeding programmes, since through the mathematical model the milk production of cows can be predicted and the results can be applied in animal breeding programmes (Hossein-Zedeh Citation2017). Most studies on the lactation curve evaluate the average pattern between homogeneous groups of animals, even when the most important are the individual curves (Şeahin et al. Citation2015). On the other hand, considering that the shape of lactation curve may differ between breeds and animals within the breed, the study of different genetic groups is fundamental to verify the heterosis on the traits associated to the lactation curve traits. The heterosis effect from European-Zebu crossbred populations may range between 17% (Rege Citation1998) and 28% (Cunningham and Syrstad Citation1987).
Studies have verified the expression of heterosis on the milk yield traits and on the lactation length (Facó et al. Citation2005; Bryant et al. Citation2007; Lembeye et al. Citation2015). However, there are few studies about the heterosis effect on the shape of the lactation curve of Girolando cows, mainly for the different genetic groups of this breed.
The aim of this study was to verify the heterosis effect on the lactation curve characteristics of different compositions of genetic groups from Girolando cattle, using linear and nonlinear models.
2. Materials and methods
2.1. Data
Data from test-day records, which were collected between 1998 and 2014, consisted of 233,587 test day milk yield records (MY) of the first lactation from 33,995 cows of Minas Gerais State (Brazil). Those cows were from Holstein breed (H), Gyr breed (G), and six genetic crossbreedings of Holstein x Gyr, (1/4H, 3/4G (1/4H); 3/8H, 5/8G (3/8H); 1/2H, 1/2G (1/2H); 5/8H, 3/8G (5/8H); 3/4H, 1/4G (3/4H); 7/8H, 1/8G (7/8H)), which is officially named as Girolando breed in Brazil. A 4–10 test day records per cow, obtained from 5 to 305 days in milk, were considered for estimating the lactation curves by the mathematical models. Abnormal yield values or outliers were checked by graphical techniques as normal probability plots and boxplots, as well as by median, mean, mode, skewness and kurtosis values. Then the test day milk yield and the 305-day milk yield records were removed if milk yield were out of the range from 3 to 45 kg and from 686 to 11026 kg, respectively. The descriptive analysis of the edited data is presented in .
Table 1. Number of cows, herds and test day milk yield records as well as 305-day milk yield records (TMY) of genetic groups with different proportion of Holstein genes obtained from the Brazilian databases.
2.2. Lactation curve models
The linear and nonlinear models used to fit test day milk yield along lactation of Holstein, Gyr and Girolando breeds were:
-
Wood’s nonlinear model (WDnlin) (Wood Citation1967):
In the models, Yt
is the average daily yield in the t
th test day of lactation; a is the initial milk yield just after calving; b is the ascending slope parameter up to the peak yield; c is the descending slope parameter and t is the length of time since calving. Ali and Schaeffer’s model (ASH) (Ali and Schaeffer Citation1987):
In this model, Yt
is the average daily yield in t
th test day of lactation, and is associated with peak yield, b and c are associated with the decreasing slope, d and e are associated with the increasing slope. After the estimation of the parameters of each mathematical model, peak milk yield (PY) and the day of maximum milk yield (PT) were estimated for each model using the mathematical functions as referred in the original papers. The persistency measures (P2:1, P3:1 e P3:2 and Pweller) used were ratios between average milk yields obtained in different parts of the lactation and all four measures were expressed as percentage. The P2:1, P3:1 and P3:2 were calculated as proposed by Johansoon and Hansson (Citation1940):
The Pweller were defined by Weller et al. (Citation2006) as estimated milk production at 180 d after peak divided by estimated peak production in percent was described as:where
(270) and
(90) are milk production at 270 and 90 days in milk, respectively.
Predicted 305-d MY (TMY) were obtained for each model using the following equation described by Vargas et al. (Citation2000):where TMY denotes predicted 305-d MY and y(t) represents MY at day t estimated by corresponding lactation models.
2.3 Breed and heterosis effects
The three breeds were considered with enough records to estimate the breed effect for all traits. The proportion of genes was calculated for each cow as:where
is the proportion of genes from breed
in the progeny,
is the proportion of breed
in the sire, and
is the proportion of breed
in the dam.
Coefficients of specific heterosis were calculated between any pair of the dairy breeds using the following identify (Dickerson Citation1973):where
is the coefficient of expected heterosis between fractions of breeds
and
in the progeny,
and
are proportions of breeds
and
in the sire, and
and
are proportions of breed
and
in the dam.
The coefficients of specific heterosis effect were used for the six genetic groups in Girolando cattle, because the distribution of cows across classes of coefficients of expected heterosis was suitable for this purpose. The coefficient of general heterosis for each cow was obtained by summing coefficients of specific heterosis previously calculated.
2.4 Statistical analyses
Each model was fitted to test day milk yield records using NLIN, REG and AUTOREG procedures in SAS (Statistical Analysis System, version 9.3). The nonlinear models were fitted to the milk yield records as the iteration method of Gauss–Newton.
The models were tested for goodness of fit using the adjusted coefficient of determination (R 2 adj), root means square error (RMSE) and Akaike’s information criterion (AIC).
R
2
adj was calculated using the following formula:where R
2 is the coefficient of determination
TSS is total sum square, RSS is residual sum of square, n is the number of observations (data points) and p is the number of parameters in the equation.
RMSE is kind of generalized standard deviation and was calculated as follows:where RSS is the square root of residual sum of squares, n is the number of observations (test day records) and p is the number of parameters in the equation. The best model is the one with the lowest RMSE.
AIC was calculated using the following equation (Burnham and Anderson Citation2002):
A smaller numerical value of AIC indicates a better fit when comparing models.
The heterosis effect of the components of lactation curve in Girolando cattle was estimated by MIXED procedure in SAS. The heterosis effects were obtained after fitting the following mixed linear model:where:
the observation
taken in cow
and herd
.
is na constant.
the random effect of herd
.
the random effect of cow
.
are regression coefficients associated with the linear
and quadratic
effects of age of cow.
the regression coefficient associated with the linear effect of proportion of Holstein (f).
the regression coefficient associated with the linear effect of heterosis (h) between Holstein and Gyr.
residual random error associated to observation
.
3. Results
The values of the parameters estimated by the non-linear (WDnlin and WL) and linear models (WDlin and ASH) and the criteria of the quality of fit of these models for test day milk yield records of cows from different genetic groups are associated to the pattern of the typical shape of the lactation curves calculated in this study ( and 3, ). The values of the parameters estimated by WDnlin, considering the different genetic groups, ranged from 13.377–16.923 for parameter ‘a’, from 0.210–0.376 for parameter ‘b’ and from 0.0033–0.0052 for ‘c’. The WL model estimated higher values for parameter ‘a’ (16.831–22.312) than that in the WDnlin, and negative values for parameters ‘b’ (−5.544–12.740) and ‘c’ (−0.0207 to −0.0003) in most genetic groups. In the linear models, the values of the lactation curve parameters estimated by WDlin model for the different genetic groups ranged from 2.254–2.797 for the parameter ‘a’, from 0.040–0.210 for the ‘b’ and −0.001 to −0.003 for parameter ‘c’. The ASH model estimated positive values for the parameter ‘a’ (3.522–14.729) and negative for the other parameters ‘b’ (−0.006 to −0.025), ‘c’ (−0.0001 to −0.00009), ‘d’ (2.973 to −10.842) and ‘f’ (−0.049 to −1.236).
Figure 1. Trajectory of lactation curves estimated by 305-day milk yield from database (TMY), Wood’s linear model (WDlin), Ali and Schaeffer’s model (ASH), Wood’s nonlinear model (WDnlin) and Wilmink model (WL) for 1/2H (A), 1/4H (B), 3/4H (C), 3/8H (D), 5/8H (E), 7/8H (F), G (G) and H (H) genetic groups.
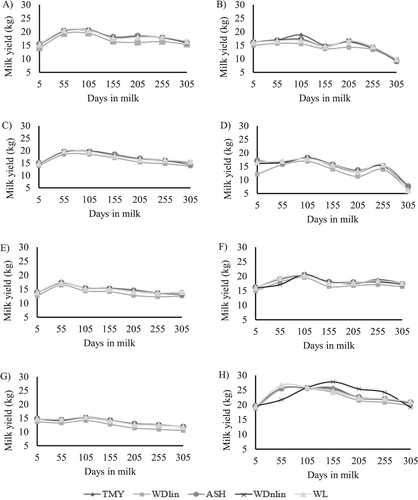
Table 2. Estimated parameters (mean ± SE) of the lactation curve obtained from different nonlinear models, adjusted coefficient of determination (R 2 Adj), root mean square error (RMSE) and Akaike information criterion (AIC).
The quality of fit criteria indicated that there were differences between non-linear and linear models as well as between genetic groups ( and 3). WDnlin model presented the highest mean values of R2 adj for the 1/4H (0.615), 3/4H (0.578), 3/8H (0.643) groups, while WL presented the highest mean values for the 1/2H (0.615), 5/8H (0.626), 7/8H (0.597), G (0.723) and H (0.652) groups (). Similarly, the lowest values of RMSE and AIC fitted by WDnlin were for the 1/4H, 3/4H, 3/8H groups, where as the WL presented the lowest mean values for the 1/2H, 5/8H, 7/8H, G and H groups.
The mean values of R 2 adj differed between linear models and different genetic groups. In the linear models, the ASH model presented the highest mean values of R 2 adj (0.500–0.629) considering all the genetic groups while for the WDlin model the values ranged from 0.413–0.539 (). The mean RMSE and AIC values differed substantially between the linear models. In addition, the lowest values were observed for WDlin regardless of the genetic group. In regard to the mean values of R 2 adj, the ASH model presented the best fit of the lactation curves of all genetic groups. The WDlin was considered the most suitable model to describe the lactation curves according to RMSE and AIC criteria.
Table 3. Estimated parameters (mean ± SE) of the lactation curve obtained from different linear models, adjusted coefficient of determination (R2 Adj), root mean square error (RMSE) and Akaike information criterion (AIC).
Except for 1/4H, 3/8H, 7/8H and H groups, the mean lactation curves estimated by WDnlin, WL, WDlin and ASH may be used to represent the real shape of the average lactation curve (). For the 1/4H group, the mean individual curves estimated by WDnlin, WL and ASH did not represent the observed curve, since the peak of lactation of observed curve was not fitted adequately. For the 3/8H group, only the curve obtained by the ASH model fitted the initial stage of lactation compared to observed curve. For the 7/8 group, the trajectory of the lactation curve estimated by WDnlin did not follow the ascending stage. Similarly, for H group, when the curve estimated by WDnlin was compared to observed curve, the trajectory did not follow either the ascending or descending stage of the lactation curve. In general, the WDlin model estimated lower milk yield values than those in the observed lactation curve on all stages. The visual comparison of lactation curves estimated by WDnlin, WL, ASH with the observed curve showed that the best fit was for 1/2H e G groups ().
The estimate mean of PY and PT differed between models and genetic groups ( and 5). Different results were found for the estimates of TMY and persistency (P2:1, P3:1, P3:2 and Pweller), which presented smaller differences between models and genetic groups.
Table 4. Estimated (mean ± SE) of peak yield (PY), peak time (PT), persistency (P2:1; P3:1, P3:2 and Pweller) and 305-day milk yield (TMY) for different genetic groups estimated by nonlinear models.
The means of PY and TMY reached for the genetic groups when estimated by the WDnlin, WL, WDlin and ASH models ranged from 16.64–27.87 kg and 3737–7321 kg, from 15.61–21.55 kg and 3744–7307 kg, from 13.01–23.10 kg and 3374–7021 kg, from 20.70–27.00 kg and 3745–7303 kg, respectively. Regardless of the fitted model, the highest mean estimates of PY and TMY were obtained for H group, followed by group 1/2H. The lowest average values of PY and TMY were estimated by the WDnlin, WL and WDlin models for the G group.
Unlike those models, the ASH model estimated the lowest mean of PY for 5/8H, but, similarly to the other models, the lowest mean of TMY was found for G group.
The mean values of PT estimated by the WDnlin, WL, WDlin and ASH for the crossbred groups ranged from 60.28–73.28 days, 81.08–88.77 days, 58.03–80.26 days and 90.22–100.01 days, respectively. The PT values estimated by WDnlin and WL were 93.26 and 106.35 days for H and 68.69 and 81.08 for G, respectively (). The PT values estimated by linear models were 72.48 and 106.96 days for H and 68.64 and 107.55 days in milk for G, respectively ().
Table 5. Estimated (mean ± SE) of peak yield (PY), peak time (PT), persistency (P2:1; P3:1, P3:2 and Pweller) and 305-day milk yield (TMY) for different genetic groups estimated by linear models.
The values of persistency measures (P2:1, P3:1, P3:2 and Pweller) were higher for nonlinear models (WDnlin and WL) than those for linear models (WDlin and ASH). In general, the most persistent lactation curves were found for H group, which presented the highest mean values of P2:1 (103.69% and 98.58%), P3:1 (89.66% and 99.34%), P3:2 (85.21% and 97.31%) and Pweller (78.98% and 98.96%), when fitted by WDnlin and WL, respectively. On the other hand, the linear models (WDlin and ASH) indicated the most persistent lactation curves for G group, considering all the persistency measurements.
Considering the nonlinear models, the heterosis effect was evaluated only by the WL model, whose choise was based on the lowest R 2 Adj, RMSE and AIC values for the genetic groups with the largest number of animals, that is, 1/2H, 5/8H, 7/8H, G and H groups (). In addition, in spite of the lowest values of R 2 Adj, RMSE and AIC between the linear models, WDlin did not present the best precision in the fit quality of the lactation curves for the different genetic groups when the trajectory of the curves was compared ().
The effect of heterosis was significant (P < .001) for TMY, PY and the parameter ‘a’ of model WL (initial production) for cows of different genetic groups that comprise the Girolando breed (). The heterosis effect was also significant (P < .05) for PY, P2:1 and the parameter ‘a’ of WL model. On the other hand, there were not significant (P > .05) heterosis effect for the different measures of persistency (P3:1, P3:2, Pweller) and for the ‘c’ parameter of WL model. The magnitude of heterosis effect of TMY and PY estimated for the different genetic groups were + 809 kg and + 4.59 kg larger than that in parental breeds. It indicates that the performance of Girolando cows were 14.64% (TMY) and 20.60% (PY) larger than the average of parental breeds.
Table 6. Heterosis effect (mean ± SE) for Wilmink parameters (‘a’, ‘b’ and ‘c’), peak yield (PY), peak time (PT), persistency measures (P2:1, P3:1, and P3:2) and 305-day milk yield (TMY) estimated Wilmink nonlinear model.
The largest heterosis effect was for ‘a’ parameter estimated by WL (associated to the initial stage of lactation), which presented an initial production of 23.05% higher than the average of parental pure breeds. The lowest heterosis effect was for PT (0.007%). Among the four persistency measures (P2:1, P3:1, P3:2 and Pweller) only P2:1 presented heterosis effect (2.56%).
4. Discussion
The Use of mathematical modeling of the lactation pattern provides an important tool for the management of milk production because the selection of animals can be based on the prediction of milk yield, considering the variation between and within genetic groups (Hossein-Zadeh Citation2017). Thus those models provide an indication of the nutritional management for each genetic group and the group with the highest probability of achievement of a desired level of milk yield (Hossein-Zadeh Citation2016). However, the studies about the modeling of lactation curve and its components should be used with caution, because the wrong choice may lead to economical losses (Pereira et al. Citation2016).
In this study, the individual lactation curves in different genetic groups of cows from Girolando cattle were described by linear and nonlinear models in order to study the heterosis effect on the components of the lactation curve. Those heterosis effects were obtained for the ‘a’, ‘b’ and ‘c’ parameters of mathematical model, peak yield, time to peak yield, different persistency measures. The values of the ‘a’, ‘b’, and ‘c’ parameters from WDnlin and WDlin were different in the genetic groups. In both models, the values of those parameters were positive, with ‘b’ and ‘c’ near to zero. Similar values were found for Holstein cattle by Jeretina et al. (Citation2015) and Torshizi et al. (Citation2011), using WDnlin and WDlin, respectively. The values of the parameters estimated by WDlin and WDnlin were associated to the typical pattern of the lactation curves in the different genetic groups. The typical pattern of lactation curves from Wood’s model was due to the positive values of ‘a’, ‘b’ and ‘c’, with ‘b’ between 0 and 1 (Vinay-Vadillo et al. Citation2012). The negative values of ‘b’ and/or ‘c’ in that model are considered a problem (Pollott and Gootwine Citation2000). Consequently, they are not indicated for calculating the estimates of PY, PT and TMY (Wood Citation1967).
In the WL model, the values of the parameter ‘a’ were positive but ‘b’ and ‘c’ were negative in genetic groups. Larger values of the ‘a’, ‘b’, and ‘c’ parameters estimated by WL for Holstein cattle were found by Torshizi et al. (Citation2011). However, the results in this study using WL were close to those found by Pereira et al. (Citation2016) for cows from Bos taurus taurus x Bos taurus indicus.
The ASH model presented the highest estimates for parameter ‘a’ compared to the other models, with ‘b’ and ‘d’ negative and ‘f’ close to zero. In the ASH model, the inferences based on the parameter values are not indicated, because their parameters do not present a biological meaning (Macciotta et al. Citation2011). The graphical presentation of lactation curves fitted by ASH model for the different groups was similar to the observed TMY ( and ).
The curves fitted by ASH model presented the typical shape of the lactation curve. Atypical shapes are characterized by the absence of the peak yield (Olori et al. Citation1999; Macciotta and Vicario Citation2005). The absence of a typical lactation curve shape may be indicative of the low quality of fit, but other factors may occur to change the shape of the lactation curve. Lactation curve shapes different from the standard may occur, especially when individual patterns are fitted (Macciotta et al. Citation2011). One of the possibilities is a continuously increasing or continuously decreasing curve with the absence of the peak yield, being called atypical shapes (Olori et al. Citation1999; Macciotta and Vicario Citation2005). Another possibility is a reversed shape, with an initial decreasing phase to a minimum followed by an increase, that is common for fat and protein contents (Macciotta et al. Citation2011). Another exception to the standard shape is represented by the existence of a second lactation peak in cows calving in autumn in pasture-based farming systems (García and Holmes, Citation2001).
The tests of the quality of fit indicated that the curves fitted by WDnlin were best for the 1/4H, 3/4H, 3/8H groups while the 1/2H, 5/8H, 7/8, G and H groups presented the best fit when fitted by WL model (). Olori et al. (Citation1999) estimated higher values of R 2 adj in WL than those in WDnlin for Holstein cattle. Those same authors reported that R 2 adj values higher than 0.7 indicate the models with the best fit while values lower than 0.4 the worst. In regard to the linear models, WDlin presented lower values of R 2 adj compared to ASH model for all the genetic groups. The quality of fit increased slightly with the increase in the number of parameters, which was similar to the results found by Jamrozik et al. (Citation1997). However, WDlin presented the lowest values of RMSE and AIC for all genetic groups (). The differences of quality of fit between models may be attributed to differences between breeds, mathematical functions, differences between test-day milk yields and the amount of available data (Khan et al. Citation2012). Besides the mathematical functions, the model that best fit the shape of lactation curves also depend on the calving order (Şeahin et al. Citation2015) and the biological nature of the parturition itself, which varies randomly between cows (Olori et al. Citation1999).
Despite the use of data of first parity cows from the same region, analyses were realized in data of each cow individually. It could be associated to the fact that each criterion indicated a different model as the best fit for the lactation curves of cows. Although the RMSE and AIC criteria indicated WDlin as the best choice, that model did not fit the lactation curves with similar precision to WDnlin, WL and ASH, when the fitted curves were compared to the observed curves (). There is not a consensus in literature about the best model for a situation because different criteria may indicate different models (Cobuci et al. Citation2011). Consequently, such a choice can become a difficult task. In several studies, WDnlin, WL and ASH models were successfully applied in the adjustment of individual lactation curves (Macciotta and Vicario Citation2005; Silvestre et al. Citation2006). The use of ASH, WL and WDnlin models is commonly recommended in dairy cattle because they are suitable to describe the lactation curves, provided there is no limitation in the amount of available data as lack of test-day records in a certain stage of lactation or lower number of animals of groups of animals (Khan et al. Citation2012).
The lower number of test-day records of the 1/4H, 3/8H and 7/8H groups could have influenced the quality of fit of models, since none of the fitted curves followed perfectly the trajectory of the observed curves along days in milk (). However, despite the higher number of animals in the H group, the curves fitted by WDnlin presented lower milk yields between 5 and 100 days in milk and higher milk yields between 101 and 305 days than those in the observed lactation curve. Torshizi et al. (Citation2011) also found a similar result for Holsteins using Wood’s nonlinear model. Although there are limitations in the Wood’s model, one of its main advantage is the fact that it may fit the lactation curves of cows with atypical shapes (Dijkstra et al. Citation2010).
The estimate mean of PY and TMY differed between genetic models and groups ( and 6). Overall, the models that best estimated the PY were WDnlin and ASH. The latter one estimated the values of TMY for 1/2H, 3/4H, 7/8H and G with higher precision, whose range were closer to the observed values (). It could be due to the fact that the models with higher number of parameters have a better performance in the quality of fit (Steri et al. Citation2009).
Regardless of the model, the highest mean values of PY and TMY were obtained for group H, followed by group 1/2H, with positive association between PY and TMY. Hossein-Zadeh (Citation2016) reported that cows with high peak yields also present high 305-day milk yields compared to cows with low peak yields. However, such an association is not perfect, which could allow the selection for cows with lower peak yields and high 305-day milk yields. Thus the selection of cows could be based on the peak yields (Hossein-Zadeh, Citation2014). On the other hand, the selection should be combined in an index that could take into account peak yield and 305-day milk yields with other selected traits.
WDlin model presented the lowest estimates of PY, which could be associated to the lowest values estimated for TMY. According to Prasad (Citation2003), Wood’s nonlinear model tend to underestimate the peak yields. Similarly, Torshizi et al. (Citation2011) indicated that Wood’s nonlinear model presented a better fit of the lactation curves of Holstein cows than the linear model. According to Pollott and Gootwine (Citation2000), nonlinear functions present a better fit than their linear equivalent.
For WL and ASH models, the time to peak yield increased with the increase in the proportion of Holstein genes. Some studies showed the Holstein breed can reach the peak yield around 90 days in milk (Cobuci et al. Citation2004; Torshizi et al. Citation2011), while Gyr breed can reach the peak around 60 days in milk (Herrera et al. Citation2008). However, the time to peak estimated by WDnlin and WDlin, presented higher variation between genetic groups. Such a variation in the day of peak milk yield for the different genetic groups can be attributed to the choise of the model or function, and the smaller number of test-day records that influenced the shape of the lactation curve (Oliveira et al. Citation2007; Glória et al. Citation2010; Torshizi et al. Citation2011).
Persistency of milk yield was the parameter describing the course of lactation curve that presented the lowest variation between models and genetic groups. Persistency can be defined as the ability of the cow to maintain milk yield after achieving the maximum milk production (Hickson et al. Citation2006). Thus such an ability of maintaining a similar level of production along days in milk with low peak yields may dilute the costs of production along time (food and management costs) and decrease the health treatments caused by metabolic disorders (Hossein-Zadeh, Citation2014; Hossein-Zadeh, Citation2016). Additionally, the welfare of cows is improved as a result of the increase of persistency (Cole and VanRaden Citation2006).
In general, the persistency measures estimated by WDnlin and WL showed that the most persistent lactation curves were for H group, which also presented the highest level of production among genetic groups. That result was corroborated by Gengler (Citation1996), which reported that persistency was associated to the level of production. However, the estimates of persistency by linear models (WDlin and ASH) were more persistent for G group. In the estimates of ASH model, the results for persistency may be occurred because of the highest estimates of PT for G group compared to H group as well as the high correlation between persistency and PT (Albarran-Portillo and Pollott Citation2011). Thus it suggests that peak yields that occur later are associated to more persistent lactation curves.
Many studies have revealed that there is an interest of heterosis effect on milk yield (Norberg et al. Citation2014; Lembeye et al. Citation2015). In Brazil, the effect of heterosis has been indicated as the most important aspect of milk yield in the different genetic groups of the Girolando cattle (Facó et al. Citation2005; Facó et al. Citation2008). However, there is a lack of studies evaluating the effect of heterosis in Girolando cows, especially in regard to aspects associated to the shape of the lactation curve.
Between the nonlinear models, WL model was chosen in order to estimate the effect of heterosis for cows of different Girolando breed groups, whose choice was based on the quality of fit criteria and the shape of lactation curves. Additionally, the goodness of fit of groups with the largest number of animals (1/2H, 5/8H, 7/8H, G e H) was higher for WL compared to WDnlin.
Thus the heterosis effect was significant (P < .001) for PY, TMY and the ‘a’ parameter of WL model. The heterosis effect of ‘a’, PY and TMY were 4.51, 4.59, and 809.77 kg, which represent 23.05%, 20.60%, and 14.64% larger yield values than the mean between parental breeds, respectively. In fact, the magnitude of heterosis depends on the degree of genetic dominance of the trait, but it is also related to the genetic distance between the parental breeds, so that, in general, the higher the genetic distance, the higher the heterosis effects (Mäki-Tanila Citation2007).
Several studies investigated the effect of heterosis on milk yield in different crossbred animals that involved the Holstein breed. Akbas et al. (Citation1993) and Boichard et al. (Citation1993) reported heterosis effect of 135 and 104 kg of milk yield in Holstein x French Black and White cattle and Holstein and European Friesian crossbred cows, respectively. Recently, Penasa et al. (Citation2010) and López-Villalobos et al. (Citation2010) found heterosis effect of 477 and 496 kg more milk yield in Holstein x Jersey crossbred cows than the average of milk yield of pure breeds.
The results of heterosis effect for initial production (‘a’ parameter), PY, and TMY indicated that cows that had heterosis effect for initial production also presented higher 305-day milk yield. One of the factors that may have influenced the heterosis effect of TMY was the fact that ‘a’ parameter could be associated to the level of production (Wilmink Citation1987). Another factor is that PY and TMY were positively associated, once the results showed that cows with higher PY also presented higher TMY (). Several previous studies have reported that there is a genetic correlation between PY and TMY, ranging from 0.82–0.90 in Holstein cows (Shanks et al. Citation1981; Rekaya et al. Citation2000). Similarly, Buckley et al. (Citation2003) found that cows with the highest peak milk yield were those with the highest 305-day milk yield. The results of the heterosis effect found for initial production (parameter ‘a’), PY and TMY may also indicate the adaptation of the Girolando cows to the environmental conditions of Brazil. In this case, the term adaptation should be considered in a broad sense because the genes expressed in the Girolando genotypes provided the best performance of those animals (McManus et al. Citation2008).
Many studies have reported that the environmental causes an effect on the expression of heterosis (Bryant et al. Citation2007; Penasa et al. Citation2010). That possibility could be a factor that may have influenced (or at least could explain) the higher heterosis expression of Girolando cows for initial production (parameter ‘a’), PY and TMY. On the other hand, the ‘c’ parameter from WL model did not present a significant effect of heterosis. It is known that ‘c’ parameter is associated to the increase in the milk yield up to the peak yield (Wilmink Citation1987). That result permitted to infer that the effect of heterosis in PY was independent of the effect of heterosis in parameter ‘c’, both components associated with the initial phase of the lactation curve. There was also no effect of heterosis for parameter ‘b’ in cows of different genetic groups of the Girolando breed. The ‘b’ parameter is associated to the decrease of milk yield after peak yield (Wilmink Citation1987), which may be directly associated to the persistency of milk yield.
Similarly, most of the persistency measures (P3:1, P3:2 and Pweller) did not show heterosis effect (P > .05), indicating that cows from the different Girolando genetic groups had less persistent lactations when compared to the mean persistency of the parental breeds (H and G). Thus, the absence of heterosis effect on ‘b’ parameter was associated to the absence of heterosis effect on the different persistency measures (P3:1, P3:2 and Pweller), because all represent the same component of the lactation curve (persistency in milk production). Another factor that may have influenced the absence of the heterosis effect in the different measurements of persistency was the small effect of heterosis in PT in this study.
Němečková et al. (Citation2015) estimated a genetic correlation of 0.54 ± 0.07 between the day of peak and persistency in Holstein cows. In contrast, a significant heterosis effect (P < .05) was found for P2:1 in Girolando cows, although with no expressive effect (2.56%) when compared to the mean persistency of parental breeds (H and G). Part of the explanation could be attributed to the fact that the initial production (‘a’ parameter) presented positive heterosis effect. It is known that the level of the initial stage of the lactation curve influences the cow’s ability to maintain milk yield after the peak of milk yield (Wood Citation1967). It is worth mentioning that P2:1 is the measure more associated to the first two stages or parts of lactation because the lactation has been divided in three parts when persistency had been calculated. It could explain the heterosis effect on that persistency measure. Therefore, the higher heterosis effect was found for the initial stage of milk yield (parameter ‘a’ of WL model), followed by PY and TMY. The significant effect of heterosis on TMY is commonly expected due to the genetic distance between Holstein breed (Bos taurus taurus) and Gyr (Bos taurus indicus).
However, the most important benefit of the heterosis effect obtained in this type of crossing may be due to the effect of heterosis on the components of the curve which were associated mainly with initial stage of milk yield and milk yield at the peak and with a lesser extent with the two final stages (persistency). The heterosis effect in the first stages of lactation is the most important benefit of crossbreeding in the adaptation of dairy cattle in the tropical conditions of many countries as Brazil. Farmers with animals more adapted to their environment are more competitive due to the lower costs with labour, feed and higher productivity (López-Villalobos et al. Citation2000; McManus et al. Citation2008).
5. Conclusions
The quality of fit of the mathematical models was different for all the different models and genetic groups. Based on the criteria of goodness of fit, the results of this study showed that WL provided the best fit of lactation curve for most genetic groups between nonlinear models. In regard to the linear models, WDlin provides a better adjustment of the lactation curve for the crossbred genetic groups of cows. The crossbreeding between Holstein and Gyr breeds may bring many benefits for the producers, since the cows from the different crosses between them present heterosis higher than 14% for 305-day milk yield. The heterosis effect is more associated to the initial stage of lactation curve and the peak yield.
Acknowledgements
We would like to thank Associação dos Criadores de Gado Holandês de Minas Gerais (ACGHMG), Associação Brasileira dos Criadores de Gir Leiteiro (ABCGIL), Associação Brasiliera de Girolando (ABCG) and EMBRAPA Gado de Leite for providing the valuable data.
Disclosure statement
No potential conflict of interest was reported by the authors.
ORCID
Darlene dos Santos Daltro http://orcid.org/0000-0003-2278-8129
Marcos Vinícius Gualberto Barbosa da Silva http://orcid.org/0000-0001-5449-1413
Luís Telo da Gama http://orcid.org/0000-0003-3894-3488
Jaime Araujo Cobuci http://orcid.org/0000-0002-1414-4967
Additional information
Funding
References
- Akbas Y , Brotherstone S , Hill WG. 1993. Animal model estimation of non-additive genetic parameters in dairy cattle, and their effect on heritability estimation and breeding value prediction. J Anim Breed Genet. 110:105–113. doi: 10.1111/j.1439-0388.1993.tb00721.x
- Albarran-Portillo B , Pollott GE. 2011. Environmental factors affecting lactation curve parameters in the United Kingdom’s commercial dairy herds. Arch med vet. 43:145–153. doi: 10.4067/S0301-732X2011000200007
- Ali TE , Schaeffer LR. 1987. Accounting for covariances among test day milk yields in dairy cows. Can J Anim Sci. 67:637–644. doi: 10.4141/cjas87-067
- Boichard D , Bonaiti B , Barbat A. 1993. Effect of Holstein crossbreeding in the French Black and White cattle Population. J Dairy Sci. 76:1157–1162. doi: 10.3168/jds.S0022-0302(93)77444-5
- Bryant JR , López-Villalobos N , Pryce JE , Holsmes CW , Johnson DL , Garrick DJ. 2007. Effect of environment on the expression of breed and heterosis effects for production traits. J Dairy Sci. 90:1548–1553. doi: 10.3168/jds.S0022-0302(07)71640-5
- Buckley F , O’Sullivan K , Mee JF , Evans RD , Dillon P. 2003. Relationships among milk yield, body condition, cow weight, and reproduction in spring-calves Holstein-Friesians. J Dairy Sci. 86:2308–2319. doi: 10.3168/jds.S0022-0302(03)73823-5
- Burnham KP , Anderson DR. 2002. Model selection and multimodel inference: a practical-theoretic approach, 2nd ed. Berlin : Springer-Verlag.
- Canaza-Cayo AW , Lopes PS , Silva MVGB , Cobuci JA , Torres RA , Martins MF , Arbex WA. 2014. Estrutura populacional da raça Girolando. Cienc Rural. 44:2072–2077. doi: 10.1590/0103-8478cr20131307
- Cobuci JA , Costa CN , Braccini Neto J , Freitas AF. 2011. Genetic parameters for milk production by using random regression models with different alternatives of fixed regression modeling. Rev Bras Zootec. 40:557–567. doi: 10.1590/S1516-35982011000300013
- Cobuci JA , Euclydes RF , Costa CN , Lopes PS , Torres RA , Pereira CS. 2004. Análises da Persistência na Lactação de Vacas da Raça Holandesa, Usando Produção no Dia do Controle e Modelo de Regressão Aleatória. Rev Bras Zootec. 33:546–554. doi: 10.1590/S1516-35982004000300004
- Cole JB , Van Raden PM. 2006. Genetic evaluation and best prediction of lactation persistency. J Dairy Sci. 89:2722–2728. doi: 10.3168/jds.S0022-0302(06)72348-7
- Cunningham EP , Syrstad O. 1987. Crossbreeding bos indicus and bos taurus for milk production in the tropics. FAO, Rome.
- Dickerson GE. 1973. Inbreeding and heterosis in animals. In: Animal Breeding and Genetics Symposium in Honour of Dr. J. L. Lush, 1973, Champaign. Champaign, IL: American Society of Animal Science, 1973. p.54–77.
- Dijkstra J , Lopez S , Bannink A , Dhanoa M , Kebreab E , Odongo N , Fathi Nasri MH , Behera UK , Hernandez-Ferrer D , France J. 2010. Evaluation of a mechanistic lactation model using cow, goat and sheep data. J Agric Sci. 148:249–262. doi: 10.1017/S0021859609990578
- Şeahin A , Ulutaş Z , Arda Y , Yüksel A , Serdar G. 2015. Lactation curve and persistency of Anatolian Buffaloes. Ital J Anim Sci. 14:150–157. doi: 10.4081/ijas.2015.3679
- Facó O , Lôbo RNB , Martins Filho R , Lima FAM. 2005. Idade ao Primeiro Parto e Intervalo de Partos de Cinco Grupos Genéticos Holandês x Gyr no Brasil. R Bras Zootec. 34:1920–1926. doi: 10.1590/S1516-35982005000600016
- Facó O , Lôbo RNB , Martins Filho R , Martins GA , Oliveira SMP , Azevêdo DMMR. 2008. Efeitos genéticos aditivos e não-aditivos para características produtivas e reprodutivas em vacas mestiças Holandês × Gyr. Rev Bras Zootec. 37:48–53. doi: 10.1590/S1516-35982008000100006
- García SC , Holmes CW. 2001. Lactation curves of autumn- and spring calved cows in pasture-based dairy systems. Livest Prod Sci. 68:189–203. doi: 10.1016/S0301-6226(00)00237-2
- Gengler N. 1996. Persistency of lactation yields: a review. Interbull Bulletin. 12:97–102.
- Glória JR , Bergmann JAG , Quirino CR , Ruas JRM , Matos CRA , Pereira JCC. 2010. Curvas de lactação de quatro grupos genéticos de mestiças Holandês-Zebu. R Bras Zootec. 39:2160–2165. doi: 10.1590/S1516-35982010001000009
- Herrera LGG , El Faro L , Albuquerque LG , Humberto T , Machado CHC. 2008. Estimativas de parâmetros genéticos para produção de leite e persistência da lactação em vacas Gyr, aplicando modelos de regressão aleatória. Rev Bras Zootec. 37:1584–1594. doi: 10.1590/S1516-35982008000900009
- Hickson RE , Morris ST , Kenyon PR , López-Villalobos N. 2006. Dystocia in beef heifers: a review of genetic and nutritional influences. N Z Vet J. 54:256–264. doi: 10.1080/00480169.2006.36708
- Hossein-Zadeh GN. 2014. Comparison of non-linear models to describe the lactation curves of milk yield and composition in Iranian Holsteins. J Agric Sci. 152:309–324. doi: 10.1017/S0021859613000415
- Hossein-Zadeh GN. 2016. Modelling lactation curve for fat to protein ratio in Holstein cows. Anim Sci Pap Rep. 34:233–246.
- Hossein-Zadeh GN. 2017. Application of growth models to describe the lactation curves for test-day milk production in Holstein cows. J Appl Anim Res. 45:145–151. doi: 10.1080/09712119.2015.1124336
- Jamrozik J , Kistemaker GJ , Dekkers JCM , Schaeffer LR. 1997. Comparison of possible covariates for use in a random regression model for analyses of test day yields. J Dairy Sci. 80:2550–2556. doi: 10.3168/jds.S0022-0302(97)76210-6
- Jeretina J , Babnik D , Škorjanc D. 2015. Prediction of standard lactation curves for primiparous Holstein cows by using Corrected regression models. Ital J Anim Sci. 14:628–633. doi: 10.4081/ijas.2015.3776
- Johansson I , Hansson A. 1940. Causes of variation in milk and butterfat yield of dairy cows. Kungliga Lantbruksakademiens Tidskrift. 79:1–127.
- Khan MKI , Blair HT , López-Villalobos N. 2012. Lactation curves of different cattle breeds under cooperative dairying conditions in Bangladesh. J Appl Anim Res. 40:179–185. doi: 10.1080/09712119.2011.645039
- Lembeye F , Lopéz-Villalobos N , Burke JL , Davis SR. 2015. Estimation of breed and heterosis effects for milk traits and somatic cell scores in cows milked once and twice daily in New Zealand. Proc N Z Soc Anim Prod. 75:60–63.
- López-Villalobos N , Garrick DJ , Holmes CW , Blair HT , Spelman RJ. 2000. Genetics and breeding. J Dairy Sci. 83:144–153. doi: 10.3168/jds.S0022-0302(00)74865-X
- López-Villalobos N , Penasa M , Dal Zotto R , et al. 2010. Calculation of a cow culling merit index including specific heterosis in a multibreed dairy population. Archiv Tierzucht. 53:9–17.
- Macciotta NPP , Dimauro C , Rassu SPGSteri R , Pulina G. 2011. The mathematical description of lactation curves in dairy cattle. Ital J Anim Sci. 10:213–223. doi: 10.4081/ijas.2011.e51
- Macciotta NPP , Vicario DA. 2005. Detection of different shapes of lactation curve for milk yield in dairy cattle by empirical mathematical models. J Dairy Sci. 88:1178–1191. doi: 10.3168/jds.S0022-0302(05)72784-3
- Mäki-Tanila A. 2007. An overview on quantitative and genomic tools for utilizing dominance genetic variation in improving animal production. Agric Food Sci. 16:188–198. doi: 10.2137/145960607782219337
- McManus C , Teixeira RA , Dias LT , Louvandini H , Oliveira EMB. 2008. Características produtivas e reprodutivas de vacas Holandesas e mestiças Holandês × Gyr no Planalto Central. Rev Bras Zootec. 37:819–823. doi: 10.1590/S1516-35982008000500006
- Němečková D , Stádník L , Čítek J. 2015. Associations between milk production level, calving interval length, lactation curve parameters and economic results in Holstein cows. Mljekarstvo. 65:243–250.
- Norberg E , Sørensen LH , Byskov K , Kargo, M. 2014. Heterosis and breed effects for milk production, Udder health and fertility in Danish herds applying systematic crossbreeding. Proceedings 10th World Congress of Genetics applied to Livestock production. Vancouver, Canada, 836.
- Oliveira HTV , Reis RB , Glória JR , Quirino CR , Pereira JCC. 2007. Curvas de lactação de vacas F1 Holandês-Gir ajustadas pela função gama incompleta. Arq Bras Med Vet Zootec. 59:233–238. doi: 10.1590/S0102-09352007000100037
- Olori VE , Brotherstone S , Hill WG , McGuirk BJ. 1999. Fit of standard models of the lactation curve to weekly records of milk production of cows in a single herd. Livest Prod. 58:55–63. doi: 10.1016/S0301-6226(98)00194-8
- Penasa M , De Marchi M , Dal Zotto R , De Jong G , Bittante G , Cassandro M. 2010. Heterosis effects in a black and white dairy cattle population under different production environments. Livest. Sci. 131:52–57. doi: 10.1016/j.livsci.2010.02.027
- Pereira MA , Menezes ML , Oliveira VS , Lima MS , Carvalho CTG , Santos ADF. 2016. Curvas de Lactação de Fêmeas Mestiças Taurino x Zebu. Bol Ind Anim. 73:118–126. doi: 10.17523/bia.v73n2p118
- Pollott G , Gootwine E. 2000. Appropriate mathematical models for describing the complete lactation of dairy sheep. Anim Sci. 71:197–207. doi: 10.1017/S1357729800055028
- Prasad S. 2003. Modeling of lactation curves of dairy animals. J. Appl. Anim. Res. 24:79–84. doi: 10.1080/09712119.2003.9706437
- Prata MA , Vercesi Filho AE , El Faro L , Verneque RS , Panetto JCC , Cardoso VL , Fernades AR. 2015. Objetivos de seleção para características de produção e qualidade do leite para raça Gyr leiteiro. Informe Agropecuário. 36:41–50.
- Rege JEO. 1998. Utilization of exotic germplasm for milk production in the tropics. Proceedings of the 6th World Congress on Genetics applied to Livestock production. Armidale. 25, p. 193–200.
- Rekaya R , Carabano MJ , Toro MA. 2000. Bayesian analysis of lactation curves of Holstein-Friesian cattle using a nonlinear model. J. Dairy Sci. 83:2691–2701. doi: 10.3168/jds.S0022-0302(00)75163-0
- Shanks RD , Berger PJ , Freeman AE , Dickinson FN. 1981. Genetic aspects of lactation curves. J Dairy Sci. 64:1852–1860. doi: 10.3168/jds.S0022-0302(81)82775-0
- Silva MVGB , Canazo-Cayo AW , Lopes OS , Cobuci JA , Martins MF , Paiva LC , Cembranelli MAR , Ferreira MBD , Panetto JCC. 2015. Programa de Melhoramento Genético da Raça Girolando: do teste de progênie às avaliações genômicas. Inf Agropec. 36:35–40.
- Silvestre AM , Petim-Batista F , Colaco J. 2006. The accuracy of seven mathematical functions in modeling dairy cattle lactation curves based on test-day records from varying sample schemes. J Dairy Sci. 89:1813–1821. doi: 10.3168/jds.S0022-0302(06)72250-0
- Steri R , Cappio-Borlino A , Macciotta NPP. 2009. Modelling extended lactation curves for milk production traits in Italian Holsteins. Ital J Anim Sci. 8:165–167. doi: 10.4081/ijas.2009.s2.165
- Torshizi M , Aslamenejad AA , Nassiri MR , Farhangfar H. 2011. Comparison and evaluation of mathematical lactation curve functions of Iranian primiparous Holsteins. S Afr J Anim Sci. 41:104–115.
- Vargas B , Koops WJ , Herrero M , Van Arendonk JAM. 2000. Modeling extended lactations of dairy cows. J Dairy Sci. 83:1371–1380. doi: 10.3168/jds.S0022-0302(00)75005-3
- Vinay-Vadillo JC , Villagómez-Cortés JÁ , Acosta-Rodriguez MR , Rocher C. 2012. Shapes of lactation curves of F1 (Holstein X Zebu) cows in the humid tropic of Veracruz. Mexico. Int J Anim Vet Adv. 4:370–377.
- Weller JI , Ezra E , Leitner G. 2006. Genetic analysis of persistency in the Israeli Holstein population by the multitrait animal model. J Dairy Sci. 89:2738–2746. doi: 10.3168/jds.S0022-0302(06)72350-5
- Wilmink JBM. 1987. Adjustment of test-day milk, fat and protein yields for age, season and stage of lactation. Livest. Sci. 16:335–348. doi: 10.1016/0301-6226(87)90003-0
- Wood PDP. 1967. Algebraic model of the lactation curve in cattle. Nature. 216:164–165. doi: 10.1038/216164a0