
ABSTRACT
The geographical origin of mud crab (Scylla paramamosain) has been arousing increasing interest to consumers due to their flavour and market price. In this study, an NMR-based metabolomics method was used to characterize the differences in the chemical composition of muscle samples of mud crabs caught in four different geographical areas of China. The results showed that a statistically significant separation existed between each of the groups of mud crabs in terms of their geographical origins. The major metabolites responsible for differentiation included inosine 5’-monophosphate (IMP), adenosine 5’-monophosphate (AMP), and some amino acids. A gradual increase in the AMP level in conjunction with a declining IMP level was closely associated with the growth latitude of the mud crab, which means that these metabolites could potentially be used to characterize the specific geographic origin of mud crabs. This information might be useful for assessing the quality of mud crabs from different geographical origins.
Introduction
Foodomics is broadly defined as a global and integrative strategy to bring about ‘precision nutrition’ and holistic studies of food composition, quality and safety, and their applications to improve health for humans, animals, and other living organisms on the planet under an ethos of ‘One Health’ (Bayram and Gökırmaklı Citation2018). In such cases, a comprehensive analysis of food nutritional composition becomes a particularly useful approach for food authentication at the molecular level. Currently, nuclear magnetic resonance (NMR) spectroscopy and chromatography-mass spectrometry are two main-stream analytical technologies used for food authentication (Wishart Citation2008). In spite of low sensitivity in comparison to mass spectrometry (MS), an NMR-based metabolomics method has still generated great interest for the intrinsical reproducibility with rich structure information and quantitation of all abundant primary and secondary metabolites of foods in a single spectrum (Nicholson et al. Citation1999; Tang and Wang Citation2006). Such a method has been successfully applied in the discrimination of geographical origin of a variety of foods such as salmon fillets (Aursand et al. Citation2009; Ørnholt-Johansson et al. Citation2017), beef (Jung et al. Citation2010), fruits (Longobardi et al. Citation2013; Tomita et al. Citation2015), and plants (Kim et al. Citation2013; Longobardi et al. Citation2017).
The mud crab (Scylla paramamosain Estampador, 1949) (Decapoda: Portunidae) is a commercially important species of Scylla with a yield of 148,977 tons in 2016 (Yearbook Citation2017). Scylla paramamosain is naturally distributed along the southeastern coastal regions of China mainly from Jiangsu Province to Hainan Province (Ma et al. Citation2013). Consumers are more and more orientated towards purchasing the mud crabs caught in some regions. Therefore, these mud crabs are priced higher than those caught in other regions. In general, consumers, fishermen, and dealers use differences in colour to determine the geographical origin of the mud crab. The carapaces of mud crabs tend to become lighter in colour moving from the South to the North. However, the colour is not enough to determine the geographical origin of mud crab. Thus, more morphological differences are needed to differentiate mud crabs with different geographical origins. In fact, 22 morphometric characters have been used to discriminate five different morphs of male Scylla serrata from four locations in three Asian countries (Overton et al. Citation1997). However, within these five morphs, Surat Thani ‘white’ crabs cannot be differentiated from Vietnam crabs and Ranong crabs cannot be differentiated from Sarawak crabs. In this case, their morphological features are not sufficient for the geographical origin discrimination of S. serrata. In addition, DNA barcoding has been proved to be a powerful method to detect differences among species of mud crab (Segura-Garcıa et al. Citation2018) or identify a broad range of other marine organisms (Geller et al. Citation2013). The nuclear and mitochondrial DNA markers also provide a successful application in the inter-species identification of genus Scylla (Sarower et al. Citation2016). However, there is no evidence to show that these methods can be used to detect the difference in the same species of mud crab. Although an NMR-based metabolomics method has not been applied in the discrimination of geographical origin of crab so far, it is worthy to note that such analytical method has been acknowledged as accurate, rapid, and reliable for using metabolites to characterize the geographic origin of foods. For example, the levels of some amino acids, theanine, epicatechin, epicatechin-3-gallage, caffeine, sucrose, and glucose were significantly different in the green tea from China and Korea (Lee et al. Citation2015). Moreover, l-rhamnitol is regarded as a potential metabolic marker in apples from different geographic origins (Tomita et al. Citation2015). In addition, the NMR-based metabolomics method has also been successfully applied in the assessment of the quality of crab (Zotti et al. Citation2016) and crab paste (Ye et al. Citation2012).
In this study, 1H NMR spectroscopy combined with multivariate data analysis was used for metabolomic analyses of muscle extracts from S. paramamosain collected from four locations in three provinces in the southeast coastal areas of China. The objective of this study was to compare the differences in the metabolome of the muscle of S. paramamosain from different geographical origins and identify potential metabolite candidates that can be used as differentiators.
Materials and methods
Apparatus and reagents
The NMR measurements were performed on a Bruker Avance III 600 MHz spectrometer equipped with an inverse detection cryogenic probe (Bruker Biospin, Rheinstetten, Germany). Methanol, NaH2PO4·2H2O and K2HPO4·3H2O were of analytical grade and purchased from Guoyao Chemical Co. Ltd. (Shanghai, China) all in analytical grade. Sodium 3-trimethylsilyl [2,2,3,3-2D4] propionate (TSP) and deuterated water (D2O, 99.9% in D) were purchased from Sigma-Aldrich Inc. (St. Louis, MO, USA).
Preparation of extraction solvent and phosphate buffer
Metabolite extraction solvent was an aqueous methanol (methanol/ddH2O = 2:1, v/v). Phosphate buffer (K2HPO4/NaH2PO4, 100 mM, pH 7.56), containing 50% D2O (v/v) and 0.001% TSP (w/v), was prepared in ddH2O (Xiao et al. Citation2009).
Crab collection and sample preparation
Scylla paramamosain were collected from four locations in the southeast coastal areas of China where mud crabs are mainly distributed (Lin et al. Citation2007), namely, Cixi in Zhejiang Province (30°17′ N; 121°3′ E), Sanmen in Zhejiang Province (29°2′ N; 121°37′ E), Xiapu in Fujian Province (26°46′ N; 119°58′ E), and Qinzhou in Guangxi Province (21°42′ N; 108°35′ E). Sanmen (SM), Xiapu (XP), and Qinzhou (QZ) crabs were all collected in September 2016. The collection of Cixi (CX) crabs were delayed to October 2016 for a bigger size. A total of 36 adult wild-caught mud crabs (eight crab samples from each of the four locations) were collected with 143.5 ± 101.0, 184.1 ± 109.0, 254.1 ± 89.4, and 388.8 ± 119.9 g for CX, SM, XP, and QZ crabs, respectively. These mud crabs were selected mainly due to two reasons. The first reason was that the crab was healthy and had all limbs intact. The second reason was that the crabs had a similar body weight. In this case, a different gender ratio was obtained in the four groups. Both CX and SM groups, respectively, contained four male crabs and four female crabs, whereas XP and QZ groups, respectively, contained seven male crabs and one female crab. The crabs were cooled for a few hours on ice and transported to the laboratory while assuring the maintenance of the cold chain. Subsequently, the crabs were washed using tap water, placed in polyethylene bags, and stored at −70°C for subsequent analysis.
Metabolite extraction of crab muscle
For each crab, approximately 400 mg of muscle from the last walking leg of the crab was collected manually. The muscle sample was extracted with 1 mL of a cold aqueous methanol using a tissue lyser (QIAGEN TissueLyser II, Hilden, Germany) at 20 Hz for 1.5 min. After the sample was centrifuged at 12,000 × g for 10 min, the supernatant was collected. The remaining solid residue of the sample was extracted a second time following the above procedure. The methanol in the combined supernatants was removed under vacuum. The extracts were lyophilized to reduce the residual water signal in the NMR spectra. Each dried extract was redissolved in 550 μL of phosphate buffer. After a centrifugation for 10 min at 12,000 × g, 500 μL of supernatant from each extract was transferred into a standard 5-mm NMR tube for NMR analyses.
NMR analysis
All NMR spectra were recorded at 298 K on a 600 MHz Avance spectrometer (Bruker BioSpin, Rheinstetten, Germany) using an inverse detection cryogenic probe. The one-dimensional 1H NMR spectra were acquired using a standard NOESYGPPR1D pulse sequence with 32 scans of 32,768 data points with a spectral width of 20 ppm, a recycle delay of 25 s and a mixing time of 100 ms to allow complete relaxation. Free induction decays were Fourier transformed with a line broadening of 0.5 Hz using TOPSPIN (V3.0, Bruker BioSpin, Rheinstetten, Germany). The resulting spectra were manually phased, baseline corrected, and calibrated to the chemical shift of TSP signal (δ 0.00). For signal assignment, the two-dimensional spectra were acquired on selected samples using standard acquisition parameters (Aue et al. Citation1976a; Citation1976b; Braunschweiler and Ernst Citation1983), including 1H-1H COSY, 1H-1H TOCSY, 1H J-resolved, 1H-13C HSQC and 1H-13C HMBC 2D NMR spectroscopy.
Multivariate data analysis
Prior to multivariate data analysis, the region δ 0.80–9.50 of each 1H NMR spectrum was bucketed into bins where the width of each bin is 2.4 Hz. The regions of 4.70–5.15 ppm and 3.35–3.38 ppm, associated mainly with residual water and methanol, were removed. After normalization of the integrated areas to the weight of each muscle sample, the spectral datasets were imported into SIMCA-P software (V12.0, Umetrics, Umeå, Sweden) for multivariate data analysis.
The spectral datasets were initially processed for unsupervised principal component analysis (PCA) with a mean-centred scaling to view the group clustering. Furthermore, a supervised orthogonal projection to latent structure discriminant analysis (OPLS-DA) was performed utilizing a unit variance-scaled approach to maximize the separation between two groups (Trygg and Wold Citation2002; Vandenberg et al. Citation2006). Here, component 1(t[1]P) is the predictive component and displays the between-class variation of the samples (i.e. crabs in this study). Component 2 (t[2]O) is the Y-orthogonal component and models the within group variation. The seven-fold cross validation parameters, Q2 and R2 , and a cross validation-analysis of variance (CV-ANOVA) approach (p < 0.05) (Cloarec et al. Citation2005) were used together to evaluate the quality of the OPLS-DA model. The metabolites that significantly contributed to the separation of two groups were extracted according to their own correlation coefficients (r) which were colour-coded and plotted with the back-transformed weight of the NMR variable in the coefficient plot (Eriksson et al. Citation2008). In this study, an absolute value of r above 0.666 was taken as statistically significant (p < 0.05).
Quantification analysis of metabolite
Metabolites were quantified by equating the integrals of the NMR signals (only unique protons without overlapping with the signals from other metabolite protons) of selected metabolites to the integral of protons of the three TSP methyl groups according to the method of Dai et al. (Citation2010). Such a metabolite quantification using the NMR methods has an associated error below 15%. All the obtained metabolite concentrations were subjected to one-way analysis of variance (ANOVA) using SPSS 13.0 software with the least significant difference statistic.
Results
The typical 1H NMR spectra of aqueous crab muscle extract samples from Cixi, Sanmen, Xiapu, and Qinzhou are shown in . The vertical scale of the aromatic region was expanded by a factor of 64 for better visibility. The NMR resonances signals were assigned to specific metabolites according to published data (Fan Citation1996; Fan and Lane Citation2008; Ye et al. Citation2014). Signal assignments were further confirmed based on the extensive 2D NMR analysis including 1H-1H COSY, 1H-1H TOCSY, 1H J-resolved, 1H-13C HSQC and 1H-13C HMBC 2D NMR spectroscopy. The 1H and 13C data of the assigned to individual metabolites are listed in . A total of 21 metabolites were identified and comprised a range of amino acids, organic acids, nucleotides, betaine, trimethylamine-N-oxide (TMAO), glucose, 2-pyridinemethanol, trigonelline, and an unidentified compound U1. Differences in the intensities of some NMR signals were observed by visual inspection in the overall spectroscopic profiles of the crab samples from the four geographical areas. For example, the peak intensities in the aromatic region varied between crab samples from different geographical origins. However, more differences in the metabolite compositions can be identified by multivariate data analysis.
Figure 1. Typical 1H NMR spectra of muscle extracts of S. paramamosain collected from Cixi (CX), Sanmen (SM), Xiapu (XP), and Qinzhou (QZ). The dotted regions were vertically expanded by a factor 64 relative to the δ 4.7–0.9 regions. Lac: lactate; Ala: alanine; Glu: glutamate; Gln: glutamine; Bet: betaine; Arg: arginine; TMAO: trimethylamine-N-oxide; Tau: taurine; Gly: glycine; α-Glc: α-Glucose; Fum: fumarate; HQ: hydroquinone; Tyr: tyrosine; Phe: phenylalanine; His: histidine; Ino: inosine; IMP: inosine 5’-monophosphate; AMP: adenosine 5’-monophosphate; PM: 2-pyridinemethanol; Tri: trigonelline; MeOH: methanol; U1: unidentified signal 1.
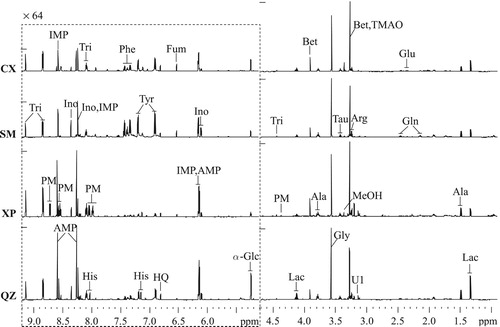
Table 1. 1H and 13C NMR data and assignments of the metabolites in muscle extracts of S. paramamosain.
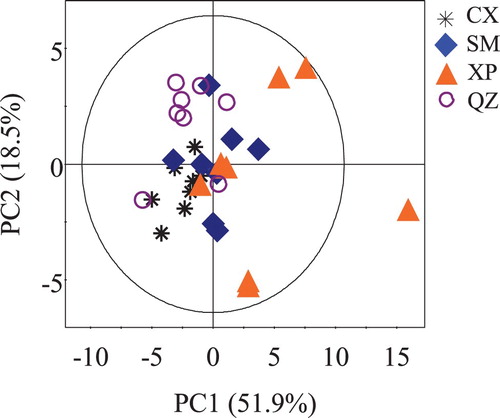
PCA was initially performed on all the normalized 1H NMR data to determine if the common NMR variables can be used to differentiate the crab samples based on their different geographical origins. The resulting scores plot based on the first two principal components together explained 70.4% of the total variance (). No obvious separation was observed among these four crab samples; however, a trend in the separation was observed among these four crab groups from different locations. Thus, a supervised OPLS-DA was performed to discriminate crab groups using a pair wise comparison.
Figure 2. PCA scores plot of the muscle extracts of S. paramamosain collected from Cixi (black stars), Sanmen (blue diamonds), Xiapu (orange triangles), and Qinzhou (purple circles).
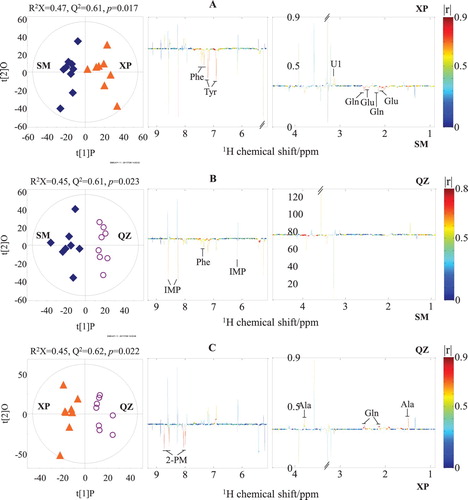
A total of six OPLS-DA models were constructed from the 1H NMR data of the four crab groups. The generated Q 2 values from these OPLS-DA models ranged from 0.61 to 0.87 (, left; , left). The validities of these models were further confirmed by a CV-ANOVA approach, and they were all found to have p-values smaller than 0.05. These results indicated that the separation between each two groups of mud crabs in terms of their geographical origin in the OPLS1 was statistically significant. The OPLS-DA results also indicated that the differences in muscle metabolic profiling between two groups substantially resulted from the different geographical origins, rather than different crab genders. Then, statistically significant NMR signals associated with different geographical origins could be further selected from the coefficient plots (, right; , right). The coefficient plot of CX and SM ((A), right) shows that CX crabs were higher in fumarate. In contrast, SM crabs were higher in glutamine and U1. In (B) (right), fumarate was higher in CX crabs, whereas U1, TMAO, 2-pyridinemethanol, and AMP were higher in XP crabs. In (C) (right), AMP was higher in QZ crabs than it was in CX crabs. Compared to SM crabs, XP crabs had a higher level of U1 but lower levels of glutamate, glutamine, tyrosine and phenylalanine (A, right). QZ crabs had a higher level of phenylalanine but lower level of IMP ((B), right). Moreover, QZ crabs had higher contents of alanine and glutamine, but a lower content of 2-pyridinemethanol than XP crabs ((C), right).
Figure 3. OPLS-DA scores (left) and coefficient-coded loadings plots (right) for the models discriminating extracts of Cixi crabs (CX, black stars) from the extracts of crabs from Sanmen (SM, blue diamonds, A), Xiapu (XP, orange triangles, B), and Qinzhou (QZ, purple circles, C). Gln: glutamine; Fum: fumarate; TMAO: trimethylamine-N-oxide; AMP: adenosine 5’-monophosphate; 2-PM: 2-pyridinemethanol; U1: unidentified signal 1.
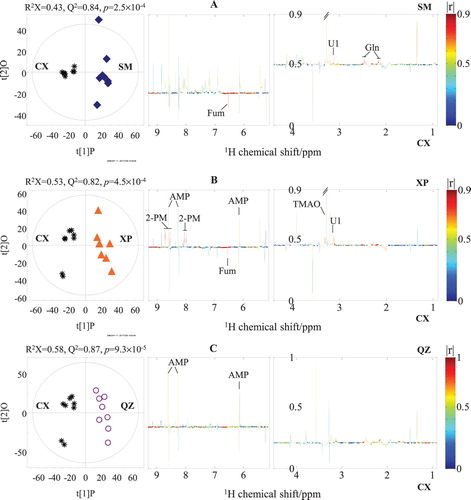
Figure 4. OPLS-DA scores (left) and coefficient-coded loadings plots (right) for the models discriminating the extracts of Sanmen crabs (SM, black stars, A), Xiapu crabs (XP, orange triangles, B), and Qinzhou crabs (QZ, purple circles, C). Ala: alanine; Glu: glutamate; Gln: glutamine; Tyr: tyrosine; Phe: phenylalanine; IMP: inosine 5’-monophosphate; 2-PM: 2-pyridinemethanol; U1: unidentified signal 1.
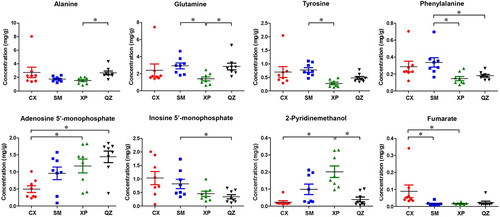
shows the scatter plots of the semi-quantitative contents of the eight metabolites that changed significantly in the OPLS-DA results. Among the four crab groups, CX crabs had the highest levels of alanine and fumarate but the lowest levels of AMP and 2-pyridinemethanol; SM crabs had the highest levels of glutamine, tyrosine, and phenylalanine; XP crabs had the highest level of 2-pyridinemethanol but the lowest levels of alanine, glutamine, tyrosine, and phenylalanine; QZ crabs had the highest level of AMP but the lowest level of IMP.
Figure 5. Content of selected significantly changed metabolites identified from the muscle extracts of S. paramamosain collected from Cixi (CX), Sanmen (SM), Xiapu (XP), and Qinzhou (QZ). Data are given as the average concentration (mg/g crab muscle) and standard deviation obtained from eight parallel samples. Significant differences were obtained by one-way ANOVA. *p < 0.05.
Discussions
Our results revealed that OPLS-DA method is useful to discriminate the geographical origin of mud crab. The OPLS-DA results further elucidate the significantly changed metabolites contributing to the variance for differentiating mud crabs according to their geographical origins. The metabolite indexes are objective and could be more reliable than the morphological features in the discrimination of geographical origin of mud crab. There is increasing evidence to show that metabolites are useful for characterizing the geographic origin of the same type food such as pistachios (Sciubba et al. Citation2014), apple (Tomita et al. Citation2015), and salmon fillets (Aursand et al. Citation2009; Ørnholt-Johansson et al. Citation2017).
In detail, we observed a gradual increase in the level of AMP coupled with a gradual decrease in the level of IMP in the muscle of mud crab when the latitude of the geographical origin of mud crab declines. The increased AMP levels stimulate AMP-activated protein kinase activity, resulting in an increased ATP production (Andris and Leo Citation2015). It is likely that mud crabs at lower latitudes need more ATP to adapt to the rising temperature and precipitation levels. IMP and AMP can be interconverted by the purine nucleotide cycle. The elevated AMP levels in conjunction with the decreased IMP levels seem to indicate that the interconversion of these two nucleotides occurs in the mud crab muscle. Furthermore, IMP can enhance the growth, immune response, and stress resistance of fish (Song et al. Citation2012; Hossain et al. Citation2016), and fumarate is an intermediate in the citric acid cycle. The elevated IMP and fumarate levels in Cixi crabs probably indicate greater citric acid cycle activity and growth in those mud crabs than other crabs at the time of harvest.
Regarding the taste, IMP and AMP both provide an umami taste with similar taste activity values (greater than one) in crab meat (Chen and Zhang Citation2007). Furthermore, these two nucleotides can interact synergistically to create an umami taste in food (Fuke and Ueda Citation1996). Therefore, IMP and AMP may both have significant impacts on the flavour of the crab meat. Here, QZ crabs had the highest concentration of AMP (1.44 ± 0.48 mg/g) and the lowest concentration of IMP (0.34 ± 0.22 mg/g). Conversely, CX crabs had the highest concentration of IMP (1.03 ± 0.69) and the lowest concentration of AMP (0.50 ± 0.28 mg/g). Except for the lowest concentration of IMP (QZ crabs) and the lowest concentration of AMP (CX crabs), the other three concentrations of each of these two flavour producing nucleotides in mud crabs are all higher than the levels found in Chinese mitten crab (Eriocheir sinensis) (Chen and Zhang Citation2007). Moreover, the concentrations of IMP and AMP in mud crab were all significantly higher than those in snow crab (Hayashi et al. Citation1981). Therefore, mud crab probably has a stronger umami taste than Chinese mitten crab and snow crab.
We also noted that SM crabs had the highest levels of glutamine, tyrosine, and phenylalanine out of the four crab groups. Glutamine is a tasteless amino acid, whereas tyrosine and phenylalanine taste bitter. However, tyrosine and phenylalanine have been found to significantly enhance the umami taste of soy sauce (Lioe et al. Citation2004) and might play an active role in the umami taste of Chinese mitten crab meat (Chen and Zhang Citation2007). Therefore, SM crabs may have a stronger umami taste than the other three crabs. From a nutritional point of view, phenylalanine is an essential amino acid, whereas glutamine and tyrosine are considered conditionally essential in the human diet. Thus, SM crabs may have a higher nutritive value than other crabs.
Such differences in the metabolite level due to the different geographical origins have been detected in the Chinese mitten crabs (CMCs, E. sinensis). The tasty amino acids, AMP, and lactic acid content in tissues of CMCs significantly differed between the two habitats including Yangcheng Lake and Gucheng Lake (Tao et al. Citation2018). The reasons which caused considerable variability among mud crab samples from different regions ought to be complex. Possible reasons for such changes can be found in the literature. For example, levels of the flavour metabolites in the edible tissues of CMCs differed significantly as a function of the intestinal microbiome (Tao et al. Citation2018). The intestinal microbiome also differed significantly probably due to the different growth regions with the different environmental factors such as temperature, rainfall, and diet in the crab growth regions. Although no public environmental pollution issue was reported on these four regions, the variations of such confounding environmental parameters should have significant effects on crab metabolism. However, these factors cannot be fully elucidated in this paper and need to be studied in the future.
Currently, in this work, it is still the case that only relative hydrophilic and abundant metabolites have been determined using NMR techniques, although some of them can differentiate the geographically distinct populations of mud crabs. However, the hydrophobic metabolites such as lipids could be useful to differentiate these crabs. For example, nine potential lipid markers have been reported to be capable to distinguish the coix seeds by their geographical origin (Hou et al. Citation2018). Furthermore, hydrophobic compounds are easily covered with organic solvent extraction in conjunction with LC-MS analysis. In fact, to avoid the intrinsic limitations of a single analysis method (Tang and Wang Citation2006), the combination of NMR and LC-MS has been applied to analyse the metabolites of plants (Dai et al. Citation2010), marine plankton (Poulson-Ellestad et al. Citation2014), and microbes (Harmerly et al. Citation2015). It is thus conceivable that LC-MS analysis could offer more differentiating metabolites for geographically distinct populations of mud crab.
Conclusion
In this study, a combination method of 1H NMR spectroscopy coupled with OPLS-DA is reliable for discriminating S. paramamosain from four different geographical regions in China. This study also suggests that the OPLS-DA method is useful for elucidating the major metabolites responsible for differentiation such as IMP, AMP, and some amino acids. A gradually increasing AMP level in conjunction with a declining IMP level is closely associated with the growth latitude of mud crab, which means these two compounds could potentially be used to characterize the specific geographic origin of mud crabs. However, the possible reasons for such changes should be complex and confounding as some of the inherent variation of environmental factors could not be controlled. More studies are needed to explain these reasons. Also, more investigation of mud crabs from a wider range of geographical origins could lead to the establishment of discriminatory metabolite biomarkers for the geographic origin of mud crab.
Disclosure statement
No potential conflict of interest was reported by the authors.
Additional information
Funding
References
- Andris F , Leo O. 2015. AMPK in lymphocyte metabolism and function. Int Rev Immunol. 34:67–81. doi: 10.3109/08830185.2014.969422
- Aue WP , Bartholdi E , Ernst RR. 1976a. Two-dimensional spectroscopy. Application to nuclear magnetic-resonance. J Chem Phys. 64:2229–2246. doi: 10.1063/1.432450
- Aue WP , Karhan J , Ernst RR. 1976b. Homonuclear broad-band decoupling and two-dimensional J-resolved NMR-spectroscopy. J Chem Phys. 64:4226–4227. doi: 10.1063/1.431994
- Aursand M , Standal IB , Praël A , Mcevoy L , Irvine J , Axelson DE. 2009. 13 C NMR pattern recognition techniques for the classification of Atlantic salmon (Salmo salar L.) according to their wild, farmed, and geographical origin. J Agr Food Chem. 57:3444–3451. doi: 10.1021/jf8039268
- Bayram M , Gökırmaklı Ç . 2018. Horizon scanning: How will metabolomics application transform food science, bioengineering, and medical innovation in the current era of Foodomics. OMICS. 22(3):177–183. doi: 10.1089/omi.2017.0203
- Braunschweiler L , Ernst RR. 1983. Coherence transfer by isotropic mixing, application to proton correlation spectroscopy. J Magn Reson. 53:521–528.
- Chen DW , Zhang M. 2007. Non-volatile taste active compounds in the meat of Chinese mitten crab (Eriocheir sinensis). Food Chem. 104:1200–1205. doi: 10.1016/j.foodchem.2007.01.042
- Cloarec O , Dumas ME , Trygg J , Craig A , Barton RH , Lindon JC , Nicholson JK , Holmes E. 2005. Evaluation of the orthogonal projection on latent structure model limitations caused by chemical shift variability and improved visualization of biomarker changes in 1H NMR spectroscopic metabonomic studies. Anal Chem. 77:517–526. doi: 10.1021/ac048803i
- Dai H , Xiao C , Liu H , Hao F , Tang H. 2010. Combined NMR and LC-DAD-MS analysis reveals comprehensive metabonomic variations for three phenotypic cultivars of Salvia Miltiorrhiza Bunge. J Proteome Res. 9(3):1565–1578. doi: 10.1021/pr901045c
- Eriksson L , Trygg J , Wold S. 2008. CV-ANOVA for significance testing of PLS and OPLS (R) models. J Chemometr. 22:594–600. doi: 10.1002/cem.1187
- Fan TWM. 1996. Metabolite profiling by one- and two-dimensional NMR analysis of complex mixtures. Prog Nucl Magn Reson Spectrosc. 28:161–219. doi: 10.1016/0079-6565(95)01017-3
- Fan TWM , Lane AN. 2008. Structure-based profiling of metabolites and isotopomers by NMR. Prog Nucl Magn Reson Spectrosc. 52:69–117. doi: 10.1016/j.pnmrs.2007.03.002
- Fuke S , Ueda Y. 1996. Interactions between umami and other flavor characteristics. Trends Food Sci Tech. 7:407–411. doi: 10.1016/S0924-2244(96)10042-X
- Geller J , Meyer C , Parker M , Hawk H. 2013. Redesign of PCR primers for mitochondrial cytochrome c oxidase subunit I for marine invertebrates and application in all-taxa biotic surveys. Mol Ecol Resour. 13:851–861. doi: 10.1111/1755-0998.12138
- Harmerly T , Tripet BP , Tigges M , Giannone RJ , Wurch L , Hettich RL , Podar M , Copié V , Bothner B. 2015. Untargeted metabolomics studies employing NMR and LC–MS reveal metabolic coupling between Nanoarcheum equitans and its archaeal host Ignicoccus hospitalis . Metabolomics. 11(4):895–907. doi: 10.1007/s11306-014-0747-6
- Hayashi T , Yamaguchi K , Konosu S. 1981. Sensory analysis of taste-active components in the extract of boiled snow crab meat. J Food Sci. 46:479–483, 493. doi: 10.1111/j.1365-2621.1981.tb04890.x
- Hossain MS , Koshio S , Ishikawa M , Yokoyama S , Sony NM , Ono S , Fujieda T. 2016. Comparison of the effects of inosine and inosine monophosphate on growth, immune response, stress resistance and gut morphology of juvenile red sea bream, Pagrus major . Aquaculture. 458:64–74. doi: 10.1016/j.aquaculture.2016.02.032
- Hou J-J , Cao C-M , Xu Y-W , Yao S , Cai L-Y , Long H-L , Bi Q-R , Zhen Y-Y , Wu W-Y , Guo D-A. 2018. Exploring lipid markers of the quality of coix seeds with different geographical origins using supercritical fluid chromatography mass spectrometry and chemometrics. Phytomedicine. 45:1–7. doi: 10.1016/j.phymed.2018.03.010
- Jung Y , Lee J , Kwon J , Lee K-S , Ryu DH , Hwang G-S. 2010. Discrimination of the geographical origin of beef by 1H NMR-based metabolomics. J Agr Food Chem. 58:10458–11046. doi: 10.1021/jf102194t
- Kim J , Jung Y , Song B , Bong Y-S , Ryu D H , Lee K-S , Hwang G-S. 2013. Discrimination of cabbage (Brassica rapa ssp. pekinensis) cultivars grown in different geographical areas using 1H NMR-based metabolomics. Food Chem. 137:68–75. doi: 10.1016/j.foodchem.2012.10.012
- Lee J-E , Lee B-J , Chung J-O , Kim H-N , Kim E-H , Jung S , Lee H , Lee S-J , Hong Y-S. 2015. Metabolomic unveiling of a diverse range of green tea (Camellia sinensis) metabolites dependent on geography. Food Chem. 174:452–459. doi: 10.1016/j.foodchem.2014.11.086
- Lin Q , Li S , Li Z , Wang G. 2007. Species composition in genus Scylla from the coast of southeast China. J Fish China. 31:211–219. In Chinese with English Abstract.
- Lioe HN , Apriyantono A , Takara K , Wada K , Naoki H , Yasuda M. 2004. Low molecular weight compounds responsible for savory taste of Indonesian soy sauce. J Agr Food Chem. 52:5950–5956. doi: 10.1021/jf049230d
- Longobardi F , Innamorato V , Gioia A D , Ventrella A , Lippolis V , Logrieco A F , Catucci L , Agostiano A. 2017. Geographical origin discrimination of lentils (Lens culinaris Medik.) using 1 H NMR fingerprinting and multivariate statistical analyses. Food Chem. 237:743–748. doi: 10.1016/j.foodchem.2017.05.159
- Longobardi F , Ventrella A , Bianco A , Catucci L , Cafagna I , Gallo V , Mastrorilli P , Agostiano A. 2013. Non-targeted 1H NMR fingerprinting and multivariate statistical analyses for the characterisation of the geographical origin of Italian sweet cherries. Food Chem. 141:3028–3033. doi: 10.1016/j.foodchem.2013.05.135
- Ma H , Ma C , Li X , Xu Z , Feng N , Ma L. 2013. The complete mitochondrial genome sequence and gene organization of the mud crab (Scylla paramamosain) with phylogenetic consideration. Gene. 519:120–127. doi: 10.1016/j.gene.2013.01.028
- Nicholson JK , Lindon JC , Holmes E. 1999. ‘Metabonomics’: understanding the metabolic responses of living systems to pathophysiological stimuli via multivariate statistical analysis of biological NMR spectroscopic data. Xenobiotica. 29:1181–1189. doi: 10.1080/004982599238047
- Ørnholt-Johansson G , Frosch S , Jørgensen M. 2017. Variation in some quality attributes of Atlantic salmon fillets from aquaculture related to geographic origin and water temperature. Aquaculture. 479:378–383. doi: 10.1016/j.aquaculture.2017.06.016
- Overton JL , Macintosh DJ , Thorpe RS. 1997. Multivariate analysis of the mud crab Scylla serrata (Brachyura: Portunidae) from four locations in Southeast Asia. Mar Biol. 128:55–62. doi: 10.1007/s002270050068
- Poulson-Ellestad KL , Jones CM , Roy J , Viant MR , Fernández FM , Kubanek J , Nunn BL. 2014. Metabolomics and proteomics reveal impacts of chemically mediated competition on marine plankton. PNAS. 111(24):9009–9014. doi: 10.1073/pnas.1402130111
- Sarower MG , Shahriar SIM , Nakamura H , Rouf MA , Okada S. 2016. Taxonomic confirmation of mud crab species (genus Scylla) in Bangladesh by nuclear and mitochondrial DNA markers. Mitochondrial DNA A, DNA Mapp Seq Anal. 28:935–940.
- Sciubba F , Capuani G , Di Cocco ME , Avanzato D , Delfini M. 2014. Nuclear magnetic resonance analysis of water soluble metabolites allows the geographic discrimination of pistachios (Pistacia vera). Food Res Int. 62:66–73. doi: 10.1016/j.foodres.2014.02.039
- Segura-Garcıa I , Tun TY , Box SJ. 2018. Genetic characterization of the artisanal mud crab fishery in Myanmar. PLoS ONE. 13:e0204905. doi: 10.1371/journal.pone.0204905
- Song JW , Lim SJ , Lee KJ. 2012. Effects of dietary supplementation of inosine monophosphate on growth performance, innate immunity and disease resistance of olive flounder (Paralichthys olivaceus). Fish Shellfish Immun. 33:1050–1054. doi: 10.1016/j.fsi.2012.07.011
- Tang HR , Wang YL. 2006. Metabonomics: a revolution in progress. Prog Biochem Biophys. 33:401–417.
- Tao H , Du B , Wang H , Dong H , Yu D , Ren L , Sima Y , Xu S. 2018. Intestinal microbiome affects the distinctive flavor of Chinese mitten crabs in commercial farms. Aquaculture. 483:38–45. doi: 10.1016/j.aquaculture.2017.09.031
- Tomita S , Nemoto T , Matsuo Y , Shoji T , Tanaka F , Nakagawa H , Ono H , Kikuchi J , Ohnishi-Kameyama M , Sekiyama Y. 2015. A NMR-based, non-targeted multistep metabolic profiling revealed L-rhamnitol as a metabolite that characterised apples from different geographic origins. Food Chem. 174:163–172. doi: 10.1016/j.foodchem.2014.11.028
- Trygg J , Wold S. 2002. Orthogonal projections to latent structures (O-PLS). J Chemometr. 16:119–128. doi: 10.1002/cem.695
- Vandenberg RA , Hoefsloot HCJ , Westerhuis JA , Smilde AK , Vanderwerf MJ. 2006. Centering, scaling, and transformations: improving the biological information content of metabolomics data. BMC Genomics. 7:142–156. doi: 10.1186/1471-2164-7-142
- Wishart DS. 2008. Metabolomics: applications to food science and nutrition research. Trends Food Sci Tech. 19:482–493. doi: 10.1016/j.tifs.2008.03.003
- Xiao C , Hao F , Qin X , Wang Y , Tang H. 2009. An optimized buffer system for NMR based urinary metabonomics with effective pH control, chemical shift consistency and dilution minimization. Analyst. 134:916e25. doi: 10.1039/b818802e
- Ye Y , An Y , Li R , Mu C , Wang C. 2014. Strategy of metabolic phenotype modulation in Portunus trituberculatus exposed to low salinity. J Agr Food Chem. 62(15):3496–3503. doi: 10.1021/jf405668a
- Ye Y , Zhang L , Tang H , Yan X. 2012. Survey of nutrients and quality assessment of crab paste by 1H NMR spectroscopy and multivariate data analysis. Chinese Sci Bull. 57(25):3353–3362. doi: 10.1007/s11434-012-5119-x
- Yearbook CFS . 2017. China Agriculture Press. 1–108.
- Zotti M , De Pascali SA , Del Coco L , Migoni D , Carrozzo L , Mancinelli G , Fanizzi FP. 2016. 1H NMR metabolomic profiling of the blue crab (Callinectes sapidus) from the Adriatic Sea (SE Italy): A comparison with warty crab (Eriphia verrucosa), and edible crab (Cancer pagurus). Food Chem. 196:601–609. doi: 10.1016/j.foodchem.2015.09.087