
ABSTRACT
This study elucidated the dynamics of AA release in low-protein growing pig diets formulated with different protein sources. Four protein sources including soybean meal (SM), corn gluten meal (CGM), fish meal (FM) and fermented soybean meal (FSM) were used to formulate growing pig diets and subjected to in vitro digestion for 4, 8, 12, 16, 20, 24, and 28 h at 39°C. The AA contents were measured by ultra-high performance liquid chromatography (UPLC). FSM group recorded the highest AA release rate at 4-12 h digestion while the CGM group recorded the lowest at 8-20 h digestion (p < 0.05). AA release in the SM group was significantly higher than that in the FM group at 8, 12 and 20 h digestion (p < 0.05). Lysine, methionine and phenylalanine contents in the dietary groups showed significant variations within the first 8 h of digestion due to synthetic AA supplementation. However, after 8 h, the essential AA (EAA) release rate in the FSM group was consistently higher while those in the CGM group were consistently lower (p < 0.05). Based on the results, the AA release patterns of diets can be effectively regulated to meet animal demand by adjusting the structure of the dietary protein source.
1. Introduction
The nutritive value of dietary protein (either whole or hydrolysed) is determined by the content, availability, balance and digestibility of amino acids (AA) in the diet (Wang and Fuller Citation1988; Chung and Baker Citation1992; Ravindran et al. Citation2005). Amino acids in their bioavailable form are those that can be digested, absorbed and utilized by animals, thus, the digestibility of AA is largely related to AA bioavailability (Ravindran et al. Citation2005). Therefore, it becomes necessary to carefully assess the bioavailability of each of the essential amino acids (EAA) as it is critical for establishing the balance between feed nutrient value and animal nutrient demand (Stein et al. Citation2007). In light of this, many studies have been conducted to assess the nutritional value of animal diets in order to develop standards that will meet animal nutritional demand (Goldberg and Guggenheim Citation1962; Evan et al. Citation1989; Boisen and Fernhndez Citation1995; Ravindran et al. Citation2005; Stein et al. Citation2006; Juana et al. Citation2008; Cervantes-Pahm and Stein Citation2010). For example, an experiment was conducted to determine the apparent (AID) and standardized ileal digestibility (SID) of crude protein and AA of soybean meal, soy protein isolate, fermented soybean meal, enzyme-treated soybean meal, fish meal, and casein in weanling pigs. The results showed that fermented soybean meal and enzyme-treated soybean meal had similar SID of most AA as soybean meal, but soy protein isolate recorded the highest SID of AA among the 4 soybean products. Casein had the highest SID of AA among all the protein sources (Cervantes-Pahm and Stein Citation2010). However, these experiments tend to ignore the patterns or dynamics involved in the release of amino acids in the digestive tract of animals which is necessary for developing a standard profile for the evaluation of dietary protein quality (Wang and Fuller Citation1988).
Even though low-protein diets have been reported to reduce nitrogen pollution (Figueroa et al. Citation2002) and improve the gastrointestinal health and function of animals especially weaned pigs, weakened muscle protein synthesis and growth, resulting from the suppression of the mammalian target of rapamycin (mTOR) signaling has been associated to low-protein diets (Lordelo et al. Citation2008; Yue and Qiao Citation2008; Deng et al. Citation2009; Zhang et al. Citation2013; Chen et al. Citation2018). A substantial decrease in daily gain and feed efficiency was observed when pigs were fed a low-protein diet (Kerr et al. Citation1995). However, this problem can be alleviated through dietary synthetic AA supplementation. For example, when low protein diets were supplemented with lysine, tryptophan, and threonine, pig performance improved to a level comparable to that of pigs fed high protein diets (Kerr et al. Citation1995). In vitro methods for studying gastrointestinal dynamics of feed presents advantages such as being less expensive, labour friendly, independent of ethical restrictions, allows for large sample sizes and reproducibility among others (Minekus et al. Citation2014). Therefore, the objective of this study was to elucidate the dynamics of AA release in low-protein synthetic AA supplemented growing pig diets formulated with different dietary protein sources in vitro.
2. Materials and methods
2.1. Materials
Pepsin P7000-25 g, trypsin solution P7545-100 g and 17 amino acid mixed standards were purchased from Sigma-Aldrich (St. Louis, Missouri USA). Sulfosalicylic acid, chloramphenicol, AccQ•Tag Ultra eluent A concentrate, AccQ• Tag Ultra Eluent B and sample derivatizing agent were purchased from Waters Corporation (Milford, USA). Acetonitrile and methanol were purchased from Thermo Fisher Scientific (Waltham, Massachusetts, USA).
2.2. Test diets
Based on the corn-soybean meal commercial diet, four dietary protein sources including soybean meal (SM), corn gluten meal (CGM), fish meal (FM) and fermented soybean meal (FSM) were used to formulate growing pig diets to meet the National Research Council recommended nutrient requirements for growing pigs NRC (Citation2012), and based on standardized ileal digestibility (SID) coefficients, diets were supplemented with synthetic crystalline amino acids to attain an amino acid balance in diets ().
Table 1. Ingredients and chemical composition of experimental diets (as-fed basis, %)
2.3. In vitro digestion
Ground diet samples were subjected to in vitro digestion as described by (Boisen and Fernhndez Citation1995) with some modifications. Briefly, 1 g each of the test diets were weighed into 50 ml centrifuge tubes to obtain 6 subsamples per sample and then pig pepsin solution [10 ml, 1 mg/ml, pH = 2] was added. To the mixture was added 0.5 ml of chloramphenicol solution, sealed with a sealing film and then placed in a water bath at 37°C for 4 h with gentle agitation. Afterwards, the solution was neutralized with 0.2 mol/L NaOH and 10 ml phosphate buffer [0.2 mol/ml, pH = 6.8]. Fresh porcine pancreatin solution [1 ml, 50 mg/ml] was then added and incubation continued for 4, 8, 12, 16, 20, 24, and 28 h at 39°C. After incubation, the residue was centrifuged at 3000 rpm at 4°C for 15 min and then 200 μl of 10% sulfosalicylic acid was added to the filtrate [800 μl] and kept at 4°C for 1 h. Afterwards, the solution was centrifuged at 14500 rpm for 15 min, and the supernatant centrifuged at 14500 rpm for 5 min. The final supernatant was passed through a 0.22 μm filter and stored at −80°C for later analysis.
2.4. Determination of free amino acid content
The amino acid content of diets was determined by the Waters ACQUITY UPLC TUV system with an AccQ•TagTM Ultra column (2.1 × 100 mm, P/N: 186003837) as described by (Reverter et al. Citation1997). The 2A bottle (AccQ-Fluor Reagent powder) was flicked to ensure that the reagent powder settled at the bottom of the bottle. The AccQ-Fluor dilution [1 ml] in the 2B bottle was pipetted into the 2A bottle and mixed by vortex for 15s. The bottles were sealed and heated in an oven at 55°C for about 10 min to dissolve the reagent powder. Diluted plasma sample (diluted 10-fold of the sample) of 10 ml was pipetted into the derivative tube (P/NWT007571) and mixed with 70 μl of AccQ•Fluor•Buffer1. The derivatization reaction was then initiated by the addition of 20 μl of AccQF•Fluor Derivatizer (2A). After 1 min incubation at room temperature, the content was transferred to an autosampler vial and capped with a silicone-lined septum. The vial was placed in a heating block for 10 min at 55°C in order to finish the derivatization procedure. After that, the samples were transferred to a UPLC full recovery sample bottle and prepared for injection.
2.5. Chromatographic conditions
Mobile phase A: AccQ•TagUltra eluent A solution, diluted 10 times with pure water; mobile phase B: AccQ•TagUltra eluent B solution; flow rate: 0.7 ml/min; injection volume: 1 μl; column temperature: 55°C; sample temperature: 15°C; detection wavelength: 260 nm; acquisition speed: 20 points/s; time constant: 0.1 s; running time: 10 min.
2.6. Statistical analysis
Data were analysed by analysis of variance, using the General Linear Model procedure of SPSS 24.0 (SPSS Inc., Chicago, IL, USA). Significant differences between means were determined using the Tukey’s multiple comparison test. Results are expressed as mean ± standard deviation. Probability values of ≤ 0.05 were considered statistically significant.
3. Results
3.1. Release dynamics of total free amino acids in different dietary protein sources
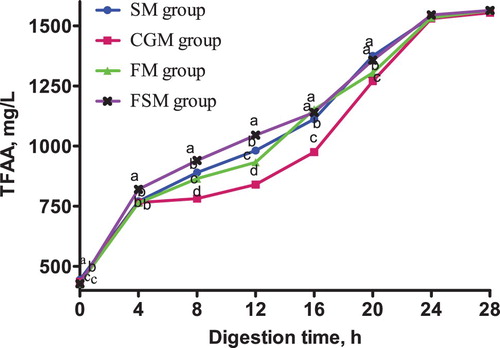
As shown in , before in vitro digestion, the total free amino acid (TFAA) content in the four dietary groups varied significantly. The SM group was significantly higher than the CGM, FM and FSM groups (p < 0.05), while the CGM group was significantly higher than the FM and FSM groups (p < 0.05). At 4 h, TFAA content in the FSM group was significantly higher than the other three groups (p < 0.05). At 8-16 h digestion, TFAA content in the FSM group remained consistently higher than the other three groups (p < 0.05), while that in the CGM group was consistently lower (p < 0.05). Conversely, the TFAA content in the SM group was significantly higher than that in the FM group (p < 0.05). After in vitro digestion for 20 h, TFAA content in the SM group and the FSM group was not significantly different (p > 0.05), but was significantly higher than the CGM and FM groups (p < 0.05), and the CGM group recorded the lowest TFAA content (p < 0.05). At 24-28 h in vitro digestion, all dietary groups recorded no significant differences in TFAA content (p > 0.05).
Figure 1. Release dynamics of total free amino acids (TFAA) in different dietary protein sources [mg/L]. Values are means (N = 6) for test diets with their standard deviations represented by vertical bars. Significant differences in TFAA concentration are indicated at each sampling time: means with different letters (a, b, c, d) differ significantly (p < 0.05). SM = soybean meal, CGM = corn gluten meal, FM = fish meal, FSM = fermented soybean meal.
3.2. Release dynamics of essential amino acids in different dietary protein sources
The release dynamics of EAA in different protein-based diets is presented in . At 0-4 h in vitro digestion, lysine content in the CGM and FSM groups was not significantly different (p > 0.05) but significantly higher than that in the SM and FM groups (p < 0.05). Methionine content in the SM group was significantly higher than in the CGM, FM and FSM groups (p < 0.05). The different protein sources did not affect threonine content in the 4 dietary groups (p > 0.05). Phenylalanine content in the SM group and CGM group was not significantly different (p > 0.05), but was significantly higher than that in the FM group and FSM group (p < 0.05).
Figure 2. Release dynamics of lysine in different dietary protein sources [mg/L]. Values are means (N = 6) for test diets with their standard deviations represented by vertical bars. Significant differences in lysine concentration are indicated at each sampling time: means with different letters (a, b, c) differ significantly (p < 0.05). SM = soybean meal, CGM = corn gluten meal, FM = fish meal, FSM = fermented soybean meal.
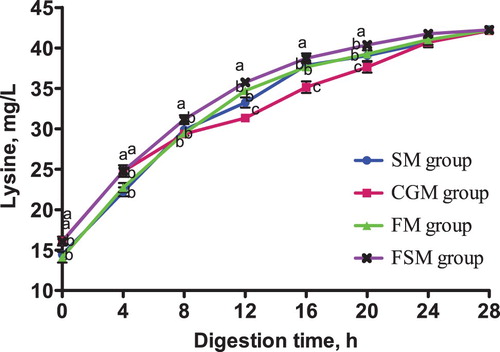
Figure 3. Release dynamics of methionine in different dietary protein sources [mg/L]. Values are means (N = 6) for test diets with their standard deviations represented by vertical bars. Significant differences in methionine concentration are indicated at each sampling time: means with different letters (a, b, c) differ significantly (p < 0.05). SM = soybean meal, CGM = corn gluten meal, FM = fish meal, FSM = fermented soybean meal.
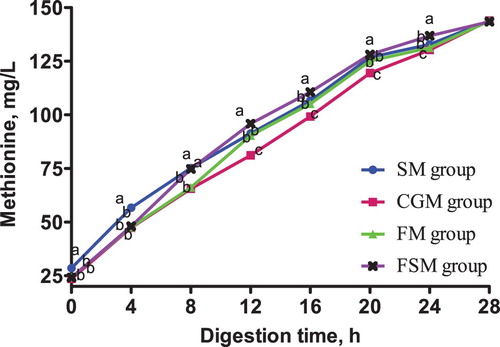
Figure 4. Release dynamics of threonine in different dietary protein sources [mg/L]. Values are means (N = 6) for test diets with their standard deviations represented by vertical bars. Significant differences in threonine concentration are indicated at each sampling time: means with different letters (a, b, c) differ significantly (p < 0.05). SM = soybean meal, CGM = corn gluten meal, FM = fish meal, FSM = fermented soybean meal.
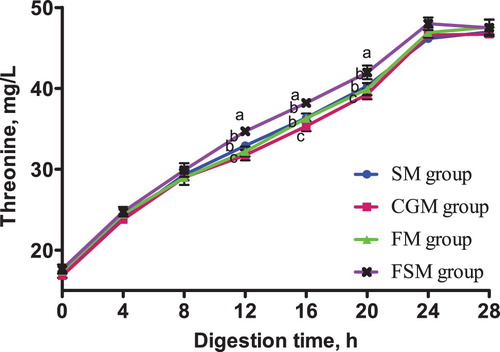
Figure 5. Release dynamics of phenylalanine in different dietary protein sources [mg/L]. Values are means (N = 6) for test diets with their standard deviations represented by vertical bars. Significant differences in phenylalanine concentration are indicated at each sampling time: means with different letters (a, b, c) differ significantly (p < 0.05). SM = soybean meal, CGM = corn gluten meal, FM = fish meal, FSM = fermented soybean meal.
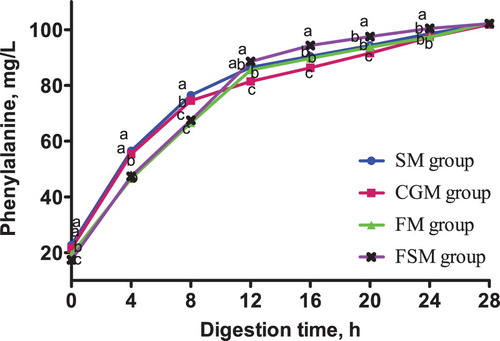
Figure 6. Release dynamics of isoleucine in different dietary protein sources [mg/L]. Values are means (N = 6) for test diets with their standard deviations represented by vertical bars. Significant differences in isoleucine concentration are indicated at each sampling time: means with different letters (a, b, c) differ significantly (p < 0.05). SM = soybean meal, CGM = corn gluten meal, FM = fish meal, FSM = fermented soybean meal.
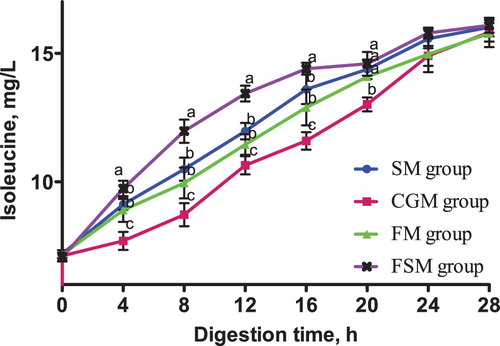
Figure 7. Release dynamics of leucine in different dietary protein sources [mg/L]. Values are means (N = 6) for test diets with their standard deviations represented by vertical bars. Significant differences in leucine concentration are indicated at each sampling time: means with different letters (a, b, c) differ significantly (p < 0.05). SM = soybean meal, CGM = corn gluten meal, FM = fish meal, FSM = fermented soybean meal.
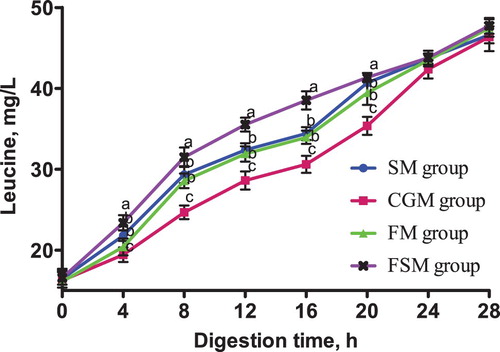
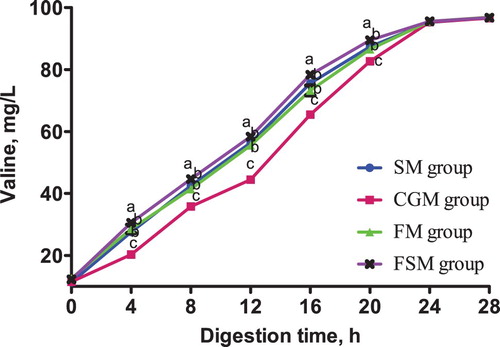
Figure 8. Release dynamics of valine in different dietary protein sources [mg/L]. Values are means (N = 6) for test diets with their standard deviations represented by vertical bars. Significant differences in valine concentration are indicated at each sampling time: means with different letters (a, b, c) differ significantly (p < 0.05). SM = soybean meal, CGM = corn gluten meal, FM = fish meal, FSM = fermented soybean meal.
After 4 h digestion, lysine content in the FSM group was significantly higher than that in the other three groups (p < 0.05), among which had no significant differences (p > 0.05). Methionine content in the SM group and FSM group was not significantly different (p > 0.05) but significantly higher than in the CGM and FM groups (p < 0.05). There was no significant difference in threonine content between the four diet groups (p > 0.05). Phenylalanine content in the SM group was significantly higher than in the CGM group (p < 0.05) which was significantly higher than the FM and FSM groups (p < 0.05).
From 12-20 h digestion, lysine, methionine, threonine and phenylalanine contents in the FSM group were consistently higher than those in the other three groups (p < 0.05), while the contents in the CGM group were consistently lower (p < 0.05). At the same time, the SM and FM groups recorded no significant differences in lysine, methionine, threonine and phenylalanine contents (p > 0.05). There was no significant difference in lysine, methionine, threonine and phenylalanine contents between the four groups 24-28 h digestion (p > 0.05).
The release dynamics of isoleucine, leucine and valine from 4-28 h in vitro were consistent. The isoleucine, leucine and valine contents in the FSM meal group was consistently higher than those in the SM, CGM and FM groups (p < 0.05) while the contents in the CGM group was consistently lower (p < 0.05). Conversely, the isoleucine, leucine and valine contents in the SM and the FM groups were not significantly different (p > 0.05).
4. Discussion
Variations in the rate of AA digestion and release in different dietary protein sources are influenced not only by the AA composition but by the type and structure of the diet as well (Yves et al. Citation1997; Ravindran et al. Citation2005; Tan et al. Citation2016). Variations in CP and AA digestibility in different dietary nutrient sources have already been established (Ravindran et al. Citation1998; Ravindran et al. Citation2002; Ravindran et al. Citation2005; Bryden et al. Citation2009; Nalle Citation2009). For example, significant variations in AA digestibility were observed when ileal AA digestibility of different protein sources was comprehensively assessed in poultry (Ravindran et al. Citation2005). Similar variations were observed in AA release dynamics in the current study. The recommended protein and amino acid patterns for growing pigs have been previously estimated (Wang and Fuller Citation1988; Fuller et al. Citation1989). However, these experiments were focused on nitrogen retention and AA requirements for maintenance and protein accretion in pigs. In this study, in vitro digestion was used to determine the AA release patterns of different dietary protein sources used to formulate growing pig diets. The results showed significant variations in total free AA (TFAA) content in the different dietary groups. Before digestion, the SM group recorded the highest TFAA content followed by the CGM group and then the FM and FSM groups which were statistically similar. These variations were as a result of the supplementation of synthetic AA in the diets. However, 4-5 h after the start of digestion, the FSM group recorded the highest AA release rate while the CGM group recorded the lowest AA release rate from 8-20 h. In this study, the TFAA content in the SM group was mostly higher than that in the FM group suggesting that SM diets were more easily digested than FM diets (Guan et al. Citation2016). This result is consistent with those of Guan et al. (Citation2016) who observed higher FAA content in digesta of pigs fed soybean meal diet than those fed fish meal diet at 1 and 4 h after feeding. Similarly, Tan et al. (Citation2016) found that pigs fed soybean meal diet had higher FAA content in the proximal and distal jejunum than those fed fishmeal diet. In contrast to our results, Zhou et al. (Citation2004) observed higher AA availability in fish meal and corn gluten meal than in soybean meal when apparent digestibility of selected feed ingredients was studied.
The release dynamics of EAA showed interesting variations for lysine, methionine, and phenylalanine especially within the first 8 h of digestion in vitro. Methionine and phenylalanine contents in the SM group were significantly higher than those in the FSM group but a contradicting result was observed in lysine content where the FSM group was significantly higher than the SM group. Also, the lysine and methionine contents in the CGM group and FSM group were not significantly different but the phenylalanine content in the CGM group was significantly higher than in the FSM group. These variations are as a result of the supplementation of synthetic AA to attain an AA balance in the different protein based dietary groups. Conversely, there was no significant difference in the threonine content in all dietary groups. The observed variations disappeared after 12 h digestion. The AA content in the FSM group maintained a consistently higher rate from 12-20 h digestion, indicating a higher AA release rate while content in the CGM group was consistently lower indicating a lower AA release rate. Within the same timeframe, the AA release rate in the SM group and the FM group were statistically similar. Also, the results showed that the release rate of isoleucine, leucine and valine were highest in the FSM, and lowest in the CGM group, and in the SM and FM groups, they were not significantly different. The high AA release rate in the FSM group may have been because of the microbial metabolism that takes place during fermentation of soybean (Shekib Citation1994; Azeke et al. Citation2005; Khalil Citation2006; Juana et al. Citation2008). Also, fermentation has been previously related to improved nutritional value of proteins (Torres et al. Citation2006). Additionally, this result could be due to the removal of antinutritional factors such as phytic acid, α-galactosides and trypsin inhibitors through fermentation while conversely maintaining an acceptable amount of protein, starch, minerals, dietary fibre, available sugar, and vitamins (Juana et al. Citation2008). The low AA release rate in the CGM group was probably because of the high amount of prolamine in corn which is composed of high contents of hydrophobic amino acids and hence has a poor solubility (Torres-Giner et al. Citation2008). Prolamine is a storage protein which contains higher proline and glutamine contents and lower lysine, threonine and/or tryptophan contents compared to other proteins. Prolamine constitute up to 40% of the total protein in corn and results in poor digestibility and nutritional quality (mShane et al. Citation2016) as observed in the present study. Generally, differences in cultivar, growing conditions, rainfall, season, agronomic practices and processing are other known factors that cause variations in nutrient contents of feed ingredients (Ravindran et al. Citation2005).
5. Conclusion
In conclusion, the results of the present study indicate that the dynamics of amino acid digestion and release in different protein-based diets vary, and these variations are largely based on the molecular structure and chemical composition of the dietary protein source. Therefore, by adjusting the structure of the protein source and the diet, the AA release patterns of the diet in the digestive tract of the animal can be effectively regulated to meet the dynamic balance between dietary AA supply and animal demand in order to improve the efficiency of the use of dietary nutrients in animals and consequently improve animal performance. The results of this study will become more intelligible if further research (such as an in vivo feed trial) is carried out on such different protein-based diets in order to elucidate their AA release and absorption patterns in the digestive tract of animals.
Disclosure statement
No potential conflict of interest was reported by the authors.
ORCID
Abedin Abdallah http://orcid.org/0000-0001-9093-025X
Additional information
Funding
References
- Azeke MA , Fretzdorff B , Buening PH , Holzapfel W , Betsche T. 2005. Nutritional value of African yambean (Sphenostylis stenocarpa L): improvement by lactic acid fermentation. J Sci Food Agric. 85(6):963–970. doi: 10.1002/jsfa.2052
- Boisen S , Fernhndez JA. 1995. Prediction of the apparent ileal digestibility of protein and amino acids in feedstuffs and feed mixtures for pigs by in vitro analyses. Anim Feed Sci Technol. 51:29–43. doi: 10.1016/0377-8401(94)00686-4
- Bryden WL , Li X , Ravindran G , Hew LI , Ravindran V. 2009. Ileal digestible amino acid values in feedstuffs for poultry. Barton, A.C.T., Australia : RIRDC.
- Cervantes-Pahm SK , Stein HH. 2010. Ileal digestibility of amino acids in conventional, fermented, and enzyme-treated soybean meal and in soy protein isolate, fish meal, and casein fed to weanling pigs. J Anim Sci. 88(8):2674–2683. doi: 10.2527/jas.2009-2677
- Chen J , Su W , Kang B , Jiang Q , Zhao Y , Fu C , Yao K. 2018. Supplementation with alpha-ketoglutarate to a low-protein diet enhances amino acid synthesis in tissues and improves protein metabolism in the skeletal muscle of growing pigs. Amino Acids. 50(11):1525–1537. doi: 10.1007/s00726-018-2618-3
- Chung TK , Baker DH. 1992. Ideal amino acid pattern for 10-kilogram pigs. J Anim Sci. 70(10):3102–3111. doi: 10.2527/1992.70103102x
- Deng D , Yao K , Chu W , Li T , Huang R , Yin Y , Liu Z , Zhang J , Wu G. 2009. Impaired translation initiation activation and reduced protein synthesis in weaned piglets fed a low-protein diet. J Nutr Biochem. 20(7):544–552. doi: 10.1016/j.jnutbio.2008.05.014
- Evan CT , Neal RM , Larry LB. 1989. Evaluation of soybean meal, corn gluten meal, blood meal and fish meal as sources of nitrogen and amino acids disappearing from the small intestine of steers. J Anim Sci. 67:262–275. doi: 10.2527/jas1989.671262x
- Figueroa JL , Lewis AJ , Miller PS , Fischer RL , Gómez RS , Diedrichsen RM. 2002. Nitrogen metabolism and growth performance of gilts fed standard corn-soybean meal diets or low-crude protein, amino acid-supplemented diets1. J Anim Sci. 80(11):2911–2919. doi: 10.2527/2002.80112911x
- Fuller MF , McWilliam R , Wang TC , Giles LR. 1989. The optimum dietary amino acid pattern for growing pigs. Br J Nutr. 62(02):255–261. doi: 10.1079/BJN19890028
- Goldberg A , Guggenheim K. 1962. The digestive release of amino acids and their concentrations in the portal plasma of rats after protein feeding. Bioch. 83:129–135. doi: 10.1042/bj0830129
- Guan GP , Tan BE , Yao K , Fang J , He GZ , Li TJ , Sun H LYY. 2016. Dynamic profles of amino acids released from different nitrogen composited diets in the jejunum of pigs. J Anim Sci. 94:283–285. doi: 10.2527/jas.2015-9462
- Juana F , Young SS , Martínez-Villaluenga C. 2008. Immunoreactivity and amino acid content of fermented soybean products. J Agric Food Chem. 56:99–105. doi: 10.1021/jf072177j
- Kerr BJ , McKeith FK , Easter RA. 1995. Effect on performance and carcass characteristics of nursery to finisher pigs fed reduced crude protein, amino acid-supplemented diets. J Anim Sci. 73(2):433–440. doi: 10.2527/1995.732433x
- Khalil AA. 2006. Nutritional improvement of an Egyptian breed of mung bean by probiotic lactobacilli. Afr J Biotechnol. 5(2):206–212.
- Lordelo MM , Gaspar AM , Le Bellego L , Freire JP. 2008. Isoleucine and valine supplementation of a low-protein corn-wheat-soybean meal-based diet for piglets: growth performance and nitrogen balance. J Anim Sci. 86(11):2936–2941. doi: 10.2527/jas.2007-0222
- Minekus M , Alminger M , Alvito P , Ballance S , Bohn T , Bourlieu C , Carriere F , Boutrou R , Corredig M , Dupont D , et al. 2014. A standardised static in vitro digestion method suitable for food - an international consensus. Food Funct. 5(6):1113–1124. doi: 10.1039/C3FO60702J
- mShane PL , Cheryan M , Knapp S. 2016. Method for reducing prolamine content of cereal products. Google Patents.
- Nalle CL. 2009. Nutritional evaluation of grain legumes for poultry: a thesis presented in partial fulfilment of the requirements for the degree of Doctor of Philosophy in poultry Nutrition at Massey University. Palmerston North, New Zealand : Massey University.
- NRC . 2012. Nutrient requirements of swine. Washington, DC : National Academies Press.
- Ravindran V , Bryden WL , Hew LI. 1998. Digestible amino acids in poultry feedstuffs. Canberra, Australia : Rural Industries Research and Development Corporation.
- Ravindran V , Hendriks WH , Camden BJ , Thomas DV , Morel PCH , Butts CA. 2002. Amino acid digestibility of meat and bone meals for broiler chickens. Aust J Agric Res. 53(11):1257–1264. doi: 10.1071/AR02055
- Ravindran V , Hew LI , Ravindran G , Bryden WL. 2005. Apparent ileal digestibility of amino acids in dietary ingredients for broiler chickens. Anim Sci. 81(01):85–97. doi: 10.1079/ASC42240085
- Reverter M , Lundh T , Lindberg JE. 1997. Determination of free amino acids in pig plasma by precolumn derivatization with 6-N-aminoquinolyl-N-hydroxysuccinimidyl carbamate and high-performance liquid chromatography. J Chromatogr B Biomed Sci Appl. 696(1):1–8. doi: 10.1016/S0378-4347(97)00217-X
- Shekib LA. 1994. Nutritional improvement of lentils, chick pea, rice and wheat by natural fermentation. Plant Foods Hum Nutr. 46(3):201–205. doi: 10.1007/BF01088991
- Stein HH , Gibson ML , Pedersen C , Boersma MG. 2006. Amino acid and energy digestibility in ten samples of distillers dried grain with solubles fed to growing pigs. J Anim Sci. 84(4):853–860. doi: 10.2527/2006.844853x
- Stein HH , Seve B , Fuller MF , Moughan PJ , De-Lange CF. 2007. Invited review: amino acid bioavailability and digestibility in pig feed ingredients: terminology and application. J Anim Sci. 85(1):172–180. doi: 10.2527/jas.2005-742
- Tan BE , Guan GP , Yao K , Fang J , Liu YY , Li TJ , Sun H , Yin YL. 2016. Profles of amino acids released from different nitrogen composited diets in different segments of the gastrointestinal tract of pigs. J Anim Sci. 94:276–278. doi: 10.2527/jas.2015-9463
- Torres-Giner S , Gimenez E , Lagaron JM. 2008. Characterization of the morphology and thermal properties of zein prolamine nanostructures obtained by electrospinning. Food Hydrocoll. 22(4):601–614. doi: 10.1016/j.foodhyd.2007.02.005
- Torres A , Frías J , Granito M , Vidal-Valverde C. 2006. Fermented pigeon pea (Cajanus cajan) ingredients in pasta products. J Agric Food Chem. 54(18):6685–6691. doi: 10.1021/jf0606095
- Wang TC , Fuller MF. 1988. The optimum dietary amino acid pattern for growing pigs. Br J Nutr. 62(01):77–89. doi: 10.1079/BJN19890009
- Yue LY , Qiao SY. 2008. Effects of low-protein diets supplemented with crystalline amino acids on performance and intestinal development in piglets over the first 2 weeks after weaning. Livest Sci. 115(2-3):144–152. doi: 10.1016/j.livsci.2007.06.018
- Yves B , Martial DGP , Marie-Paule V , Jean-Louis M , Bernard B. 1997. Slow and fast dietary proteins differently modulate postprandial protein accretion. Proc Natl Acad Sci. 94:14930–14935. doi: 10.1073/pnas.94.26.14930
- Zhang S , Qiao S , Ren M , Zeng X , Ma X , Wu Z , Thacker P , Wu G. 2013. Supplementation with branched-chain amino acids to a low-protein diet regulates intestinal expression of amino acid and peptide transporters in weanling pigs. Amino Acids. 45(5):1191–1205. doi: 10.1007/s00726-013-1577-y
- Zhou QC , Tan BP , Mai KS , Liu YJ. 2004. Apparent digestibility of selected feed ingredients for juvenile cobia Rachycentron canadum. Aquac. 241(1-4):441–451. doi: 10.1016/j.aquaculture.2004.08.044