
 ?Mathematical formulae have been encoded as MathML and are displayed in this HTML version using MathJax in order to improve their display. Uncheck the box to turn MathJax off. This feature requires Javascript. Click on a formula to zoom.
ABSTRACT
Genetic and permanent environmental correlations between milk yield and somatic cell score (SCS) were estimated. The data set used in this analyse contained a total of 204,438 test-day (TD) observations of milk yield and SCS from 22,903 primiparous daughters of 554 dairy Holstein sires. A multiple-trait random regression TD model was employed in the analyses using the Gibbs sampling method. Obtained results showed that daily heritabilities were highest in the second half of lactation and varied from 0.086 to 0.250 for milk yield and 0.041 to 0.086 for SCS. Undesirable genetic relationships with milk yield were found for SCS with genetic correlations ranging from −0.093 to 0.319 that the highest was estimated between SCS days in milk (DIM) 305 and milk DIM 5. Based on these results, we can conclude that the cows with high yield potential in the initial stage of lactation had the highest genetic potential for SCS at the end of lactation. This emphasizes the need for including udder health traits in the breeding goal. However results of this investigation, based on genetic trends, indicate that more emphasis is paid to increase milk yield of Holstein cows in Iran with no or a little emphasis on SCC.
1. Introduction
The major source of income for most Iranian dairy producers is the sale of milk. Accordingly, milk yields have been the main breeding objective in Iranian Holsteins with no or little emphasis on conformation and health. Although these traits are of primary economic importance, but many studies have shown that antagonistic phenotypic and genetic correlations of somatic cell score (SCS) trait with milk yield would lead to a genetic decline in cow health, if selection is for milk production only (Hortet et al. Citation1999; Juozaitiene et al. Citation2006). Gilmore (Citation1977) found a positive correlation between the incidence of health disorders and milk production and reported that dairy cattle with the highest annual health costs were likely to have the highest production during first lactation. In addition to the negative impact on incidence for health problems, the increase in SCS was reported to have a detrimental effect on production, reproductive performance and decline in modern dairy cows in industry herds (Juozaitiene and Juozaitis Citation2005). Carlén et al. (Citation2004) found a high genetic correlation between lactation average SCS and mastitis (mean 0.70).
In the dairy industry, mastitis is a highly undesirable disease that considerably affects overall profitability (Mrode and Swanson Citation1996). With incidence mastitis the mean production of the herd decreased because a greater proportion of the culling decisions are based on production and proportion of mature cows, which produce more milk than young cows, is decreased (Mrode and Swanson Citation2003). Fortunately improving resistance mastitis through breeding, due to the high genetic correlation with mastitis, can be based on indirect selection for low SCS (Mrode and Swanson Citation1996; Heringstad et al. Citation2000). If selection against mastitis is included in a total merit index, the genetic level of mastitis may be kept constant or even improved (Heringstad et al. Citation2000).
Genetic relationship between the milk yield and SCS vary with stage of lactation and with test-day (TD), so an analysis based on TD records should be more accurate (Haile-Mariam et al. Citation2001). This genetic relationship, if identified, would contribute to the genetic improvement of disease resistance. Therefore, the aim of this study was to evaluate the genetic relationships and annual genetic trends for daily milk yield and SCS of primiparous Holstein cattle in Iran.
2. Material and methods
2.1. Data set
Data were provided by the Animal Breeding Center of Iran. In Iran, where records are costly to obtain for farmers, somatic cell count (SCC) is recorded in some herds on a monthly basis. Data were restricted to primiparous cows, calving between 2004 and 2012, that met the following requirements: (1) age at first calving between 660 and 1000 d, (2) test-days from 5 to 305 days in milk (DIM), (3) the first TD was before 60 days after calving, (4) the number of TD records ranged from 8 to 10. All records belonging to the cows whose sires (AI sires) had less than 10 daughters were also omitted; and also herd-year of calving subclasses were required to have a minimum of 10 cows. The SCC was transformed to SCS [SCS = log2 (SCC/105) + 3] to achieve an approximate normal distribution of the TD records (Ali and Shook Citation1980). Finally, edited data set consisted of 204,438 records, produced by 22,903 Holstein cows with known sire () in 159 herds. The average number of daughters per sire was 41, and about 10% of the sires had more than 100 daughters. Summary statistics of the data set are presented in . Generally, the Legendre polynomials have largely been used to fit random curves due to their ability of describing the variation along the period (Bignardi et al. Citation2009). In this research, third-degree (with four coefficients) Legendre polynomials (Kirkpatrick et al. Citation1990) were used for both fixed and random regressions (RR) on the scale from 5 to 305 DIM.
Table 1. Number of sires and daughters by class of daughters per sire.
Table 2. Number of observations, arithmetic means, standard deviations (in parenthesis) for milk yield, SCS, and DIM by test number.
2.2. Model
GLM procedure of SAS software (Citation2003) was used for fitting the fixed effects and variables which were significant at P < 0.05 were included in the model. Finally, for multiple trait analyse, the animal model fitted was as follows:where yijklmpq
is the qth TD records of ith trait; ycji
is the fixed effect of the jth year of calving of ith trait (j = 2004, … , 2012); mtki
is the fixed effect of kth milking frequency of ith trait (k = 2 and 3); htdli
is the fixed effect of lth Herd-year-month of TD of ith trait (l = 1, … , 5734); ASmni
is the fixed regression coefficient, nested within the mth class of the age-season of calving (m = 1, … , 12); ωqn
is the nth order polynomial corresponding to DIM at test; ɑpni
is the nth random regression coefficients (RRC) for the additive genetic (AG) of pth animal (n = 1, … , 65,794); pepni
is the nth RRC for the permanent environmental (PE) of pth animal (n = 1, … , 22,903); eijklmpq
is the residual random effect associated with yijklmpq
.
The covariance structure of the model is,where
Ka
is the 8 × 8 covariance matrix of the AG regression coefficients;
G
is the AG covariance matrix among all animals;
Kp
is the 8 × 8 covariance matrix of the PE regression coefficients;
E
is a 3 × 3 diagonal matrix of residual variances;
I
is the identity matrix and ⊗ is the Kronecker product. Variance and covariance for curve parameters were estimated with a Bayesian approach via the Gibbs sampling algorithm as implemented by Misztal (Citation2015). A single chain with a length of 110,000 was generated discarding the first 10,000 samples (burn-in period). Heritabilities and genetic correlations (RAG) were calculated according to the following formula:
Kapq indicates a matrix of AG (co)variances between traits p and q. Note that i = j if observations were on the same day, and i ≠ j if observations were on different days. Genetic trends obtained by regressing the weighted average EBVs of the animals on the birth year of them.
3. Results
3.1. Fixed effects
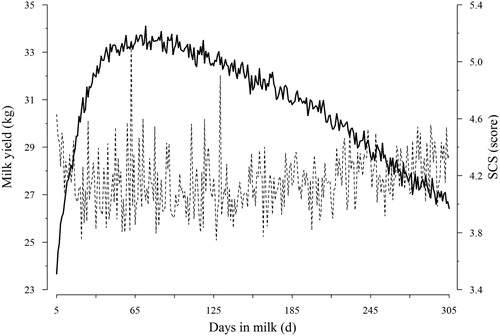
shows that fitted lactation curve for SCS resembled inverted lactation curve for milk yield. The plot shows an increase in milk yield in early lactation, and was highest in peak of lactation (i.e. 60–90 d) and subsequently decreased toward the end of lactation. Over the period considered in the current investigation, milk yield showed a consistent decline; the opposite trend was observed for SCS. For instance, the year of calving solution for milk yield and SCS, respectively, for 2004 was 31.02 and 4.00 and that for the last period (2012) was 28.25 and 4.29. About the effect of age-season of calving, as it is expected, it is observed that with increasing age of calving, though negligible, but continuously these values showed an increasing trend. For instance, predicted milk yield for different classes/categorizations of calving age, regardless of calving season, they are obtained 4.51, 5.16 and 5.84, respectively. The corresponding values for SCS were −1.52, −1.45, and −1.41, respectively.
Figure 1. Average daily milk yield (solid line) and somatic cell score (dashed line).
3.2. Variances and heritabilities
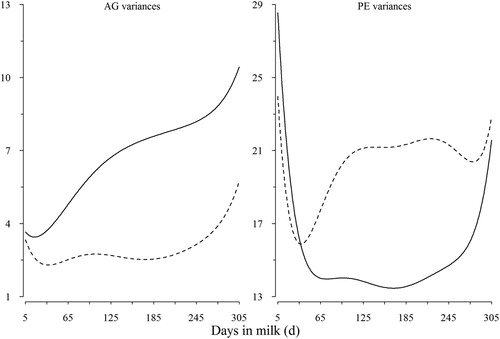
Additive genetic and PE variance components for TD records of milk yield and SCS are presented in . The additive genetic variance was increased as lactation progressed for milk yield and were highest in second half of lactation. For milk yield, it is obvious that the beginning and the end of lactation have higher PE variance than middle part. So, this curve was typically U-shaped. As indicated in these plats, AG variance for SCS was low at the peak of lactation, rose toward the middle of the second part of lactation, and then dropped to rise again at the end. With a few exceptions, PE of test day SCS was high in the beginning of lactation, low at the peak, and rose toward the end.
Figure 2. Daily genetic (AG) and permanent environmental (PE) variances for TD milk yield (solid line) and SCS (dashed line) over the lactation (variances for SCS are multiplied by 20).
Inspection of estimated heritability curves confirmed that the values were not constant throughout the lactation (). Heritability estimates, derived based on the (co)variances of RRC, along the lactation trajectory showed shapes similar to the genetic variation but were less extreme at the beginning and the end of lactation because of higher PE variances. Heritabilities for the first TD generally were lowest. This finding was not only attributable to high PE variance, but also to a rather small estimate of the AG variance. Heritability estimates for TD records were highest in second half of lactation and ranged from 0.086 to 0.250 for milk yield and 0.041–0.086 for SCS. indicates that estimates of heritabilities for TD records were smaller than the corresponding complete lactation (305-d).
Figure 3. Heritability for milk yield (solid line) and SCS (dashed line) over DIM.
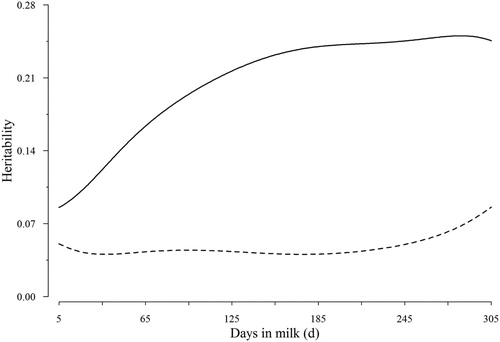
Table 3. Estimates of variance componentsa and the parameters derived from themb for complete lactation (5–305 days).
3.3. Genetic and PE correlations
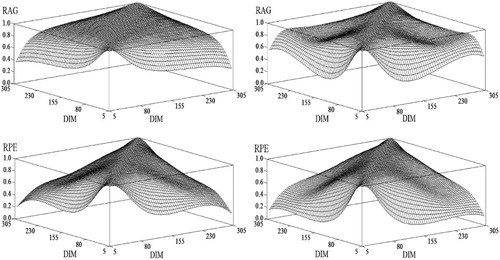
Within traits: Estimated genetic and environment correlations, calculated from (co)variance components, between TD milk yield or TD SCS at different stages of lactation are shown in . As expected, the pattern between genetic and environmental correlations is similar in that the correlations decrease as the distance between test days increase. As a consequence, genetic correlations obtained in this study were all positive (>0.30), even between yields at the extremes of the lactation trajectory.
Figure 4. Additive genetic (RAG) and permanent environmental (RPE) correlations between test-day milk yield (1st column), and test-day somatic cell scores (2nd column) at different stages of lactation for the same trait.
Between traits: Genetic and PE correlations between milk yield and SCS at different stages of lactation are presented in . Generally, the genetic correlations between these traits independent on how far apart they are and on whether they are on the same day in any two traits. For instance, the genetic correlation between milk yield DIM 305 and SCS DIM 305 is −0.006, while that between milk yield DIM 5 and SCS DIM 305 is 0.319. As a consequence, genetic correlation estimates between milk yield and SCS were small to moderate and ranged from −0.093 to 0.319. In the case of environmental correlation between these traits, our estimates were negative for most of the time and slightly higher than corresponding genetic correlations (ranged from −0.357 to 0.026).
Table 4. Additive genetic and PE correlations between milk yield and SCS for different days in milk.
Genetic trends
Phenotypic trend and estimated breeding values (EBV) of 305-day for milk yield and SCS by year of birth are presented in and the corresponding linear regression coefficients are given in . Phenotypic means and EBV of 305-day milk yield increased over the years. As shown in , in all case the genetic trend for milk yield was positive and has risen about 550 kg in 2010, so that according to it has been improved on average 50.45 kg/year during 2002–2010. This trend demonstrated the effectiveness of selection for improving milk yield. Phenotypic trends were in opposite directions for milk yield and SCS. Phenotypic means of SCS had a small variation and there was a decreasing trend from 2002 to 2010. On the other hand, there was a decreasing EBV of 305-day trend for SCS from 2004 to 2007, but there was no obvious variation in the concentrations of SCS thereafter. However, no significant genetic trend was observed for SCS.
Figure 5. Estimated of genetic (left) and phenotypic (right) trends for milk yield (solid line) and SCS (dashed line) of primiparous Holstein cows in Iran.
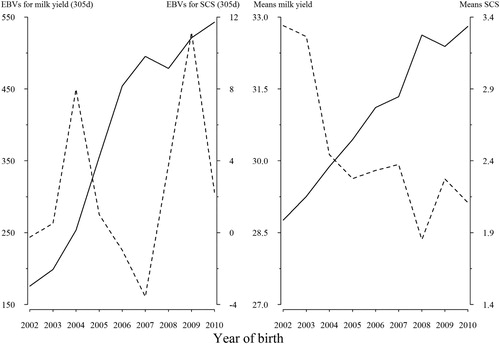
Table 5. Estimation of linear regression coefficients of animal estimated breeding values for 305-day milk yield and SCS.
4. Discussion
Although the decline in milk yield under high SCC may be compensated by an increase of overall production, the decline might be economically more important if it involves traits correlated with milk. The economic loss of SCC may be larger than that measured by milk yield only; for instance, because of increased mastitis susceptibility (Heringstad et al. Citation2000) and decreased cheese yield and shelf-life of consumer milk (Schutz Citation1994).
appears that AG variances for milk yield as a function of DIM increased toward the end of lactation. Some authors found the highest AG for milk yield at the beginning of lactation (Jamrozik and Schaeffer Citation1997; Bignardi et al. Citation2009; Pereira et al. Citation2013) but other studies (Swalve Citation1995; Druet et al. Citation2003; Kheirabadi et al. Citation2014) reported the lowest variance in this period. As expected, the PE variance estimates were consistently larger than AG estimates for both traits. For milk yield, decreasing PE variance during lactation suggest that PE factor had the low influence on TD milk yields during lactation except at the beginning and the end of lactation (Kheirabadi et al. Citation2013). A tendency for nearly resembled inverted PE variance of SCS revealed that environments or the effect of stress components suppress the efficiency of breeding programmes, if the estimate is for SCS only. Therefore, combination of associated traits can help to identify an optimal breeding scheme.
Ranges of heritabilities for milk yield across the lactation varied remarkably among previous studies. For instance, much higher and very low estimates of heritability can be found in the literature for Holstein in Canada (Jamrozik and Schaeffer Citation1997) and Polish Black and White cattle (Strabel and Misztal Citation1999), respectively. Strabel and Misztal (Citation1999) found a slightly lower heritability for milk yield, in the range of 0.13–0.17 and explained that this was because of the low production levels. The estimates of heritability obtained for milk yield in this study lie well in the range (0.05–0.30) reported in the literature (Yazgan et al. Citation2010; Pereira et al. Citation2013). In an earlier analysis of individual TD milk yield as separate traits in a RR model, heritabilities varied from 0.10 at DIM 5 to 0.21 at DIM 305 (Kheirabadi et al. Citation2013). The same pattern was also reported by Kheirabadi et al. (Citation2014) with a multiple trait RR models on the same population used in this study.
Estimates of daily heritability, genetic and PE variances for SCS were very similar to those of Kheirabadi (Citation2018). Daily SCS heritability was in agreement with other sources, which established that SCS was the least heritable at the beginning of lactation and most heritable in mid to late lactation (Haile-Mariam et al. Citation2001; Mrode and Swanson Citation2003; Ødegard et al. Citation2003; Yazgan et al. Citation2010). Kheirabadi and Alijani (Citation2014) also estimated small values of SCS heritabilities, especially in the first lactation (0.03–0.07).
Heritability estimates for completed lactation of milk and SCS (0.34 and 0.14, respectively) are in the range of reported estimates from other studies using linear models. Estimates obtained by Welper and Freeman (Citation1992) with Michigan data were 0.30 and 0.16 for the first lactation of milk and SCS, respectively. However, heritabilities of these traits for Iranian Holsteins were larger than those reported in primiparous Ontario Holstein cows (Reents et al. Citation1995). There are several factors that might influence level of heritability estimates. Among the many reasons which cause the differences in heritability estimates different models and different levels of yield are defined (De Veer and Van Vleck Citation1987).
appears that genetic correlations between daily milk and SCS independent on the interval between tests, however, it can be important. Generally, the pattern of correlations was similar to those reported in other studies (Jamrozik et al. Citation2010; Samoré et al. Citation2008), from mostly positive value in the genetic correlation to all negative correlations for PE. In general, phenotypic correlations are negative, whereas genetic correlations display a different sign, depending on lactation number (Samoré et al. Citation2008). The positive correlation means that genes that positively influenced milk production had direct effect on SCS. From these results, genetic selection for production should be expected to cause unfavourable increase in SCS level in Iranian Holstein. Based on the presented results, we can conclude that the cows with high yield potential in the initial stage of lactation had the highest genetic potential for SCS at the end of lactation (). A tendency for the association of lower values of the corresponding PE correlation, as found in the present study, also revealed that poor environmental do not suppresses the proportion of the genetic correlation.
Results of this investigation, based on genetic trends, indicate that more emphasis is paid to increase milk yield with no or a little emphasis on SCS. In other words, increasing trend for milk yield over time in this study maybe indicated that Iranian dairy producers were successful in choosing progressively better semen and sires from the imported and local source over the years. However, the irregular trend genetic trend in SCS, maybe provide future justification for including SCS in the Iranian national economic selection index. Similar to the current results, Khorshidie et al. (Citation2012) and Ghavi Hossein-Zadeh (Citation2011) reported trend was positive for milk yield of Iranian Holstein population. Those authors reported upward trends from 2000 onwards.
5. Conclusion
As a consequence, genetic and PE correlations between traits tended to be favourable level (close zero for genetic and >−0.25 for environmental) towards the end of lactation that it was clear between DIM 245 and 305. The magnitude and trend of the heritabilities and correlations may be suggested the improvement in the level of SCC (reduction) could be achieved by basing selection on yield potential of animals at the end of lactation.
Disclosure statement
No potential conflict of interest was reported by the author.
ORCID
Khabat Kheirabadi http://orcid.org/0000-0002-9979-5346
References
- Ali AKA , Shook GE. 1980. An optimum transformation for somatic cell concentration in milk. J Dairy Sci. 63:487–490. doi: 10.3168/jds.S0022-0302(80)82959-6
- Bignardi AB , El Faro L , Cardoso VL , Machado PF , de Albuquerque LG. 2009. Random regression models to estimate test-day milk yield genetic parameters Holstein cows in Southeastern Brazil. Livest Sci. 123:1–7. doi: 10.1016/j.livsci.2008.09.021
- Carlén E , Strandberg E , Roth A. 2004. Genetic parameters for clinical mastitis, somatic cell score, and production in the first three lactations of Swedish Holstein cows. J Dairy Sci. 87:3062–3070. doi: 10.3168/jds.S0022-0302(04)73439-6
- De Veer JC , Van Vleck LD. 1987. Genetic parameters for first lactation milk yields at three levels of herd production. J Anim Sci. 70:1434–1441.
- Druet T , Jaffrézic F , Boichard D , Ducrocq V. 2003. Modeling lactation curves and estimation of genetic parameters for first lactation test-day records of French Holstein cows. J Dairy Sci. 86:2480–2490. doi: 10.3168/jds.S0022-0302(03)73842-9
- Gilmore JA. 1977. The relationship of milk yield and other traits measured early in life to a dairy cattle profitability model including health and opportunity costs [PhD thesis]. Raleigh: North Carolina University.
- Haile-Mariam M , Goddard ME , Bowman PJ. 2001. Estimates of genetic parameters for daily somatic cell count of Australian dairy cattle. J Dairy Sci. 84:1255–1264. doi: 10.3168/jds.S0022-0302(01)74587-0
- Heringstad B , Klemetsdal G , Ruane J. 2000. Selection for mastitis resistance in dairy cattle: a review with focus on the situation in the Nordic countries. Livest Prod Sci. 64:95–106. doi: 10.1016/S0301-6226(99)00128-1
- Hortet P , Beaudeau F , Seegers H , Fourichon C. 1999. Reduction in milk yield associated with somatic cell counts up to 600 000 cells/ml in French Holstein cows without clinical mastitis. Livest Prod Sci. 61:33–42. doi: 10.1016/S0301-6226(99)00051-2
- Hossein-Zadeh NG. 2011. Genetic and phenotypic trends for age at first calving and milk yield and compositions in Holstein dairy cows. Arch Tierz. 54:338–347.
- Jamrozik J , Bohmanova J , Schaeffer R. 2010. Relationships between milk yield and somatic cell score in Canadian Holsteins from simultaneous and recursive random regression models. J Dairy Sci. 93:1216–1233. doi: 10.3168/jds.2009-2585
- Jamrozik J , Schaeffer LR. 1997. Estimates of genetic parameters for a test day model with random regression for yield traits of first lactation Holsteins. J Dairy Sci. 80:762–770. doi: 10.3168/jds.S0022-0302(97)75996-4
- Juozaitiene V , Juozaitis A. 2005. The influence of somatic cell count in milk on reproductive traits and production of Black-and-White cows. Vet Arhiv. 75:407–414.
- Juozaitiene V , Juozaitis A , Micikeviciene R. 2006. Relationship between somatic cell count and milk production or morphological traits of udder in black-and-white cows. Turk J Vet Anim Sci. 30:47–51.
- Kheirabadi K. 2018. Bayesian analysis of random regression models to model test-day somatic cell score of primiparous Holstein cattle in Iran. J Appl Anim Res. 46:677–684. doi: 10.1080/09712119.2017.1386107
- Kheirabadi K , Alijani S. 2014. Estimation of genetic parameters and genetic trends of somatic cell score in Iranian Holstein cows using test-day records. Iran J Appl Anim Sci. 4:707–716.
- Kheirabadi K , Alijani S , Zavadilová L , Rafat SA , Moghaddam G. 2013. Estimation of genetic parameters for daily milk yields of primiparous Iranian Holstein cows. Arch Tierz. 44:455–466.
- Kheirabadi K , Rashidi A , Alijani S , Imumorin I. 2014. Modeling lactation curves and estimation of genetic parameters in Holstein cows using multiple-trait random regression models. Anim Sci J. 85:925–934. doi: 10.1111/asj.12185
- Khorshidie R , Shadparvar AA , Ghavi Hossein-Zadeh N , Joezy Shakalgurabi S. 2012. Genetic trends for 305-day milk yield and persistency in Iranian Holsteins. Livest Sci. 144:211–217. doi: 10.1016/j.livsci.2011.11.016
- Kirkpatrick M , Lofsvold D , Bulmer M. 1990. Analysis of the inheritance, selection and evolution of growth trajectories. Genetics. 124:979–993.
- Misztal I. 2015. BLUPF90 family of programs. [accessed 2015 July 2]. http://nce.ads.uga.edu/html/projects/programs/Linux/64bit/ .
- Mrode RA , Swanson GJT. 1996. Genetic and statistical properties of somatic cell count and its suitability as an indirect means of reducing the incidence of mastitis in dairy cattle. Anim Breeding Abs. 64:847–857.
- Mrode RA , Swanson GJT. 2003. Estimation of genetic parameters for somatic cell count in the first three lactations using random regression. Livest Prod Sci. 79:239–247. doi: 10.1016/S0301-6226(02)00169-0
- Ødegard J , Jensen J , Klemetsdal G , Madsen P , Heringstad B. 2003. Genetic analysis of somatic cell score in Norwegian cattle using random regression test-day models. J Dairy Sci. 86:4103–4114. doi: 10.3168/jds.S0022-0302(03)74024-7
- Pereira RJ , Bignardi AB , El Faro L , Verneque RS , Vercesi Filho AE , Albuquerque LG. 2013. Random regression models using Legendre polynomials or linear splines for test-day milk yield of dairy Gyr (Bos indicus) cattle. J Dairy Sci. 96:565–574. doi: 10.3168/jds.2011-5051
- Reents R , Jamrozik J , Schaeffer LR , Dekkers JCM. 1995. Estimation of genetic parameters for test day records of somatic cell score. J Dairy Sci. 78:2847–2857. doi: 10.3168/jds.S0022-0302(95)76915-6
- Samoré AB , Groen AF , Boettcher PJ , Jamrozik J , Canavesi F , Bagnato A. 2008. Genetic correlation patterns between SCS and protein yield in the Italian Holstein Friesian population. J Dairy Sci. 91:4013–4021. doi: 10.3168/jds.2007-0718
- SAS Institute Inc . 2003. SAS 9.1.3 help and documentation. Cary (NC ): SAS Institute Inc.
- Schutz MM. 1994. Genetic evaluation of somatic cell scores for United States dairy cattle. J Dairy Sci. 77:2113–2129. doi: 10.3168/jds.S0022-0302(94)77154-X
- Strabel T , Misztal I. 1999. Genetic parameters for first and second lactation milk yields of Polish black and white cattle with random regression test-day models. J Dairy Sci. 82:2805–2810. doi: 10.3168/jds.S0022-0302(99)75538-4
- Swalve HH. 1995. Test day models in the analysis of dairy production data-a review. Arch Tierz. 38:591–611.
- Welper RD , Freeman AE. 1992. Genetic parameters for yield traits of Holsteins, including lactose and somatic cell score. J Dairy Sci. 75:1342–1348. doi: 10.3168/jds.S0022-0302(92)77885-0
- Yazgan K , Makulska J , Węglarz A , Ptak E , Gierdziewicz M. 2010. Genetic relationship between milk dry matter and other milk traits in extended lactations of Polish Holstein cows. Czech J Anim Sci. 55:91–104. doi: 10.17221/49/2009-CJAS