
ABSTRACT
Forty-six Dorper, 46 Katahdin, and 43 St. Croix female sheep from four regions of the USA were used to evaluate responses to high heat load index (HLI) conditions. There were sequential 2-wk periods with target HLI during day/nighttime of 70/70 (thermoneutral zone conditions), 85/70, 90/77, and 95/81. Rectal temperature (RT) and respiration rate (RR) were measured at 07:00 (before daytime), 13:00, and 17:00 h (preceding nighttime). Region had few and minor effects. Intake of DM (g/day) was not influenced by period. Rectal temperature was considerably less for St. Croix than for Dorper and Katahdin at each time, with differences increasing as period advanced. Similarly, RR in periods 2, 3, and 4 was least for St. Croix, particularly at 07:00 h in period 4. Moreover, RT was slightly less for Katahdin vs. Dorper in period 4 at 13:00 and 17:00 however, RR was less for Katahdin than for Dorper in periods 3 and 4. Variance in RT in periods 3 and 4 ranked St. Croix < Dorper < Katahdin. In conclusion, based on RT and RR, resilience to high HLI conditions ranked St. Croix > Katahdin > Dorper, with lowest variability among individuals for St. Croix and greatest for Katahdin.
KEYWORDS:
1. Introduction
Heat stress is a major constraint to animal productivity (Shelton Citation2000). The future climate is expected to be more variable, with greater frequencies and intensities of very hot periods, drought, and floods. The rate at which the climate is changing is likely to impose overwhelming pressure on existing adaptation capacity of ruminant livestock raised outdoors with exposure to natural environmental conditions. Therefore, it would be useful to characterize resilience of livestock resources available today to stress conditions expected to increase in importance with anticipated climate change in the future.
Hair sheep have been gaining in popularity in the USA because of factors including relatively low value of wool, no need for shearing, and hardiness with harsh environmental conditions relative to common wool breeds (Wildeus Citation1997). Moreover, hair sheep are easier to contain in grazing areas compared with goats (Hart and Potraz Citation2015) and are more resistant to internal parasites (Burke and Miller Citation2004), although each species is better suited for different vegetation conditions (Gruner Citation1991). The most common hair sheep breeds in the USA are Dorper, Katahdin, and St. Croix (Thomas Citation1991). There is anecdotal evidence of differences in resilience to common production system stress factors, but few direct comparisons under controlled conditions are available.
Evaluation of breeds of livestock is most useful when animals represent a broad genetic base. Furthermore, environmental conditions that animals are raised under can influence physiological conditions, resulting in different ‘ecotypes’, and of course the number of animals should be high to address variability among individuals. Hence, objectives of this experiment were to evaluate the responses in body weight, feed intake, rectal and skin temperature, respiration rate, and panting score of different hair sheep breeds, Dorper, Katahdin, and St. Croix, from multiple commercial farms in four geographical regions of the USA to high heat load conditions.
2. Materials and methods
2.1. Animals, housing, and diet
The protocol for the experiment was approved by the Langston University Animal Care and Use Committee. Forty-six Dorper (DOR), 46 Katahdin (KAT), and 43 St. Croix (STC) female sheep from 47 commercial farms were used. Animals were from 15, 15, and 17 DOR, KAT, and STC farms, respectively. They were obtained in the summer of 2015 from four regions of the USA with different climatic conditions, representing ‘ecotypes’. Regions were the Midwest (portions of Iowa, Minnesota, Wisconsin, and Illinois), Northwest (primarily Oregon with one farm in southern Washington and another near Seattle), Southeast (Florida and one farm in southern Georgia), and central Texas. One farm had two separate flocks of the same breed, and there were two farms with flocks of two breeds. Most animals were ewes when procured, although a small number were lambs. Age at the start of the trials averaged 3.3 ± 0.18 yr, ranging from 2.6 to 3.7. The number of animals per breed and region ranged from 8 to 13, although for 10 of the 12 breed × region treatments the number was 9–12. The number of animals per farm ranged from one to six, although there were only two farms from which one animal was obtained and two farms providing six animals. In this regard, for all but one breed × region treatment, animals were from three to five farms. There was one breed and region where sheep were derived from two farms (six animals from each) as a result of a third farm with which prior arrangements had been made deciding against the sale very near the time of transportation.
The experiment consisted of four trials conducted in the fall of 2015, spring and fall of 2016, and spring of 2017. The animals were evaluated in one of the four trials because of the maximum number that could be housed in the research facility, with designation as different animal sets. Animal sets consisted of 32–35 animals, originating from 20 to 30 farms. There were 12, 7, 9, and 8 DOR, 11, 9, 8, and 6 KAT, and 7, 9, 8, and 7 STC in animal sets 1, 2, 3, and 4, respectively. Correspondingly, there were 10, 8, 6, and 5 MW, 8, 7, 6, and 6 NW, 7, 5, 6, and 5 SE, and 5, 5, 7, and 4 TX animals in sets 1, 2, 3, and 4, respectively.
Animals were vaccinated with Covexin® 8 (Schering-Plough Animal Health, Kenilworth, NH, USA) before trials. Average body length from the point of the shoulder to the pin bone, wither height, and heart girth measurements were 75.8, 67.6, and 98.5 cm for DOR, 72.9, 70.9, and 98.8 cm for KAT, and 70.7, 69.5, and 91.8 cm for STC, respectively. After removing excess hair from a small number of animals, average hair length at the beginning of the study was 22.7, 35.7, and 38.3 mm for DOR, KAT, and STC, respectively. Though not characterized, the hair of STC seemed much less dense than that of DOR and KAT.
The procedures employed were largely based on the study of Mengistu et al. (Citation2017). Animals were housed in one room individually in elevated pens with a plastic-coated expanded metal floor. There was a plastic barrel for feed and a bucket for water fitted to the front of pens. A 50% concentrate pelleted diet () was fed at 53.3 g dry matter (DM)/kg body weight0.75, which was approximately 120% of an assumed metabolizable energy requirement. Conversely, a diet primarily of moderate quality forage was used by Mengistu et al. (Citation2017). The one chosen for the current research was to minimize variability in diet composition among the four trials at different times with the four animal sets. Feed was offered twice daily at 08:00 and 15:00 h. Animals had free access to small pieces of trace mineralized salt blocks (96.5–99.5% NaCl, 4000 mg/kg Zn, 1600 mg/kg Fe, 1200 mg/kg Mn, 260–390 mg/kg Cu, 100 mg/kg I, and 40 mg/kg Co) placed in feed barrels and tap water.
Table 1. Ingredient and chemical composition of the diet.
2.2. Temperature and humidity conditions
Black globe temperature (BG; °C) and relative humidity (RH; %) were recorded every 15 min with a heat stress metre (Model SD-2010, REED Instruments, Wilmington, NC, USA) situated in the centre of the room. Heat load index (HLI) was calculated as proposed by Gaughan et al. (Citation2010) for temperatures above 25°C: HLI = 8.62 + 0.38 × RH + 1.55 × BG – 0.5 × WS + e((2.4 – WS)), with WS = wind speed (m/s; assumed zero) and e = base of the natural logarithm. In addition, five HOBO U12-011 data loggers (Onset Computer Corp., Bourne, MA, USA) placed at different locations inside the room were used to continuously monitor temperature and relative humidity. One digital thermo-anemometer (Model SD-4207, REED Instruments) was used to verify little to no wind. The trials occurred in the fall and spring periods before the outside temperature became very low and high, respectively, which allowed condition control by adjustments of multiple natural gas heaters, humidifiers, and misters. Also, a temperature-humidity index (THI) was calculated with the formula of Amundson et al. (Citation2006): (0.8 × oC) + (RH/100) × (oC − 14.4) + (46.4).
The entire study period was 10 wk, with the first week for adaptation to the facility and thermoneutral conditions and the last week for readjustment to thermoneutral conditions. Animal measurements occurred in the 8-wk experiment, with four 2-wk periods. Target HLI during the daytime was of 70, 85, 90, and 95 and that in nighttime was 70, 70, 77, and 81 in periods 1, 2, 3, and 4, respectively. In higher HLI periods, the target level of HLI during nighttime was approximately 85% of HLI during daytime, similar to that of Hamzaoui et al. (Citation2013). Daytime conditions were between 07:00 and 19:00 h. Mean values for temperature, RH, HLI and THI are presented in .
Table 2. Temperature, relative humidity (RH), heat load index (HLI), and temperature-humidity index (THI) conditions,
2.3. Measurements
Animals were weighed three times weekly (Monday, Wednesday, and Friday), and for approximately 2 h thereafter one-half of the animals of each set were given free access to a partitioned area for exercise with the same HLI on alternating weigh days before being returned to individual pens. Body condition score (Ngwa et al. Citation2007, pp. 1–5, with 1 = very lean and 5 = extremely obese) was determined at the beginning and end of periods.
Rectal temperature (RT), skin temperature (ST), respiration rate (RR), and panting score (PS) were recorded every Thursday at 07:00, 13:00, and 17:00 h. Rectal temperature was measured with a Vicks® Digital Thermometer (Model V900G, Hudson, NY, USA). Respiration rate was determined by counting movements of the flank for 15 s and conversion to a 1-min basis. Skin temperature was recorded with a Fisher Scientific™ Traceable™ Noncontact Infrared Thermometer (Waltham, MA, USA) at an area of the right shoulder shaved at the beginning of the experiment with Öster clippers (McMinnville, TN, USA) fitted with a size 40 blade.
The PS was very similar to one used for beef cattle by Mader et al. (Citation2006) and Gaughan et al. (Citation2010), ranging from 0 (no stress/no panting) to 4.5 (extreme stress/elevated panting). However, based on results of Mengistu et al. (Citation2017) and observations in the first trial, some slight modifications were made for sheep, and relationships between RR and PS varied slightly as well. The descriptions for PS observed in this experiment were: 0 = no panting, normal breathing and difficult to see chest movement; 1 = slight panting, easy to see chest movement, mouth closed, and no drool; 2 = moderate panting, easy to see chest movement, and occasionally mouth open enough to see teeth; 2.2 = fast panting, easy to see chest movement, occasionally mouth open enough to see teeth and tongue inside, and possibly a small amount of drool from nose; and 2.4 = fast panting, most often can see teeth and tongue inside mouth, occasional open mouth, and possibly small amount of drool from nose.
Orts were collected and weighed in the morning when present. Feed was sampled two or three times per week when new batches of feed were moved to the facility and used to form eight weekly composite samples. Samples were ground to pass a 1-mm screen and analysed for DM, ash (AOAC Citation2006), nitrogen (LecoTruMac CN, St. Joseph, MI, USA), gross energy using a bomb calorimeter (Parr 6300; Parr Instrument Co. Inc., Moline, IL, USA), and neutral detergent fibre expressed inclusive of residual ash (Van Soest et al. Citation1991) with the addition of a heat-stable alpha amylase and sodium sulfite and an ANKOM200 Fiber Analyzer (filter bag technique; ANKOM Technology Corp., Fairport, NY, USA).
2.4. Statistical analyses
Data were analysed using mixed effects models with SAS (Littell et al. Citation1996; SAS Citation2011). For many variables fixed effects were animal set, initial age as a covariate, breed, region, period, week within period, and all interactions other than ones involving animal set and age. Period was a discrete rather than continuous variable. Body weight, determined 3 days each week, was averaged over day. Period × week was the repeated measure and the subject was animal within breed × region × period. Different covariance structures were compared via Akaike’s Information Criterion, but values were lower for variance components or differences were not marked. For measures such as RT, RR, and PS determined three times daily, hour and all interactions were included in the model, with the repeated measure of period × week × hour and subject of animal within breed × region × period × week. There were numerous interactions involving hour; therefore, the analysis was subsequently conducted by hour with the reduced model noted above. Means were separated by least significant difference when the treatment F-test was significant (P < 0.05). Interaction means are addressed when there was an interaction (P ≤ 0.057), and breed and region main effect means are presented when not involved in an interaction even if the main effect was not significant. Figures were used in some cases to address interactions, with periods listed on the X-axis, even though it again is a fixed and discrete variable. Likewise, to most clearly address interactions involving period and week only, having a separate line for each week was preferred rather than having one line, with week as well as period on the X-axis.
Pearson correlation coefficients (r) were determined to evaluate relationships among variables. The Bartlett test was employed to assess the potential impact of HLI conditions on variability in RT, ST, and RR for the different breeds at the three measurement times. The Spearman’s rank correlation coefficient (sr) was used to evaluate consistency in the ranking of animals in the same variables at different times of the day, both overall and within breed.
3. Results
3.1. HLI conditions
As noted in , HLI values in the periods were fairly close to those intended. Although, values generally were slightly greater than targets, moreso in the night- than daytime and in period 2 than at other times.
3.2. Body weight and DM intake
Animal set influenced body weight (BW) and DM intake in g/day and % BW (P < 0.001) but not in g/kg BW0.75 (). Conversely, initial age only affected DM intake in g/kg BW0.75 and % BW (P ≤ 0.019). To the extent possible, numbers of sheep of different breeds and from the four regions were similar among animal sets. However, there were some small deviations as a result of the scheduling of these and other trials of this overall project concerning resilience to limited water and feed availability and delayed use of relatively young animals so as to minimize the potential impact of age. There were a number of significant main effects on BW and DM intake, and the only significant interaction was between period and week for BW.
Table 3. P-values of the model for BW, body condition score, and DM intake.
As expected, BW of STC was less than of DOR and KAT (P < 0.05), and BW of sheep from the Southeast was less than of sheep from the Midwest and Northwest (P < 0.05; ). However, it should be noted that some differences among regions may be due to slight deviations in the number of animals of the three breeds. Body condition score was lower for STC vs. DOR and KAT (P < 0.05) and lower in periods 1 and 2 vs. 4 (P < 0.05).
Table 4. Effects of hair sheep breed and region on BW, body condition score, and DM intake.
Since feed consumption was complete on most days, DM intake was similar among breeds and regions in g/kg BW0.75 and less for STC vs. DOR and KAT in kg/day and % BW (P < 0.05; ). The period × week interaction in BW appeared due to a slightly greater general increase in values in wk 2 vs. 1 with advancing period (). Intake of DM in kg/day was less in period 4 vs. 1 and 2, which contributed to differences among periods in values in g/kg BW0.75 and % BW along with increasing BW as period advanced. The difference between weeks in DM intake in g/kg BW0.75 and % BW relates to generally greater BW in wk 2 vs. 1.
Table 5. Effects of 2-wk period with increasing heat load index and week within period on BW, body condition score, and DM intake.
3.3. RT
As noted earlier, there were numerous interactions in RT and RR involving the time of measurement (), which led to separate analyses for each time. For RT, there were breed × period and period × week interactions at 07:00 (P = 0.036 and 0.034), 13:00 (P = 0.003 and 0.001), and 17:00 h (P < 0.001 and <0.001, respectively), with means for the former interaction shown in . The magnitude of change in RT with advancing period ranked 07:00 < 13:00 < 17:00 h. Rectal temperature was lower for STC than for DOR and KAT in periods 2, 3, and 4 at 13:00 and 17:00 h, and this also was observed at 07:00 h in periods 3 and 4. The magnitude of increase in RT with advancing period was greater for DOR and KAT than for STC. For STC, RT at 07:00 h was steady among periods. Conversely, at 13:00 and 17:00 h values increased from periods 1 to 3 and from period 3 to 4 at 17:00 h.
Figure 1. Rectal temperature of hair sheep breeds at 07:00, 13:00, and 17:00 h in periods with increasing heat load index. DOR = Dorper, KAT = Katahdin, and STC = St. Croix.
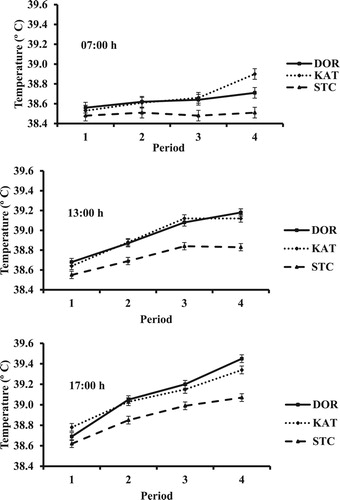
Table 6. P-values for full model analysis of rectal and skin temperature, respiration rate, and panting score.
Although RT was more similar between DOR and KAT relative to comparisons with STC, there were some interesting differences (). Values were similar between breeds at each time in periods 1, 2, and 3. However, in period 4 RT at 17:00 h was lower for KAT vs. DOR. At 13:00 h, RT for KAT was similar in periods 3 and 4 but for DOR the value was greater in period 4 than 3. Conversely, RT at 07:00 h in period 4 was considerably greater for KAT than for DOR. In this regard, magnitudes of change in RT as time of the day advanced differed among breeds, with increases from 07:00 to 13:00 h and from 13:00 to 17:00 h of approximately 0.47 and 0.27°C for DOR, 0.22 and 0.22°C for KAT, and 0.32 and 0.24°C for STC, respectively. Hence, differences in RT between lowest values at 07:00 h and highest ones at 17:00 h ranked, from least to greatest, KAT, STC, and DOR (i.e. 0.44, 0.56, and 0.74°C, respectively).
There was an interaction (P = 0.024) between breed and region in RT at 07:00 h ( and ). Although differences primarily responsible are difficult to discern, only for the Northwest region was the value for STC lowest among all breeds (P < 0.05). Main effect means at 13:00 and 17:00 h are shown in and because of tendencies for a region effect (P = 0.056 and 0.086, respectively).
Table 7. P-values for the analysis by time of rectal and skin temperature, respiration rate, and panting score.
Table 8. Effects of hair sheep breed and region, 2-wk period with increasing heat load index, and week within period on rectal and skin temperature and respiration rate at 07:00 h before heat load index was increased during the daytime.
Table 9. Effects of hair sheep breed and region, 2-wk period with increasing heat load index, and week within period on rectal and skin temperature, respiration rate, and panting score at 13:00 h1.
Table 10. Effects of hair sheep breed and region, 2-wk period with increasing heat load index, and week within period on rectal and skin temperature, respiration rate, and panting score at 17:00 h before heat load index was decreased during the nighttime1.
3.4. ST
Skin temperature was not influenced by breed or region at any time (–). Skin temperature was affected by the period at 07:00 h ( and ). At 07:00 h, ST ranked period 1 < 2 < 3 and 4, and all values were considerably less than at 13:00 and 17:00 h.
3.5. RR
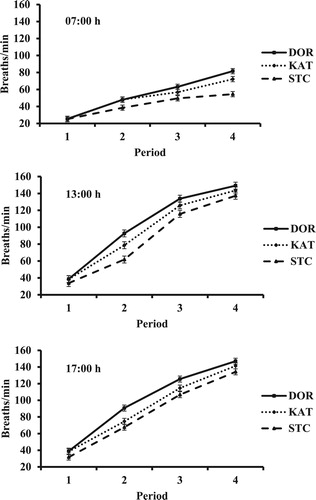
The breed × period interaction in RR was significant at 07:00 (P < 0.001) and 13:00 h (P = 0.047), as depicted in . Because of a similar tendency for a breed × period interaction (P = 0.057) in RR at 17:00 h, interaction means are also shown in . Nonetheless, the breed main effect mean at 17:00 h was greatest for DOR (P < 0.05; ). Respiration rate at each time of measurement increased with advancing period. However, the magnitude of change in RR at 07:00 h as HLI increased was less for STC than for DOR and KAT. In accordance, the difference in RR between STC and the other two breeds in period 4 was considerably greater at 07:00 h than at 13:00 or 17:00 h. Respiration rate was similar among breeds in period 1 at all times, although the value for STC at 17:00 h tended to be lowest (38.9, 38.5, and 31.8 breaths/min for DOR, KAT, and STC, respectively; SEM = 3.62). Respiration rate ranked STC < KAT < DOR in periods 2, 3, and 4 at most times, except for similar values at 07:00 h for DOR and KAT.
Figure 2. Respiration rate of hair sheep breeds at 07:00, 13:00, and 17:00 h in periods with increasing heat load index. DOR = Dorper, KAT = Katahdin, and STC = St. Croix.
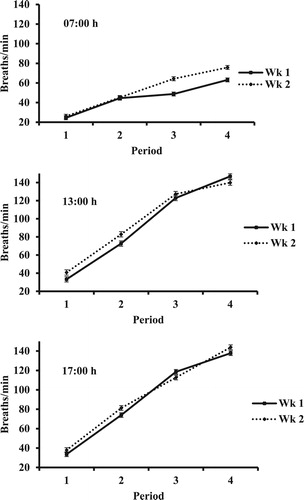
There was a period × week interaction in RR measured at each time (P ≤ 0.001; and ). However, the largest difference in interaction means with measurement at 13:00 and 17:00 h was only 10.2 breaths/min. Conversely, at 07:00 h RR was similar between weeks in periods 1 and 2 but 15.6 and 12.7 breaths/min lower in wk 2 vs. 1.
Figure 3. Respiration rate of hair sheep at 07:00, 13:00, and 17:00 h in weeks of periods with increasing HLI.
3.6. PS
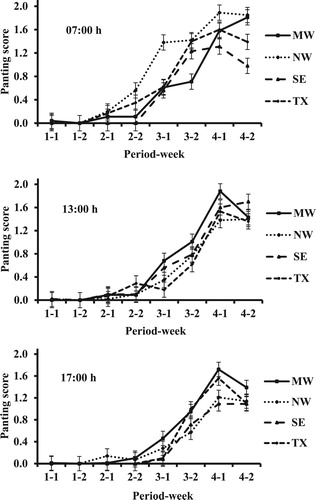
Although most PS at 07:00 h were 0, there was a breed × period × week interaction (P = 0.022; and ). One reason for this is a greater increase for DOR from period 3 to 4 in wk 2 vs. 1. The same was true for KAT, although the magnitude of difference between wk-2 values in period 4 was less than for DOR. There was a breed × region × period × week interaction in PS determined at 13:00 h (P = 0.005; and ). Although multiple factors contributed to this interaction, it was notable that in period 4 values in wk 2 were generally lower in wk 1, which was not true for other periods. There were interactions in PS at 17:00 h between breed and week (P = 0.028) and period and week (P = 0.001; ). The first interaction was mainly because of a greater difference between weeks for DOR (greater in wk 2 vs. 1) than for the other breeds. The latter interaction was due primarily to fairly similar weekly values of periods 1, 2, and 4 but a greater mean in wk 2 vs. 1 of period 3.
Figure 4. Panting score of hair sheep breeds at 07:00 h in wk 1 and 2 of periods with increasing HLI. DOR = Dorper, KAT = Katahdin, and STC = St. Croix.
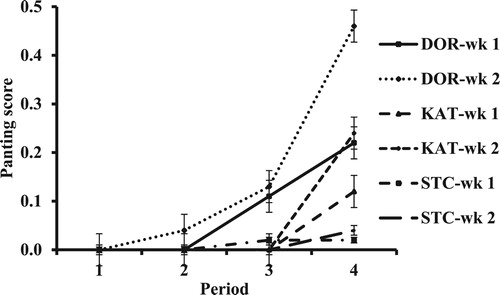
Figure 5. Panting score at 13:00 h of Dorper, Katahdin, and St. Croix sheep from different regions in the weeks of periods with increasing HLI. MW = Midwest; NW = Northwest; SE = Southeast; TX = central Texas.
3.7. Relationships among variables, variance, and ranking
Relationships among measurements at the different times of the day and overall are presented in . The r between RT and RR was significant at each time, but the value at 07:00 h was much less than at 13:00 and 17:00 h. The same is true for relationships between RT and PS, although the r for PS was considerably greater at 17:00 vs. 13:00 h. Rectal temperature and ST were not correlated at 07:00 h, but there were significant and moderate r at 13:00 and 17:00 h. Even though PS was generally low at 07:00 h, there was a moderate correlation with RR at that time, with higher r at 13:00 and 17:00 h. There were similar relationships between PS and ST at different times.
Table 11. Relationships between rectal and skin temperature, respiration rate, and panting score.
Variation in RT at each time of measurement was similar among breeds in period 1 with lowest HLI conditions (). This was true in period 2 for RT determined at 13:00 and 17:00 h. For RT at 17:00 h, variation was not homogeneous among breeds and ranked DOR < STC < KAT. Variance in RT at each time was nonhomogeneous in periods 3 and 4, being lowest for STC and highest for KAT. In all but one instance, SD was lowest among times at 07:00 h. In contrast to RT, variance in ST was homogeneous among breeds in all periods and at each time.
Table 12. Homogeneity of variance in rectal and skin temperature and respiration rate at different times in the second week of 2-wk periods with increasing heat load index.
As opposed to RT, there was homogeneity of variance in RR among breeds in periods with elevated HLI conditions at all measurement times except for 17:00 h in period 2, whereas variance was not homogeneous in period 1 at any time (). Variation in period 1 was lowest among breeds for STC at 13:00 and 17:00 h and was slightly lower for STC than for DOR at 07:00 h.
The sr for RT between periods 1 and 2 was significant at each time for all animals and each breed (). This was also true for sr between periods 1 and 3, although there were a number of nonsignificant sr between periods 1 and 4. Similarly, there was only one P-value for the sr between periods 2 and 3 that was not less than 0.05 (i.e. 0.091) compared with four between periods 2 and 4. All sr between periods 3 and 4 were significant except for that at 07:00 h for DOR.
Table 13. Spearman rank correlation coefficients (sr) for rectal and skin temperature and respiration rate in the second week of 2-wk periods at different times of the day between periods with increasing heat load indexa.
For ST, all sr between periods were significant except for one at 07:00 h (). Conversely, there was only one significant sr between period 1 and periods 2, 3, and 4. All sr at 13:00 and 17:00 h between periods 3 and 4 were significant.
All sr for RR at 07:00 h between periods 1 and 2 were significant, but most between periods 1 and 3 were not (). There were many sr for RR at 13:00 and 17:00 h between period 1 and other periods that were not significant. Conversely, all sr for RR between periods 2, 3, and 4 were significant except for one at each time.
4. Discussion
4.1. HLI and THI conditions
The upper critical temperature of wool sheep is 25–30°C, with heat stress incurred at temperatures above 30°C (Fuquay Citation1981), although humidity is important as well. Relatedly, Marai et al. (Citation2007) reviewed sheep literature indicating that a THI of 84–86, comparable to that during the daytime in period 4 of the present experiment, reflects severe heat stress and THI greater than 86 extreme severe heat stress. Hence, daytime THI in the present experiment of 82.9 and 85.7 in periods 3 and 4, respectively, appear appropriate for evaluating resilience of hair sheep to high HLI without imposing excessive stress. Similar to the scheme used by Alhidary et al. (Citation2012), to simulate typical production conditions, nighttime HLI was slightly less for dissipation of body heat stored during the day with higher HLI (Hahn Citation1999; Nienaber and Hahn Citation2007). Moreover, the 2-wk periods should have been adequate for adaptation of physiological processes to achieve heat balance given a 3- to 4-d lag noted in cattle (Hahn Citation1999). The magnitude of increase in RT in response to high HLI conditions in periods 3 and 4 was similar to change of 0.6–0.7°C observed in sheep of other studies (Hofman and Riegle Citation1977; Alhidary et al. Citation2012).
4.2. Region
There were some effects and interactions involving region, but overall, the region did not have marked or consistent effects. Animals were derived from areas of the USA with different environmental conditions because of potential influence on resilience to high HLI and associated genetic characteristics due to adaptation. However, there are some other considerations for attention. One is that because of relatively small numbers of farms in the country with these breeds of hair sheep and ‘premier’ or ‘foundational’ flocks providing breeding stock to producers in other areas, it is possible that some animals in the study were progeny of ones from another region. Moreover, the evaluation of resilience occurred over a fairly long period of time after the animals were obtained (i.e. approximately 1.5 yr), being subjected to the same environmental conditions at the farm of the American Institute for Goat Research of Langston University and inclusive of evaluation for resilience to limited availability of water and feed as well. This could have lessened initial differences in physiological processes arising from adaptation to the earlier unique environmental conditions.
4.3. BW
Effects of heat stress on BW are variable and influenced by many factors. Decreases (Alhidary et al. Citation2012; Mengistu et al. Citation2017), increases (Bernabucci et al. Citation2009), and little to no change (Srikandakumar et al. Citation2003) have been observed. Decreases seem more likely with young vs. mature animals because of the greater basal metabolic rate (Blaxter Citation1962; NRC Citation2007; Mahjoubi et al. Citation2014) and associated potential impact on anabolism and catabolism rather than only on catabolism in mature animals (Marai et al. Citation2007). Decreased BW has occurred both with and without change in DM intake (Dixon et al. Citation1999; Mahjoubi et al. Citation2014), with the sum effect depending on the magnitude of increase in energy use for heat dissipation via elevated heart and respiration rates. In addition, decreased blood flow to the gastrointestinal tract with heat stress can adversely impact integrity of the epithelium for increased endotoxin absorption that increases energy expended for maintenance of immunity metabolic machinery and(or) mounting of an immune response (Wang et al. Citation2016).
The increase in BW from wk 1 to 2 and as period of the experiment advanced reflects in part ad libitum and presumably increasing water intake with rising HLI and adaptive processes occurring within periods. Thus, the results are relevant to environments with both high HLI and ample water availability. Similar research with limited water access for extrapolation to other production settings is desirable, although experimentation to determine most appropriate HLI conditions and level of water offered would be required.
Although water intake was not measured, increased consumption is a normal response to heat stress for increased evaporative heat loss primarily through respiration that typically accounts for 60–65% of heat dissipation by sheep under heat stress conditions, with a lesser contribution without heat stress (Marai et al. Citation2007). Moreover, increases in water intake can be quite substantial. For example, Savage et al. (Citation2008) noted increases in water intake of 1.35, 2.67, and 4.34 l/day and 26, 46, and 78% by 3-yr-old Merino wethers subjected to 40°C during daytime and 30°C at night compared with exposure to 20°C continuously and offering of water at a temperature of 20, 30, and 40°C, respectively.
The study of Bernabucci et al. (Citation2009) provides an example of results similar to those of the current experiment, with BW of Sardinian ewes increasing over time in response to high HLI conditions. The effect was explained by increased water intake and decreased digesta passage rate, the latter most likely corresponding to increased mass of digesta in the gastrointestinal tract (Faichney and Barry Citation1986; Silanikove Citation1992). In some cases increased digesta retention time due to high HLI appears a consequence of decreased feed intake (Kadzere et al. Citation2002), but in others change is independent (Miaron and Christopherson Citation1992), as may have been the case in the present experiment. However, digesta passage rate in ruminant livestock is not always affected by elevated HLI conditions (Atteberry and Johnson Citation1969; Miaron and Christopherson Citation1992; Bernabucci et al. Citation1999).
4.4. DM intake
As for BW, the adverse effect of high HLI conditions on feed intake by ruminant livestock is common but not a universal effect, being dependent on the specific circumstances. Of course the overall reason for a decline in intake is to lessen heat produced in nutrient metabolism (heat increment) and associated with basal metabolism (i.e. fasting heat production or net energy for maintenance; Hahn Citation1999; Marai et al. Citation2007; Nienaber and Hahn Citation2007). In accordance, in the experiment of Mengistu et al. (Citation2017) DM intake decreased as HLI increased except for apparent adaptation by Katahdin sheep wethers with increased intake in the last two periods to partially compensate for earlier declines. Reasons for disparate results between the studies include the nature of the diets, with ad libitum consumption of moderate quality grass hay by wethers of Mengistu et al. (Citation2017) vs. offering a set and limited amount of the concentrate-containing pelleted diet in the current experiment. Previous studies have shown a greater likelihood of decreased intake of forage-based than mixed concentrate-forage diets under heat stress conditions because of the greater heat increment or lower efficiency of energy metabolism with forage-based diets (Beatty et al. Citation2006; Marai et al. Citation2007; Al-Dawood Citation2017). A decreased metabolic rate also lessens the water requirement for metabolism (Degen and Shkolnik Citation1978; Teixeira et al. Citation2006) and, thus, would increase that available for use in heat dissipation.
4.5. RT, ST, RR, and PS
4.5.1. Time of the day
Ruminants as well as other mammals have capacity to ‘store’ considerable heat in the body during the day when HLI generally is elevated and for relatively high dissipation in the evening with cooler conditions (Lu Citation1989; Silanikove Citation2000; Srikandakumar et al. Citation2003; Al-Tamimi Citation2007; Chedid et al. Citation2014; Sunagawa et al. Citation2015). Period × week RR means, in particular marked differences between weeks in 07:00-h values of periods 3 and 4, suggest that cumulative effects of high HLI conditions have relatively greater impact on dissipation during nighttime of stored heat than during the daytime when HLI is higher. Differences among times of measurement in RT SEM also could reflect greater variability in physiological mechanisms involved in nighttime dissipation of stored heat than in capacity for heat storage and dissipation with high HLI conditions during the day (i.e. breed × period SEM of 0.054, 0.037, 0.038°C at 07:00, 13:00, and 17:00 h, respectively).
4.5.2. STC vs. other breeds
Based on RT and RR, STC appeared more tolerant of high HLI than DOR or KAT. This is partially indicated by differences in RT in periods 2, 3, and 4 at 17:00 h when HLI had been high for nearly the entire daytime period. Only at 17:00 h was RT in period 4 greater than in period 3 for each of the breeds, although the difference was less for STC (0.08°C) than for DOR (0.25°C) and KAT (0.19°C). The greatest breed difference in RR between STC and the others in period 4 at 07:00 h could reflect the least need for nighttime dissipation of stored heat by STC. With an assumed direct relationship between RR and energy use for heat dissipation, the efficiency of energy utilization was highest for STC and lowest for DOR.
High heat tolerance of STC could relate to a higher ratio of surface area to BW. Based on the equation of Bennett (Citation1973) of 0.094 × kg BW0.75, yielding surface area of 1.46, 1.48, and 1.24 m2, surface area:BW was 0.02433, 0.02421, and 0.02635 m2/kg BW for DOR, KAT, and STC, respectively. Similarly, Mengistu et al. (Citation2017) postulated how the lower ratio of surface area to BW of KAT sheep than Boer and Spanish goat wethers could have had opposite effects on cutaneous heat dissipation through sweating and heat gained from convection, the magnitude of which would depend on factors such as specific HLI conditions. Differences in body conformation among breeds of the present experiment could have impact as well. For example, the legs and ears of sheep account for considerable surface area and, as such, with high temperature (≥36° C) they become increasingly important to heat dissipation (Johnson Citation1987). Though not specifically assessed, with wither height of 67.6, 70.9, and 69.5 cm for DOR, KAT, and STC, respectively, and lowest BW for STC, the proportion of surface attributable to legs may have been greatest for STC.
Factors that may have contributed to considerable resilience of STC to high HLI conditions apart from the surface area: BW ratio include physiological conditions such as blood flow to different tissues and organs, level and the location of body fat, and conduciveness of the fibre coat to evaporative heat loss. Marai et al. (Citation2007) summarized a large number of studies with elevated HLI conditions in which both RT and ST were measured. The degree to which ST was lower than RT was similar to that in the present experiment. Greater change in ST vs. RT with increasing HLI conditions relates to heat dissipation from the skin through evaporation with sweating. The similar ST at each time in periods 3 and 4 and no effects of breed suggest that evaporative heat dissipation through the skin was maximal, although this does not imply that there were not any differences in heat loss via this avenue. Nonetheless, with increasing RR as period advanced, it would appear that evaporative heat loss via respiration was of relatively greater importance in periods 3 and 4 than earlier. Moreover, the magnitude of increase in RR with increasing HLI was greater than observed in many studies with wool sheep (Marai et al. Citation2007; Beatty et al. Citation2008; Alhidary et al. Citation2012), although there do not appear to be direct comparisons available.
Though body condition score was lower for STC than for DOR and KAT, the mass and location of insulating fat, which can influence heat transfer, was not characterized. Even so, Degen and Shkolnik (Citation1978) noted that fat-tailed Awassi sheep with relatively little subcutaneous fat dissipated more heat through non-evaporative means (i.e. convection or ‘dry heat’) compared with sheep of the German Mutton Merino breed. As noted before, fibre length at the beginning of the current study was greater for STC vs. KAT and DOR, but other properties of fibre such as density and thickness may have had as much or more influence. In this regard, with the protective coat of the wool fleece such as of Merinos, less heat is lost by convection compared with a more open coat. Furthermore, evaporation via respiration increases in importance relative to sweating as the fleece increases in restrictiveness to air flow and air moisture level among fibres increases (Marai et al. Citation2007; McManus et al. Citation2009; Al-Dawood Citation2017). Likewise, upon shearing of German Blackhead mutton sheep there was a shift from thermoregulation primarily through evaporative cooling to heat radiation via skin (Al-Ramamneh et al. Citation2011).
4.5.3. KAT vs. DOR
That RT at 13:00 h was similar between periods 3 and 4 for both KAT and STC, converse to a slightly greater value for DOR in period 4 vs. 3 (0.10°C difference), and RT was slightly lower for KAT vs. DOR at 17:00 h (i.e. 0.11°C difference) suggest that resilience to high HLI was slightly greater for KAT than for DOR. As for indicators of high resilience of STC, this postulate is in accordance with breed differences in RR. Conversely, RT at 07:00 h in period 4 was 0.19°C greater for KAT than for DOR, and RT for KAT at 07:00 h was much greater in period 4 vs. 3 (difference of 0.24°C) compared with similar values between periods for DOR and STC. Consequently, the difference in RT in period 4 between 07:00 and 13:00 h was considerably less for KAT (0.22°C) compared with DOR (0.47°C) and STC (0.32°C). These findings infer that KAT are relatively tolerant to slightly elevated RT in the nighttime and early morning. In this regard, the breed ranking in RR in period 4 was the same at each time, but differences were greatest at 07:00 h (i.e. 81.6, 72.2, and 54.5 breaths/min at 07:00 h, 149.2, 143.6, and 137.3 breaths/min at 13:00 h, and 147.0, 141.4, and 134.2 breaths/min at 17:00 h for DOR, KAT, and STC, respectively). Hence, it seems that ample opportunity existed for higher RR of KAT at 07:00 h to lessen RT, but with an associated increase in expenditure of energy.
4.5.4. PS
Perhaps because of the subjective nature, differences in PS, or lack thereof, were not as clear as measures of RT and RR in regard to effects of breed, period, etc. The PS of 0 for STC at 07:00 h agree with lower RR than for other breeds and are in accordance with overall greater tolerance to high HLI and relatively low need for nighttime heat dissipation suggested before. The higher values for DOR and KAT in wk 2 of periods 3 and 4, particularly for DOR and wk 2 of period 4, suggest that heat dissipation in the evening was not fully adequate for that stored during the day. The generally lower PS at 13:00 h in wk 2 vs. 1 of period 4 reflects some adaptation with a prolonged period of high HLI, and this is in agreement with a slightly lower RR (i.e. 146.8 and 139.9 breaths/min in wk 1 and 2, respectively). Likewise, PS at 17:00 h in wk 1 and 2 of period 4 were not different, in contrast to a greater value for wk 2 vs. 1 in period 3. This may reflect adaptation during period 3 and either more rapid achievement of stable conditions in period 4 or that a threshold in change in physiological conditions was reached.
4.6. Relationships among variables, variance, and rankings
4.6.1. Relationships among variables
It may not be surprising that r between RT and RR at 13:00 and 17:00 h were significant and moderate in magnitude. That is, RR is elevated when HLI is high to minimize the rise in RT, and higher r would indicate increasing core body temperature despite this physiological response. A fairly similar r of 0.43 was observed by McManus et al. (Citation2009) with different breeds of ewes of Brazil subjected to low to moderate heat stress (i.e. THI of 19.05 and 24.04 in the morning and afternoon, respectively) in a semi-intensive production system, with reference to other Brazilian studies having a similar relationship. Considerations are comparable for r between RT and ST in the present experiment as between RT and RR, although ST could be relatively more influenced by heat gain via convection. Conversely, McManus et al. (Citation2009) observed a higher r between RT and ST of 0.75. In the present experiment, very high r between RT and PS could indicate that higher HLI conditions would be excessive and not relevant to normal or realistic production settings, but perhaps pertinent to very severe heat stress that occasionally results in considerable livestock death (Nienaber and Hahn Citation2007). Fairly high r between RR and PS at 13:00 and 17:00 h were expected, but values were not greater perhaps because of the objective nature of RR and subjectivity inherent in PS.
4.6.2. Variance
St. Croix, in addition to having greater resilience to high HLI compared with DOR and KAT, appeared to have less variability in RT among individual animals. Although, lower SD for STC would partially be attributable to lower mean RT in periods 2, 3, and 4. These findings probably relate to the development of STC in a tropical environment with higher HLI conditions relative to origins of DOR and KAT (Wildeus Citation1997). The difference between DOR and KAT in variance could involve more stringent, disciplined, and longer term selection during breed development of DOR (Thomas Citation1991). Highest variability in RT for KAT in periods 3 and 4 implies greatest potential for improved heat tolerance through selection.
4.6.3. Rankings
The sr indicate that the ranking in RT of animals of each breed in period 1 without elevated HLI can be applied to conditions with slightly higher HLI of period 2. The ranking of animals in RT without high HLI in period 1 was of much less predictive value with highest HLI conditions of period 4. Likewise, sr involving periods 2, 3, and 4 were greater with more similar than disparate conditions (i.e. between periods 2–3 and 3–4 vs. 2-4).
Perhaps surprisingly, the ranking of animals in ST at 07:00 h, before HLI was elevated for the daytime, was predictive of ST regardless of HLI conditions. This may indicate that the skin does not make a sizeable contribution to nighttime dissipation of body heat stored during the day or, if so, it wanes in the early morning. Moreover, sr between periods 3 and 4 suggest that once a threshold in HLI conditions is reached, such as those of period 3, higher HLI will not markedly change the ranking of animals in ST.
The ranking in RR at 07:00 h in period 1 could be used to predict that in period 2 but not in other periods with higher HLI conditions. Respiration rate at 13:00 and 17:00 h in period 1 was of much less value in predicting subsequent rankings with higher HLI. The ranking of RR at 13:00 and 17:00 h in period 1 with lowest HLI conditions would not be particularly useful in predicting the ranking with higher HLI. Conversely, the ranking of animals in RR in periods with elevated HLI was reflective of rankings in later periods with higher HLI. However, as was the case for RT, except for some of the sr for RR between periods 2 and 3, the great majority of values were moderate to low, indicating a need for evaluating animals under elevated HLI conditions of greatest interest.
5. Conclusion
There were some significant effects of and interactions involving region from which sheep were derived, but the overall impact was relatively minor. Based on RT and RR, resilience to high HLI ranked STC > KAT > DOR. High heat tolerance of STC may in part relate to a greater ratio of surface area to BW, but other differences in physiological conditions could be involved as well. Respiration appeared primarily responsible for increasing dissipation of heat as HLI rose. Variability among animals in RT was least for STC and greatest for KAT, suggesting considerable potential for improvement of resilience of KAT to high HLI through selection. The accuracy of prediction of how animals rank in resilience to high HLI conditions will decline with decreasing HLI.
Disclosure statement
No potential conflict of interest was reported by the authors.
Additional information
Funding
References
- Al-Dawood A. 2017. Towards heat stress management in small ruminants – a review. Ann Anim Sci. 17:59–88. doi:10.1515/aoas-2016-0068.
- Al-Ramamneh D , Gerken M , Riek A. 2011. Effect of shearing on water turnover and thermobiological variables in German Blackhead mutton sheep. J Anim Sci. 89:4294–304. doi:10.2527/jas.2011-3982.
- Al-Tamimi HJ. 2007. Thermoregulatory response of goat kids subjected to heat stress. Small Rumin Res. 71:280–285. doi:10.1016/j.smallrumres.2006.04.013.
- Alhidary IA , Shini S , Al Jassim RAM , Gaughan JB. 2012. Physiological responses of Australian Merino wethers exposed to high heat load. J Anim Sci. 90:212–220. doi:10.2527/jas.2011-3972.
- Amundson JL , Mader TL , Rasby RJ , Hu QS. 2006. Environmental effects on pregnancy rate in beef cattle. J Anim Sci. 84:3415–20. doi:10.2527/jas.2005-611.
- AOAC . 2006. Official methods of analysis, 18th ed. Gaithersburg, MD : AOAC International.
- Atteberry JT , Johnson HD. 1969. Effects of environmental temperature, controlled feeding and fasting on rumen motility. J Anim Sci. 29:734–737. doi:10.2527/jas1969.295734x.
- Beatty DT , Barnes A , Fleming PA , Taylor E , Maloney SL. 2008. The effect of fleece on core and rumen temperature in sheep. J Therm Biol. 33:437–443. doi:10.1016/j.jtherbio.2008.07.002.
- Beatty DT , Barnes A , Taylor E , Pethick D , McCarthy M , Maloney SK. 2006. Physiological responses of Bos Taurus and Bos indicus cattle to prolonged continuous heat and humidity. J Anim Sci. 84:972–985. doi:10.2527/2006.844972x.
- Bennett JW. 1973. Regional body surface area of sheep. J Agric Sci. 81:429–432. doi:10.1017/S0021859600086469.
- Bernabucci J , Bani P , Ronchi B , Lacetera N , Nardone A. 1999. Influence of short- and long-term exposure to hot environment on rumen passage rate and diet digestibility by Friesian heifers. J Dairy Sci. 82:967–973. doi:10.3168/jds.S0022-0302(99)75316-6.
- Bernabucci U , Lacetera N , Danieli PP , Bani P , Nardone B , Ronchi B. 2009. Influence of different periods of exposure to hot environment on rumen function and diet digestibility in sheep. Int J Biometerol. 53:387–395. doi:10.1007/s00484-009-0223-6.
- Blaxter KL. 1962. The fasting metabolism of adult wether sheep. Br J Nutr. 16:615–626. doi:10.1079/BJN19620060.
- Burke JM , Miller JE. 2004. Relative resistance to gastrointestinal nematode parasites in Dorper, Katahdin, and St. Croix lambs under conditions encountered in the southeastern region of the United States. Small Rumin Res. 54:43–51. doi:10.1016/j.smallrumres.2003.10.009.
- Chedid M , Jaber LS , Giger-Reverdin S , Duvaux-Ponter C , Hamadeh SK. 2014. Review: water stress in sheep raised under arid conditions. Can J Anim Sci. 94:243–257. doi:10.4141/cjas2013-188.
- Degen AA , Shkolnik A. 1978. Thermoregulation in fat-tailed Awassi, a desert sheep, and in German Mutton Merino, a Mesic sheep. Physiological Zool. 51:333–339. doi:10.1086/physzool.51.4.30160957.
- Dixon RM , Thomas R , Holmes JHG. 1999. Interactions between heat stress and nutrition in sheep fed roughage diets. J Agric Sci. 132:351–359. doi: 10.1017/S0021859698006248
- Faichney GJ , Barry TN. 1986. Effects of mild heat exposure and suppression of prolactin secretion on gastrointestinal-tract function and temperature regulation in sheep. Aust J Biol Sci. 39:85–97. doi:10.1071/BI9860085.
- Fuquay JW. 1981. Heat stress as it affects animal production. J Anim Sci. 52:164–174. doi:10.2527/jas1981.521164x.
- Gaughan JB , Mader TL , Holt SM , Sullivan ML , Hahn GL. 2010. Assessing the heat tolerance of 17 beef cattle genotypes. Int J Biometeorol. 54:617–627. doi:10.1007/s00484-009-0233-4.
- Gruner L. 1991. Breeding for helminth resistance in sheep and goats. In: Oxford RFE , Owen JB , editors. Breeding for disease resistance in farm animals. Wallingford : CAB Int.; p. 187–200.
- Hahn GL. 1999. Dynamic responses of cattle to thermal heat loads. J Anim Sci. 77(suppl. 2):10–20.
- Hamzaoui S , Salama AAK , Albanell E , Such X , Caja G. 2013. Physiological responses and lactation performances of late-lactation dairy goats under heat stress conditions. J Dairy Sci. 96:6355–6365. doi:10.3168/jds.2013-6665.
- Hart SP , Potraz S. 2015. Fencing for goats. In: Merkel RC , Gipson TA , Sahlu T , editors. Meat goat production handbook. second ed. Langston, OK : American Institute for Goat Research; p. 45–60.
- Hofman WF , Riegle GD. 1977. Thermorespiratory responses of shorn and unshorn sheep to mild heat sress. Respir Physiol. 30:327–338. doi:10.1016/0034-5687(77)90039-1.
- Johnson HD. 1987. Bioclimates and livestock. In: Johnson HD , editor. Bioclimatology and the adaptation of livestock. World Anim Sci., B5. New York, NY : Elsevier; p. 3–16.
- Kadzere CT , Murphy MR , Silanikove N , Maltz E. 2002. Heat stress in lactating dairy cows: a review. Livest Prod Sci. 77:59–91. doi:10.1016/S0301-6226(01)00330-X.
- Littell RC , Milliken GA , Stroup WW , Wolfinger RD. 1996. SAS® systems for mixed models. Cary, NC : SAS Inst. Inc.
- Lu CD. 1989. Effects of heat stress on goat production. Small Rumin Res. 2:151–162. doi:10.1016/0921-4488(89)90040-0.
- Mader TL , Davis MS , Brown-Brandl T. 2006. Environmental factors influencing heat stress in feedlot cattle. J Anim Sci. 84:712–719. doi:10.2527/2006.843712x.
- Mahjoubi E , Amanlou H , Mirzaei-Alamouti HR , Aghaziarati N , Houssein Yazdi M , Noori GR , Yuan K , Baumgard LH. 2014. The effect of cyclical and mild heat stress on productivity and metabolism in Afshari lambs. J Anim Sci. 92:1007–1014. doi:10.2527/jas.2013-7153.
- Marai IFM , El-Darawanny AA , Fadiel A , Abdel-Hafex MAM. 2007. Physiological traits as affected by heat stress in sheep – a review. Small Rumin Res. 71:1–12. doi:10.1016/j.smallrumres.2006.10.003.
- McManus C , Paludo GR , Louvandini H , Gugel R , Cláudio L , Sasaki LCB , Paiva SR. 2009. Heat tolerance in Brazilian sheep: physiological and blood parameters. Trop Anim Health Prod. 41:95–101. doi:10.1007/s11250-008-9162-1.
- Mengistu UL , Puchala R , Sahlu T , Gipson TA , Dawson LJ , Goetsch AL. 2017. Conditions to evaluate differences among individual sheep and goats in resilience to high heat load index. Small Rumin Res. 147:89–95. doi:10.1016/j.smallrumres.2016.12.039.
- Miaron JOO , Christopherson RJ. 1992. Effect of prolonged thermal exposure on heat production, reticular motility, rumen-fluid and particulate passage-rate constants, and apparent digestibility in steers. Can J Anim Sci. 72:809–819. doi:10.4141/cjas92-093.
- Ngwa AT , Dawson LJ , Puchala R , Detweiler G , Merkel RC , Tovar-Luna I , Sahlu T , Ferrell CL , Goetsch AL. 2007. Urea space and body condition score to predict body composition of meat goats. Small Rumin Res. 73:27–36. doi:10.1016/j.smallrumres.2006.10.014.
- Nienaber JA , Hahn GL. 2007. Livestock production system management responses to thermal challenges. Int J Biometerol. 52:149–157. doi:10.1007/s00484-007-0103-x.
- NRC . 2007. Nutrient requirements of small ruminants. sheep, goats, cervids, and new world camelids. Washington, DC : National Academy Press.
- SAS . 2011. SAS/STAT® 9.3 user’s guide. Cary, NC : SAS Inst. Inc.
- Savage DB , Nolan JV , Godwin IR , Mayer DG , Aoetpath A , Nguyen T , Baille ND , Rheinberger TE , Lawlor C. 2008. Water and feed intake responses of sheep to drinking water temperature in hot conditions. Aust J Exp Agric. 48:1044–1047. doi:10.1071/EA08056.
- Shelton M. 2000. Reproductive performance of sheep exposed to hot environments. In: Malik RC , Razzaque MA , Al-Nasser AY , editors. Sheep production in hot and arid zones. Safat : Kuwait Institute for Scientific Research; p. 155–162.
- Silanikove N. 1992. Effect of water scarcity and hot environment on appetite and digestion in ruminants: a review. Livest Prod Sci. 30:175–194. doi:10.1016/S0301-6226(06)80009-6.
- Silanikove N. 2000. Effects of heat stress on the welfare of extensively managed domestic ruminants. Livest Prod Sci. 67:1–18. PII:S0301-6226(00)00162-7. doi: 10.1016/S0301-6226(00)00162-7
- Srikandakumar A , Johnson EH , Mahgoub O. 2003. Effect of heat stress on respiratory rate, rectal temperature and blood chemistry in Omani and Australian Merino sheep. Small Rumin Res. 49:193–198. doi:10.1016/S0921-4488(03)00097-X.
- Sunagawa K , Nagamine I , Kamata Y , Niino N , Taniyama Y , Kinjo K , Matayoshi A. 2015. Nighttime cooling is an effective method for improving milk production in lactating goats exposed to hot and humid environment. Asian-Australas J Anim. Sci. 28:966–975. doi:10.5713/ajas.14.0890.
- Teixeira IAMA , Pereira Filho JM , Murray PJ , Resende KT , Ferreira ACD , Fregadolli FL. 2006. Water balance in goats subjected to feed restriction. Small Rumin Res. 63:20–27. doi:10.1016/j.smallrumres.2005.01.008.
- Thomas DL. 1991. Hair sheep genetic resource of the Americas. In: Wildeus S , editor. Proc. hair sheep res. symp. St. Croix, Virgin Islands : University of the Virgin Islands; p. 3–20.
- Van Soest PJ , Robertson JA , Lewis BA. 1991. Methods for dietary fiber, neutral detergent fiber and non-starch polysaccharides in relation to animal nutrition. J Dairy Sci. 74:3583–3597. doi:10.3168/jds.S0022-0302(91)78551-2.
- Wang L , Wang Z , Zou H , Peng Q. 2016. Yeast culture and vitamin E supplementation alleviates heat stress in dairy goats. Asian-Australas J Anim. Sci. 29:814–822. doi:10.5713/ajas.15.0414.
- Wildeus S. 1997. Hair sheep genetic resources and their contribution to diversified small ruminant production in the United States. J Anim Sci. 75:630–640. doi:10.2527/1997.753630x.