
 ?Mathematical formulae have been encoded as MathML and are displayed in this HTML version using MathJax in order to improve their display. Uncheck the box to turn MathJax off. This feature requires Javascript. Click on a formula to zoom.
ABSTRACT
Gas production and post-ruminal crude protein (PRCP) were measured in vitro using the modified Hohenheim Gas Test (HGT) and the ANKOM RF Gas Production System (AGPS). Ruminal fluid was collected from cannulated wethers. The microbial inoculum was prepared according to the HGT and incubated with both in vitro systems. Total gases accumulated after 8 or 24 h were manually read off (modified HGT) and cumulative gas pressures were automatically recorded (AGPS). Determined NH3-N concentrations were used to estimate PRCP. Peas had a greater gas production capacity than field beans (P < 0.05). The ranking of 24 h-gas production from the substrates was equal with both systems (R2 = 0.57). The field beans had more PRCP than the peas, and PRCP differed between the systems (P < 0.05). Current ensiling conditions had no effect on gas production. Ensiling did not affect PRCP concentrations in peas, but reduced them in the field beans (P > 0.05 with the modified HGT; P < 0.05 with AGPS). Using the AGPS, PRCP was clearer differentiated among the substrates and had a clearer progression along increasing assumed ruminal passage rates. This indicates a better sensitivity of the AGPS compared to the modified HGT.
Introduction
Increasing local cultivation of field peas (Pisum sativum) and field beans (Vicia faba) may have sustainable effects on food production (replacement of genetically modified protein plants), as well as they support local nutrient cycles and supply chains. Previous studies have shown that, in dairy cows, at least a partial substitution of common soybean or rapeseed meals, and cereal grains, by peas and field beans can be achieved while maintaining production levels (Khorasani et al. Citation2001; Tufarelli et al. Citation2012). However, addition of peas or field beans to the diet, which have starch concentrations of around 40–50% of dry matter (DM), may alter rumen fermentation with greater production of volatile fatty acids (Khorasani et al. Citation2001). This might cause risk of rumen acidosis (Deckardt et al. Citation2013). Moreover, hepatic gluconeogenesis from short chain fatty acids is energetically less efficient than direct digestion of starch and other soluble carbohydrates in the small intestine (Deckardt et al. Citation2013). The use of peas and field beans for feeding of ruminants is also limited by their remarkable amount of protein that is readily degradable in the rumen (Yu et al. Citation2002).
Ruminal batch-cultures can be used to obtain information on ruminal fermentation of starch and other easily fermentable carbohydrates from the feed. For this, cumulative gas pressures are converted to the volume of gas produced within a certain time of in vitro fermentation, or gas volumes can directly be read off. Gas production measurements primarily serve for the determination of concentrations of metabolizable energy and net energy lactation of feeds. Moreover, the analysis of residual NH3-N from the inoculum after fermentation allows for the calculation of post-ruminal crude protein (PRCP), which is a measure of nitrogen-containing fractions potentially available in the small intestine. Gas production and PRCP are important determinants in feed evaluation systems. An accepted standard method for measuring in vitro gas production and PRCP concentrations is the modified Hohenheim Gas Test (HGT; Raab et al. Citation1983; Steingass et al. Citation2001). However, applications of more labour- and cost-effective automated systems such as the ANKOM RF Gas Production System (AGPS; ANKOM Technology, Macedon, NY, USA) are rapidly increasing.
The objective of the current study was to determine in vitro gas production and PRCP of the grains of native field peas and field beans in order to provide current data for a better assessment of the nutritive potential of these legume grains in ruminants. It was further an objective to test the effect of ensiling on gas production and especially on PRCP concentrations. As previously shown, available protein can be modified during ensiling due to the formation of Amadori products (Kuhnitzsch et al. Citation2019). This is decreasing the proportion of soluble protein other than proteolysis is commonly increasing soluble protein in whole-crop silages. Two batch-culture systems, the modified HGT and the AGPS were applied in this study.
Materials and methods
Donor animals and diet composition
Ruminal fluid was obtained from six rumen-cannulated Suffolk and Pomeranian coarsewool wethers (Ovis aries). The animals were 6 years of age. The sheep were kept and cared for by the Research Centre for Agricultural and Nutritional Sciences, Martin Luther University Halle-Wittenberg, Merbitz, Wettin/Löbejün (Saxony-Anhalt, Germany) and used with approval by Saxony-Anhalt Federal Administration Authority (approval no. 203.k-42502-3-657MLUMerbitz). They had free access to tap water. Meadow haylage was offered ad libitum and was supplemented with 200 g of a pelleted concentrate (IBEKA® PANTO Schäferstolz, HL Hamburger Leistungsfutter GmbH, Hamburg, Germany; Ø 3 mm pellet size) per animal and day, and 10 g of a mineral feed (basu-kraft® Top-Mineral, BASU Heimtierspezialitäten GmbH, Bad Sulza, Germany) per animal and day on as fed basis. The nutrient composition of the main diet components is given in .
Table 1. Nutrient composition of the basal diet components.
Test substrates
As the test substrates, a field pea cultivar (Alvesta; KWS SAAT SE, Einbeck, Germany) and a field bean cultivar (Fanfare; SAATEN-UNION GmbH, Isernhagen, Germany) were used. The cultivars were grown and harvested in 2016. From the native material, model silages (Rostock Model Silages) were prepared according to Hoedtke and Zeyner (Citation2011), wherefore the peas and field beans were re-moistened from 89 and 91% to 73 and 70% DM, respectively. The ground grains were vacuum-sealed in double-layer polyethylene bags with punctual perforation of the inner layer for gas release and stored at approximately 25°C for 60 days. No inoculant was used. The pH did not decrease during ensiling and remained at 6.5 and 6.4 in peas and field beans, respectively. Obviously, no sufficient lactic acid fermentation occurred. The fermentation parameters are given in . The chemical composition of the test substrates is shown in .
Table 2. Fermentation characteristics of the model silages.
Table 3. Nutrient composition of the test substrates.
Additionally, maize starch and a cellulose preparation (Vitacel® R200; J. Rettenmaier & Söhne GmbH & Co. KG, Rösenberg, Germany) were used as standardized substrates that mark upper or lower borders of gas production capacity.
Experimental design
The study was conducted from June to August 2017, including six consecutive runs. Within each run, both the modified HGT and the AGPS were simultaneously used. The same inoculum was used for both systems. Test substrates, blanks (i.e. only inoculum without substrate), and standards (i.e. a yeast standard according to the instructions of the AGPS, corn starch, Vitacel® R200 cellulose, as well as a hay and a concentrate standard according to the instructions of the HGT) were evenly distributed to the systems, so that both systems contained the equal set of units, which was as follows: native peas, ensiled peas, native field beans, ensiled field beans, and a blank, each in duplicate, for sampling after 8 h of incubation, and yeast, starch, cellulose, hay, and concentrate standard, as well as native peas, ensiled peas, native field beans, ensiled field beans, and a blank, each in duplicate, for sampling after 24 h of incubation.
In vitro gas production
Ruminal fluid was taken from two of the six wethers before feeding and at about 1.5 h prior to the start of a run. The animals were randomly selected. The mixed ruminal fluid was filtered through two layers of cheesecloth and stored in a thermos bottle during transport to the laboratory.
The preparation of the buffer/nutrient solution and subsequent procedures followed the protocol given by Menke et al. (Citation1979), Menke and Steingass (Citation1988), and the Association of German Agricultural Analytic and Research Institutes (VDLUFA Citation2012; method no. 25.1). To the buffer, NH4HCO3 was added by 2 g/L and NaHCO3 was reduced by 2 g/L in order to avoid that nitrogen will limit microbial biomass production (Edmunds et al. Citation2012). The ruminal fluid had a pH of 6.7 ± 0.13, a redox potential of −326 ± 23.5 mV, and a temperature of 35 ± 1.5°C. The inoculum was prepared by mixing two parts of the buffer/nutrient solution and one part of ruminal fluid under stirring and continuous CO2-flush to ensure an anaerobic environment. The prepared inoculum had a pH of 6.8 ± 0.075, and a redox potential of −329 ± 36.5.
In both systems, 0.2 g of each substrate or standard, ground to 1 mm sieve size, was weighed into the fermentation vessels, and 30 mL of inoculum was added.
In the modified HGT, volumetric flasks of approximately 100 mL volume capacity (70 mL headspace volume) were used. The inoculum was filled into the pre-warmed flasks using an automatic pump. The flasks were placed into a rotor (with a 1 rpm rotation) in a drying-oven at continuously 39°C. After 8 h of incubation, the flasks were degassed and gas production was documented. After 24 h, the quantity of accumulated gases was read off from each of the flasks and gas production was documented. The blanks were used to correct all measurements taken from substrate or standard units for the quantity of gases produced by absence of a test substrate or a standard. According to the HGT protocol (VDLUFA Citation2012; method no. 25.1), a hay standard and a concentrate standard, for which gas production after 24 h was known (49.61 and 65.18 mL/200 mg DM, respectively), were used for validation of the measurements. In the six runs, the calculated hay standard and concentrate standard factors (i.e. known/measured gas production) ranged from 0.98–1.11 and from 1.03–1.25, respectively. All gas production measurements of a certain run were corrected with a mean standard factor for this trial.
The incubation in the AGPS principally followed a similar procedure. Glass bottles with an actual volume capacity of approximately 140 mL (110 mL headspace volume) were used instead of volumetric flasks. The bottles were capped each with a gas pressure measuring module, and were randomly distributed to two identical water baths. To purge out oxygen, each bottle was vented with argon through the Luer port until the inner pressure exceeded 8 psi. Then, all gases were automatically released from the bottles and automatic real-time acquisition of gas pressure data was started. The settings were as follows: 1 min recording interval; a threshold of 1.5 psi for the automatic release of accumulated gases (to prevent supersaturation of CO2 in the medium at high gas pressures; Tagliapietra et al. Citation2010); a 150 ms valve open time; and an agitation interval of 80 rpm in the water baths. The cumulative gas pressures after 24 h of incubation were read out from the data set, applied to a blank correction, and converted to mL of produced gas.
A non-linear regression analysis was performed upon gas production kinetics in SAS MODEL (SAS 9.4; SAS Institute Inc., Cary, NC, USA) using the Gompertz function (France et al. Citation2000):where y(t) is gas production (mL/200 mg DM) at time t; a is the asymptotic maximal gas production; b is the time t (h) until which approximately one third of a is produced; and c is the time t (h) until which another one third of a is produced, i.e. b + c = 70% of a.
The correct function of the system was verified according to the manufacturer’s instructions using a yeast standard (Saccharomyces cerevisiae) that was run in duplicate during each trial. The recorded gas pressure kinetics of each yeast unit was compared to that given by the manufacturer, whereupon no salient differences were observed.
Analysis of PRCP
After 8 and 24 h, samples were taken for NH3-N analysis. All sampled vessels were immediately placed in ice water (around 0°C) to stop microbial activity, and then rinsed into distillation tubes (with 2 × 30 mL of distilled water). To lightly alkalize the sample solution to approximately pH 7–10, 4 mL of a 1 N NaOH were added immediately prior to nitrogen analysis. This led to a transfer of ammonium ions into NH3 but prevented a surplus of lye, which would have forced protein hydrolysis. Distillation and titration were performed with a FOSS 2300 KjeltecTM Analyser Unit (FOSS GmbH, Rellingen, Germany) without any further addition of lye and water.
The PRCP was calculated, considering a sample weight of 200 mg of substrate, as follows:where, NH3-Nblank is measured NH3-N in blanks (mg); Nsubstrate is the amount of N in the weighed portion of substrate (i.e. 200 mg × % DM of substrate × % crude protein of substrate/6.25/10,000); NH3-Nsample is measured NH3-N in the sample solution after either 8 or 24 h of incubation (mg); and DMsubstrate is the DM concentration of the substrate (%).
Effective PRCP was estimated according to Edmunds et al. (Citation2012). For each single run, PRCP estimated at 8 and 24 h was plotted against an ln(t) scale (t = 8 and 24 h). The intercept (y) and the slope (a) of the resulting regression equations were used to calculate effective PRCP for assumed rumen passage rates (Kp) of 0.02, 0.04, 0.06, 0.08, and 0.12/h as follows:
Additional chemical analyses
For the chemical analyses, the dried substrates were ground to pass a 1 mm or 0.5 mm sieve size, dependent on specific method’s requirement. The DM, crude ash, crude protein, acid ether extract, crude fibre, and Van Soest detergent fibre concentrations of the diet components and the test substrates were analyzed according to the official German key book for feed analysis (VDLUFA Citation2012; methods no. 3.1, 4.1.1, 5.1.1 B, 6.1.1, 6.5.1, 6.5.2, 6.5.3, and 8.1). Neutral detergent fibre was determined after treatment with a heat stable amylase (aNDF). Neutral detergent fibre and acid detergent fibre were furthermore expressed excluding residual ash (aNDFom and ADFom). Starch was determined by polarimetry (VDLUFA Citation2012; method no. 7.2.1). The analyzed crude nutrients and gas production determined by the modified HGT were used to calculate metabolizable energy concentrations according to the Society of Nutrition Physiology (GfE Citation2009). True protein and soluble protein were determined from protein fractionation according to Licitra et al. (Citation1996). The organic acids and ethanol, which were produced during fermentation in the silages, were determined by high performance liquid chromatography with refractive index detection (method no. LKS FMUAA 1662018-05; accredited according to DIN EN ISO/IEC 17025:2005) using a Shimadzu LC-20A Prominence (Shimadzu Corp., Kyoto, Japan) and a Hi-Plex H 8 µm column (300 × 7.7 mm; Agilent Technologies Inc., Santa Clara, CA, USA). The aerobic stability was tested following Honig (Citation1990).
Statistical analysis
Units showing gas leakage, defects, or measuring errors were excluded from gas production and NH3-N analyses. Using boxplots, outliers were identified and removed from the datasets. Outliers were defined as observations that lie above or below the upper or lower fences of the box (i.e. ±1.5 interquartile ranges), respectively. For each substrate, a total of 4–6 replicates was available for statistical analysis.
Statistical analysis was performed using the SAS 9.4 software package. Using the MIXED procedure, least squares means were estimated for the 24 h-gas production, PRCP, and effective PRCP concentrations, respectively. The following models were used:where yijk is 24 h-gas production; µ is the general mean; αi is the fixed effect of in vitro model i (i = 1, 2, where 1 = modified HGT, and 2 = AGPS); βj is the fixed effect of substrate (feed) j (j = 1, … , 6, where 1 = native peas, 2 = ensiled peas, 3 = native field beans, 4 = ensiled field beans, 5 = maize starch, and 6 = Vitacel® R200 cellulose); αβij is the interaction of fixed effects αi and βj;
r
k is the random effect of run k (k = 1, … , 6) with consideration of repeated measurements per substrate; and
e
ijkl is the random residual effect. For the analysis of 24 h-gas production, heterogeneous residual variances have been considered according to the substrate.
where yijkl is PRCP or effective PRCP; µ is the general mean; αi is the fixed effect of in vitro model i (i = 1, 2, where 1 = modified HGT, and 2 = AGPS); βj is the fixed effect of substrate (feed) j (j = 1, … , 4, where 1 = native peas, 2 = ensiled peas, 3 = native field beans, and 4 = ensiled field beans); γk is the fixed effect of time of measurement or Kp k (k = 1, 2 with PRCP, where 1 = 8 h, and 2 = 24 h; and k = 1, … , 5 with effective PRCP, where 1 = 0.02/h, 2 = 0.04/h, 3 = 0.06/h, 4 = 0.08/h, and 5 = 0.12/h); αβγijk is the interaction of fixed effects αi, βj, and γk;
r
l is the random effect of run l (l = 1, … , 6) with consideration of repeated measurements per substrate; and
e
ijkl is the random residual effect. For the analysis of effective PRCP, heterogeneous residual variances have been considered according to Kp.
The differences of least squares means were tested for significance, where differences with P < 0.05 were considered to be significant. The studentized residuals were confirmed to have Gaussian distribution using the Shapiro–Wilk test.
A linear regression analysis was performed to examine the relationship between 24 h-gas production obtained with the two in vitro models. Using the REG procedure, the deviation of the slope of the respective regression line from a slope of 1.0 was determined. A slope of 1.0 means no difference exists between the models for the ranking of substrates, regarding 24 h-gas production.
Results
24 h-gas production
After 24 h of incubation, maize starch had the greatest gas production, followed by pea treatments and cellulose. The field bean treatments had the lowest gas production (P < 0.05; , ). Ensiling had no effect on the amount of gases produced from peas or field beans, which was reflected by only minor changes in starch concentration (). Gas production was generally lower when measured with the AGPS than with the modified HGT (P < 0.001). The absolute difference ranged between 19 and 30 mL/200 mg DM depending on the test substrate (). The ranking of 24 h-gas production from the different substrates was equal with both in vitro models (R2 = 0.57; ). The slope of the regression line did not differ from a slope of 1.0 (P = 0.987). The gas production profiles of the several substrates determined with the AGPS are shown in .
Figure 1. Relationship between the 24 h-gas production (mL/200 mg dry matter) from maize starch (Δ), cellulose (○), as well as native peas (♦), ensiled peas (▴), native field beans (▪), and ensiled field beans (●), measured with the modified Hohenheim Gas Test (modified HGT) and the ANKOM RF Gas Production System (AGPS); regression equation: gas production (modified HGT) = 22.44416 + 0.998141 × gas production (AGPS); R2 = 0.57.
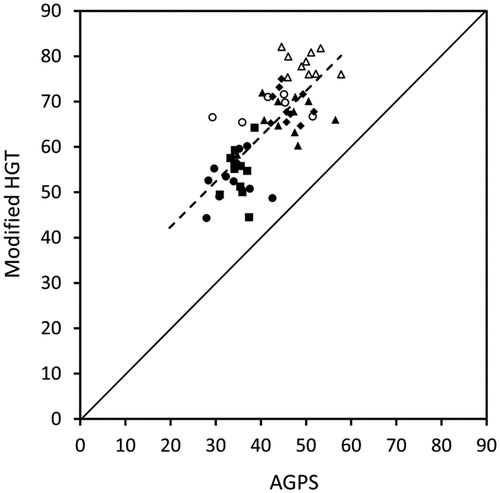
Figure 2. Cumulative gas production from maize starch (Δ), cellulose (○), as well as native peas (♦), ensiled peas (▴), native field beans (▪), and ensiled field beans (●) during 24 h of incubation, measured with the ANKOM RF Gas Production System; DM, dry matter.
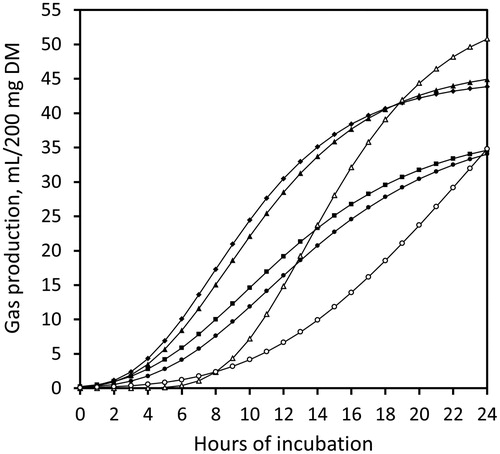
Table 4. Least squares means of 24 h-gas production (mL/200 mg dry matter) ± standard error from different test substrates measured with the modified Hohenheim Gas Test (modified HGT) and the ANKOM RF Gas Production System (AGPS).
PRCP
The field bean treatments generally had a greater concentration of PRCP than the pea treatments (, ). Post-ruminal crude protein estimates mostly differed between the two in vitro systems (P < 0.05). They were reduced by duration of incubation (8–24 h) (P < 0.05; ). Ensiling slightly increased PRCP in peas (P > 0.05), but decreased PRCP in the field beans (P > 0.05 with modified HGT; P < 0.05 with AGPS; ). Specific differences of effective PRCP were found between the substrates or treatments (P < 0.05) as shown in . Effective PRCP increased along increasing Kp; however, this was clearer with the AGPS ().
Figure 3. Concentrations of post-ruminal crude protein (PRCP) in native peas (♦), ensiled peas (▴), native field beans (▪), and ensiled field beans (●) at assumed ruminal passage rates (Kp) of 0.02 (Kp2), 0.04 (Kp4), 0.06 (Kp6), 0.08 (Kp8), and 0.12/h (Kp12), determined with (A) the modified Hohenheim Gas Test, or (B) the ANKOM RF Gas Production System; standard errors ranged between 3.16 and 14.2 g/kg DM; abcde different superscripts mark differences among Kp for same species and treatment (P < 0.05) (in A, differences only belong to field bean treatments ▪ and ●); † PRCP differed between native and ensiled field beans (P < 0.05), ‡ PRCP differed between native peas and field beans (at Kp8 and Kp12 in A, and at Kp4 to Kp12 in B), and between ensiled peas and field beans (at Kp6 to Kp12 in B) (P < 0.05), DM = dry matter.
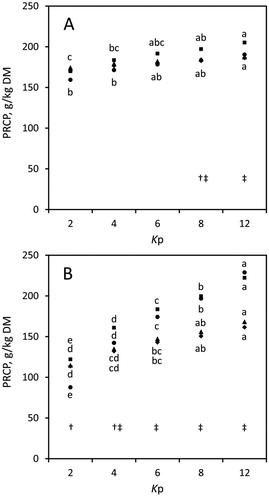
Table 5. Least squares means of post-ruminal crude protein at 8 or 24 h of incubation (g/kg dry matter) ± standard error from different test substrates determined with the modified Hohenheim Gas Test (modified HGT) and the ANKOM RF Gas Production System (AGPS).
Discussion
The HGT is an established and valid method to measure ruminal gas production in vitro on the basis of sequential manual readings. According to the German feed evaluation system, the HGT is routinely used both by commercial laboratories and academia to determine concentrations of metabolizable energy and net energy lactation in feeds on the basis of gas production measurements (Menke et al. Citation1979; VDLUFA Citation2012). The modified HGT also allows the determination of PRCP, which comprises microbial protein and rumen-undegraded protein (Edmunds et al. Citation2010, Citation2012). It is, therefore, an integral part of the feed evaluation routine in Germany. In laboratory practice, attempts are made to automatize analytical processes. Thus, electronic pressure transducer techniques for monitoring gas production, such as the AGPS, have been implemented, refined, and validated (Cone et al. Citation1996; Mauricio et al. Citation1999; Davies et al. Citation2000; van Gelder et al. Citation2005; van Laar et al. Citation2006). The AGPS is currently becoming an accepted in vitro system for feed evaluation purposes, and is promising significant economy in labour and time. The principal technique may also allow in vitro protein evaluation (Karlsson et al. Citation2009; Vaga et al. Citation2017).
Differences of absolute values may easily appear between different systems, because absolute gas production measurements largely depend on the specific protocol, where donor animals, the animals’ diet composition, the composition of the buffer/nutrient solution, venting of the fermenters, or the agitation method have been identified to affect gas production (Cone et al. Citation2002; Cattani et al. Citation2014; Keim et al. Citation2017). These impacts probably do not alter the general ranking among different substrates (feeds) (Cattani et al. Citation2014; Keim et al. Citation2017). In the current study, gas production was systematically lower with the AGPS than with the modified HGT. Systematic differences of gas production between the HGT and a gas pressure transducer system also have been observed previously (Gierus et al. Citation2008). The authors used different ratios of substrate to inoculum (200 mg:30 mL vs. 1000 mg:104 mL), which may have led to a lower colonization rate (i.e. microbial cells/mg substrate) and lower gas production in the automatic system (Gierus et al. Citation2008). Váradyová et al. (Citation2005) did not find significant differences in gas production between a HGT analogue and a gas pressure transducer system when the substrate to inoculum ratio was kept equal in both systems. Consequently, this idea fails to explain the differences that we found between the in vitro systems using the same buffer/nutrient medium, the same rumen fluid, and the same ratio of substrate to inoculum. The supersaturation of CO2 in the medium that may occur in closed systems at high gas pressures can lead to biased measurements of gas production (Tagliapietra et al. Citation2010; Cattani et al. Citation2014). This was prevented in the HGT by greased plungers in the flasks allowing the accumulated gases to expand; whereas in the AGPS, the bottles were automatically vented when reaching a pre-set gas pressure border. Differences in headspace volume or the agitation method (Keim et al. Citation2017) also do not provide a convincing explanation. Hence, we cannot finally clarify the differing gas production that we obtained between the both in vitro systems.
Large differences can be found among documented gas production rates from peas and field beans, to which differences in cultivars, cultivation environments, harvesting, and preservation conditions may contribute. Using the modified HGT method, 24 h-gas production from peas and field beans was similar to that reported by Blümmel et al. (Citation1999) (69 vs. 72 mL/200 mg DM in peas, and 55 vs. 59 mL/200 mg DM in field beans). Gas production measured with the AGPS has, to the best of our knowledge, not been reported for peas and field beans. Gas production from maize starch and cellulose was close to that measured with maize starch and cellulose based diets (50 vs. 42 mL/200 mg DM in starch vs. a starch-based diet, and 38 vs. 36 mL/200 mg DM in cellulose vs. a cellulose-based diet; Kand et al. Citation2018). Cornou et al. (Citation2013) reported 24 h-gas production from maize starch of 42–46 mL/200 mg DM. We can confirm previous reports that peas have a greater gas production capacity than field beans (Abreu and Bruno-Soares Citation1998; Blümmel et al. Citation1999; Masoero et al. Citation2005). Both, peas and field beans came in gas production before rapeseed, soybeans, and lupines (Abreu and Bruno-Soares Citation1998; Blümmel et al. Citation1999; Masoero et al. Citation2005; Calabrò et al. Citation2009), which is likely caused by greater concentrations of starch and other soluble carbohydrates readily fermented by rumen microbes (Abreu and Bruno-Soares Citation1998; Masoero et al. Citation2005).
The greater concentrations of PRCP in the field beans were likely a result of their greater crude protein concentrations. Clear differences in the obtained PRCP concentrations were found between the in vitro systems. A clear differentiation among the substrates/treatments was most likely reflected by the AGPS measurements. Moreover, the AGPS revealed a clearer trend to increased PRCP concentrations with increasing Kp (). This might indicate some greater sensitivity of the AGPS method.
Ensiling of peas and field beans can lead to fermentation of soluble starch and soluble carbohydrates. At least in starch, this becomes more distinct when additives such as lactic acid bacteria are used (Gefrom et al. Citation2013). In this study, no inoculants were used. The pH did not decline to a typical level for lactic acid fermentation as described by Gefrom et al. (Citation2013) to be 4.1–4.4. However, the measured ethanol concentrations of 6.1 and 11.2 g/kg DM in peas and field beans, respectively, were within the range of 9.0–23.7 g/kg DM of total alcohols, which has been reported by Gefrom et al. (Citation2013). Moreover, the silages were aerobically stable for at least 7 days. Starch concentrations were at best moderately altered after ensiling (Δ 25 and Δ 43 g/kg DM in peas and field beans, respectively). Next, this was not reflected by differences in gas production between native and ensiled peas and native and ensiled field beans, respectively. The energy density (i.e. metabolizable energy concentration) of the peas and field beans was not markedly reduced after ensiling.
In this study, ensiling had no effect on soluble protein; it remained on a level of 71 and 67% of crude protein. Next, hardly soluble and insoluble protein fractions (i.e. neutral detergent insoluble and acid detergent insoluble true protein) have not been increased, as well as a considerable formation of Maillard polymers did probably not occur. Taken together, energy and N availability did not markedly changed, which explains widely unchanged PRCP concentrations following ensiling under current conditions.
Conclusions
The modified HGT and the AGPS were suitable to measure gas production in native and ensiled peas and field beans, both reflecting an equal ranking of the substrates and treatments. Measurements of PRCP using the AGPS, however, allowed a clearer differentiation among the substrates and treatments than the modified HGT, and had a clearer progression along increasing Kp. This does not generally compromise the suitability of the modified HGT method. A greater number of substrates of widely spread origin and quality is required to validate the AGPS for future routine application. This would facilitate a significant reduction of labour and time.
The produced silages of pea and field bean grains failed to decline in pH. Greater concentrations of ethanol indicated a partly yeast-driven fermentation. However, the silages were aerobically stable for at least 7 days, and no distinct reduction of the energy density or of protein concentrations occurred. Neither gas production, nor soluble protein and PRCP were affected by ensiling. To efficiently reduce the proportion of soluble protein in peas and field beans and increase rumen-undegraded protein and PRCP, heat treatment might be a useful tool.
Disclosure statement
No potential conflict of interest was reported by the author(s).
ORCID
M. Bachmann http://orcid.org/0000-0002-1264-997X
Additional information
Funding
References
- Abreu JMF, Bruno-Soares AM. 1998. Chemical composition, organic matter digestibility and gas production of nine legume grains. Anim Feed Sci Technol. 70:49–57. doi: 10.1016/S0377-8401(97)00071-0
- Blümmel M, Aiple KP, Steingass H, Becker K. 1999. A note on the stoichiometrical relationship of short chain fatty acid production and gas formation in vitro in feedstuffs of widely differing quality. J Anim Physiol Anim Nutr. 81:157–167. doi: 10.1046/j.1439-0396.1999.813205.x
- Calabrò S, Tudisco R, Balestrieri A, Piccolo G, Infascelli F, Cutrignelli MI. 2009. Fermentation characteristics of different grain legumes cultivars with the in vitro gas production technique. Ital J Anim Sci. 8:280–282. doi: 10.4081/ijas.2009.s2.280
- Cattani M, Tagliapietra F, Maccarana L, Hansen HH, Bailoni L, Schiavon S. 2014. Technical note: in vitro total gas and methane production measurements from closed or vented rumen batch culture systems. J Dairy Sci. 97:1736–1741. doi: 10.3168/jds.2013-7462
- Cone JW, van Gelder AH, Bachmann H. 2002. Influence of inoculum source on gas production profiles. Anim Feed Sci Technol. 99:221–231. doi: 10.1016/S0377-8401(02)00073-1
- Cone JW, van Gelder AH, Visscher GJW, Oudshoorn L. 1996. Influence of rumen fluid and substrate concentration on fermentation kinetics measured with a fully automated time related gas production apparatus. Anim Feed Sci Technol. 61:113–128. doi: 10.1016/0377-8401(96)00950-9
- Cornou C, Drejer Storm IML, Hindrichsen IK, Worgan H, Bakewell E, Yáñez Ruiz DR, Abecia L, Tagliapietra F, Cattani M, Ritz C, Hansen HH. 2013. A ring test of a wireless in vitro gas production system. Anim Prod Sci. 53:585–592. doi: 10.1071/AN12091
- Davies ZS, Mason D, Brooks AE, Griffith GW, Merry RJ, Theodorou MK. 2000. An automated system for measuring gas production from forages inoculated with rumen fluid and its use in determining the effect of enzymes on grass silage. Anim Feed Sci Technol. 83:205–221. doi: 10.1016/S0377-8401(99)00138-8
- Deckardt K, Khol-Parisini A, Zebeli Q. 2013. Peculiarities of enhancing resistant starch in ruminants using chemical methods: opportunities and challenges. Nutrients. 5:1970–1988. doi: 10.3390/nu5061970
- Edmunds B, Südekum KH, Schwarz FJ, Schuster M, Spiekers H. 2010. Evaluating the protein value of forages using a modified gas test. In: Crovetto GM, editor. Energy and protein metabolism and nutrition. EAAP publication no. 127. Wageningen: Wageningen Academic Publishers; p. 719–720.
- Edmunds B, Südekum KH, Spiekers H, Schuster M, Schwarz FJ. 2012. Estimating utilisable crude protein at the duodenum, a precursor to metabolisable crude protein for ruminants, from forages using a modified gas test. Anim Feed Sci Technol. 175:106–113. doi: 10.1016/j.anifeedsci.2012.05.003
- France J, Dijkstra J, Dhanoa MS, Lopez S, Bannink A. 2000. Estimating the extent of degradation of ruminant feeds from a description of their gas production profiles observed in vitro: derivation of models and other mathematical considerations. Br J Nutr. 83:143–150. doi: 10.1017/S0007114500000180
- Gefrom A, Ott EM, Hoedtke S, Zeyner A. 2013. Effect of ensiling moist field bean (Vicia faba), pea (Pisum sativum) and lupine (Lupinus spp.) grains on the contents of alkaloids, oligosaccharides and tannins. J Anim Physiol Anim Nutr. 97:1152–1160. doi: 10.1111/jpn.12024
- GfE. 2009. New equations for predicting metabolisable energy of compound feeds for cattle. 63rd Conference of the Society of Nutrition Physiology. Göttingen. p. 143–146.
- Gierus M, Schiborra A, Südekum KH, Rave G, Taube F. 2008. Comparison of gas accumulation profiles of several feeds using manual or automated gas production methods. Anim Feed Sci Technol. 147:310–325. doi: 10.1016/j.anifeedsci.2008.02.001
- Hoedtke S, Zeyner A. 2011. Comparative evaluation of laboratory-scale silages using standard glass jar silages or vacuum-packed model silages. J Sci Food Agr. 91:841–849. doi: 10.1002/jsfa.4255
- Honig H. 1990. Evaluation of aerobic stability. EUROBAC Conference, Uppsala. p. 72–78.
- Kand D, Bagus Raharjo I, Castro-Montoya J, Dickhoefer U. 2018. The effects of rumen nitrogen balance on in vitro rumen fermentation and microbial protein synthesis vary with dietary carbohydrate and nitrogen sources. Anim Feed Sci Technol. 241:184–197. doi: 10.1016/j.anifeedsci.2018.05.005
- Karlsson L, Hetta M, Udén P, Martinsson K. 2009. New methodology for estimating rumen protein degradation using the in vitro gas production technique. Anim Feed Sci Technol. 153:193–202. doi: 10.1016/j.anifeedsci.2009.06.010
- Keim JP, Alvarado-Gilis C, Arias RA, Gandarillas M, Cabanilla J. 2017. Evaluation of sources of variation on in vitro fermentation kinetics of feedstuffs in a gas production system. Anim Sci J. 88:1547–1555. doi: 10.1111/asj.12825
- Khorasani GR, Okine EK, Corbett RR, Kennelly JJ. 2001. Nutritive value of peas for lactating dairy cattle. Can J Anim Sci. 81:541–551. doi: 10.4141/A01-019
- Kuhnitzsch C, Hofmann T, Bachmann M, Martens SD, Henle T, Zeyner A, Steinhöfel O. 2019. Effect of ensiling and toasting of field pea grains on formation of Maillard polymers from lysine and arginine. Adv Anim Biosci. 10:540.
- Licitra G, Hernandez TM, Van Soest PJ. 1996. Standardization of procedures for nitrogen fractionation of ruminant feeds. Anim Feed Sci Technol. 57:347–358. doi: 10.1016/0377-8401(95)00837-3
- Masoero F, Pulimeno AM, Rossi F. 2005. Effect of extrusion, expansion and toasting on the nutritional value of peas, faba beans and lupins. Ital J Anim Sci. 4:177–189. doi: 10.4081/ijas.2005.177
- Mauricio RM, Mould FL, Dhanoa MS, Owen E, Channa KS, Theodorou MK. 1999. A semi-automated in vitro gas production technique for ruminant feedstuff evaluation. Anim Feed Sci Technol. 79:321–330. doi: 10.1016/S0377-8401(99)00033-4
- Menke KH, Raab L, Salewski A, Steingass H, Fritz D, Schneider W. 1979. The estimation of the digestibility and metabolizable energy content of ruminant feedingstuffs from the gas production when they are incubated with rumen liquor in vitro. J Agr Sci. 93:217–222. doi: 10.1017/S0021859600086305
- Menke KH, Steingass H. 1988. Estimation of the energetic feed value from chemical analysis and in vitro gas production using rumen fluid. Anim Res Dev. 28:7–55.
- Raab L, Cafantaris B, Jilg T, Menke KH. 1983. Rumen protein degradation and biosynthesis 1. A new method for determination of protein degradation in rumen fluid in vitro. Br J Nutr. 50:569–582. doi: 10.1079/BJN19830128
- Steingass H, Nibbe D, Südekum KH, Lebzien P, Spiekers H. 2001. Schätzung des nXP-Gehaltes mit Hilfe des modifizierten Hohenheimer Futterwerttests und dessen Anwendung zur Bewertung von Raps- und Sojaextraktionsschroten. VDLUFA-Kongress, Berlin, p. 114.
- Tagliapietra F, Cattani M, Bailoni L, Schiavon S. 2010. In vitro rumen fermentation: effect of headspace pressure on the gas production kinetics of corn meal and meadow hay. Anim Feed Sci Technol. 158:197–201. doi: 10.1016/j.anifeedsci.2010.04.003
- Tufarelli V, Khan RU, Laudadio V. 2012. Evaluating the suitability of field beans as a substitute for soybean meal in early-lactating dairy cow: production and metabolic responses. Anim Sci J. 83:136–140. doi: 10.1111/j.1740-0929.2011.00934.x
- Vaga M, Hetta M, Huhtanen P. 2017. Effects of heat treatment on protein feeds evaluated in vitro by the method of estimating utilisable crude protein at the duodenum. J Anim Physiol Anim Nutr. 101:1259–1272. doi: 10.1111/jpn.12646
- van Gelder AH, Hetta M, Rodrigues MAM, De Boever JL, Den Hartigh H, Rymer C, van Oostrum M, van Kaathoven R, Cone JW. 2005. Ranking of in vitro fermentability of 20 feedstuffs with an automated gas production technique: results of a ring test. Anim Feed Sci Technol. 123-124:243–253. doi: 10.1016/j.anifeedsci.2005.04.044
- van Laar H, van Straalen WM, van Gelder AH, De Boever JL, D'heer B, Vedder H, Kroes R, de Bot P, van Hees J, Cone JW. 2006. Repeatability and reproducibility of an automated gas production technique. Anim Feed Sci Technol. 127:133–150. doi: 10.1016/j.anifeedsci.2005.08.009
- Váradyová Z, Baran M, Zeleňák I. 2005. Comparison of two in vitro fermentation gas production methods using both rumen fluid and faecal inoculum from sheep. Anim Feed Sci Technol. 123-124:81–94. doi: 10.1016/j.anifeedsci.2005.04.030
- VDLUFA. 2012. Methodenbuch, Vol. 3, Die chemische Untersuchung von Futtermitteln. Darmstadt: VDLUFA-Verlag.
- Yu P, Goelema JO, Leury BJ, Tamminga S, Egan AR. 2002. An analysis of the nutritive value of heat processed legume seeds for animal production using the DVE/OEB model: a review. Anim Feed Sci Technol. 99:141–176. doi: 10.1016/S0377-8401(02)00114-1