
 ?Mathematical formulae have been encoded as MathML and are displayed in this HTML version using MathJax in order to improve their display. Uncheck the box to turn MathJax off. This feature requires Javascript. Click on a formula to zoom.
ABSTRACT
An experiment was conducted to evaluate modelling relationships between pig’s body surface temperature and ambient environment including inside and outside of pig barn. For this purpose, four different artificial neural network (ANN), including Feed Forward Back-propagation (FFB), Layer recurrent (LR), Elman (EL) and Cascade Forward Back-propagation (CFB) with different learning algorithms, transfer functions, hidden layers and neuron in each layer, and multi-linear regression (MLR) models have been performed to predict body temperature of pig. Six two-month-old pigs were studied over a period of 92 days during two years (2017–2018) to develop and evaluate the ANN and MLR models. The performance of the models in predicting pig’s body temperature was determined using statistical quality parameters, including coefficient of determination (R2), root mean square error (RMSE) and mean absolute percentage error (MAPE). The FFB model with the Levenberg-Marquardt training function, Gradient descent weight and bias learning function, Log-sigmoid transfer function and two hidden layers with 20 neurons was found as the best model. Sensitivity analysis indicated that the temperature-humidity index (THI) inside the room is the most influential factor in predicting pig’s body temperature in the MLR/ANN models.
1. Introduction
Body temperature is of vital importance for all biological functions of animals. The rate of metabolic processes increases with temperature, but if temperature is elevated beyond a certain threshold limit, biological functions may not work properly (Kessel et al. Citation2010). Therefore, there is a growing concern in measuring body surface temperature of animals and ambient environment inside and outside of a livestock barn for determining thermal comfort zone. Temperature, relative humidity, ammonia and carbon dioxide concentration are the most pivotal environmental parameters for life and govern the performance and fitness of animal (Rome et al. Citation1992; Le et al. Citation2009; Süli et al. Citation2017). Among above environmental parameters, it is well established that physiological processes are strongly temperature sensitive and mostly occur within a narrow range of body temperatures (Peterson et al. Citation1993; Zimmerman et al. Citation1994; Sagonas et al. Citation2013). The effectiveness of thermoregulation depends, to a large extent, on body temperature (Huey and Stevenson Citation1979) and ambient environmental conditions inside and outside livestock barn (Cervantes et al. Citation2018).
As homeothermic animals, pigs preserve relatively constant their body temperature over a certain range of ambient temperature, relative humidity, carbon dioxide concentration etc. (Mader et al. Citation2006, Jeong Citation2012; Rezende and Bacigalupe Citation2015; Basak et al. Citation2019). Some studies reported that at low ambient temperature and high relative humidity, pigs generate heat through increasing basal metabolism (Adair and Black Citation2003) and the thermic effect of feed (Levine Citation2004). At high ambient temperature and low relative humidity pigs use a well-regulated mechanism to dissipate heat to the environment (Morera et al. Citation2012) preventing excess body heat (Quiniou et al. Citation2001; Kerr et al. Citation2003; Sagonas et al. Citation2013). In addition, Wilson and Crandall (Citation2011) examined that when pigs face heat stress, they increase their heart rate, respiratory frequency and peripheral blood flow to promote loss of heat and also, decrease voluntary feed intake (Huynh et al. Citation2005; Renaudeau et al. Citation2010). Morales et al (Citation2016) and Cervantes et al (Citation2017) in their studies evaluated an increment of up to 2.0°C in the body temperature of pigs when exposed to high ambient temperature and low relative humidity in pig barn. From the previous studies, it can be observed that a substantial portion of pig’s body temperature depends on the balance within the ambient environmental parameters, the production of body heat and their capability to dissipate heat. Therefore, pig’s body temperature, as an integrating trait, is affected by several components, either directly or indirectly.
To address this subject, pig’s body temperature can be predicted indirectly using ambient environmental and growth-related parameters. Until now, most of the modelling studies on pig’s body temperature prediction have focused on simple correlation, path analysis, linear and multi-linear regression, stepwise regression, factor analysis and principle component analysis (PCA) (Jang et al. Citation2015; McClure Citation2015; Mostaço et al. Citation2015; Soerensen and Pedersen Citation2015; Basak et al. Citation2019), of which a linear relationship between variables and body temperature of pig is assumed. Although these methods would reduce the number of input variables, they are neither sufficient nor comprehensive enough to really show the interactions of ambient environmental conditions and pig’s body temperature. Additionally, they would not be able to capture the highly non-linear and complex relations between pig’s body temperature and other parameters. Unlike linear-based models, artificial neural networks (ANNs), genetic expression (GE), Bayesian classification (BC) or other non-linear models would be appropriate when non-linearity and complex relationships exist among the considered variables (Farjam et al. Citation2014; Sabzalian et al. Citation2014; Mansouri et al. Citation2016; Abdipour et al. Citation2018, Citation2019). It has been documented by many studies that non-linear approaches such as ANNs interoperate variable relationships more accurately than other methods and it would be more capable to predict output variables compared to the linear-based methods (Khairunniza-Bejo et al. Citation2014; Safa et al. Citation2016; Abdipour et al. Citation2019). Odabas et al (Citation2014) noted that ANN provides less error and is more capable than MLR or any other linear-based models to find the best pattern of variables.
ANNs have been widely utilized to handle non-linear data processing (Shin et al. Citation2000). Different architectures of ANN like back propagation neural network (Srivastava Citation2003), adaptive logic network (Qu et al. Citation2001), radial basis function network (Boilot et al. Citation2002), FuzzyAR TMAP (Boilot et al. Citation2002), self-organizing map network (Sinesio et al. Citation2000) and time-delay neural network (Zhang et al. Citation2003) have been applied to analyze data. In food safety research, ANNs have been used in conjunction with electronic nose systems for detection of Escherichia coli in packaged alfalfa sprouts (Siripatrawan et al. Citation2004; Siripatrawan et al. Citation2006) and for beef spoilage/contamination detection (Panigrahi et al. Citation2006; Balasubramanian et al. Citation2009). Moreover, ANNs and fuzzy logics have been widely used in agricultural field for yield prediction of crops such as wheat, corn, soybean, potato, barley etc. (Alvarez Citation2009; Mutlu et al. Citation2011; Moradi et al. Citation2013; Ahmadi et al. Citation2014; Odabas et al. Citation2014; Matsumura et al. Citation2015; Safa et al. Citation2016; Fieuzal et al. Citation2017; Abdipour et al Citation2019). However, few studies have been conducted in the field of animal science on the prediction of pig’s body temperature, considering ambient environmental parameters inside and outside pig barn using ANN models. Therefore, this study was conducted to develop ANN models that can predict pig’ body temperature giving input variables. The objectives of the present study were to build up and evaluate the predictive performance of ANNs and MLR-based models for predicting body temperature of pig using input variables and also to analyze the sensitivity of the input variables to determine the most and the least influential parameters on pig’s body surface temperature.
2. Materials and methods
2.1 Experimental pig barn
The research was conducted in an experimental pig barn located in the Gyeongsang National University (latitude 35o9'6.14"N, longitude 128o5'44.40"E and altitude 44 m). Each experiment pig barn had an average size of 3.3 m (width) × 5.4 m (length) × 2.9 m (height) and 0.05 m thickness of roofs and walls. Galvanized steel was used in the construction of walls and roof was made using expanded polystyrene. These materials were used due to their usefulness in keeping comfortable environment inside the pig barn (Moon et al. Citation2016). Moreover, the galvanized steel was properly fixed inside and outside with expended polystyrene materials. To circulate air flow within the pig barn, a constantly ventilated exhaust fan and an air inlet damper (Auto-Damper 250, Sanison Co., Ltd., Korea) with an average flow rate of 0.16 m3/s were installed at a height of 1.44 and 1.72 m, respectively above the ground level in the pig barn.
2.2 Experimental design and data collection
In this experiment, six two-month-old Yorkshire breed pigs with an initial body weight of 30.3 ± 0.85 kg (mean ± s.d.) were studied. Two independent experiments were performed from 15 September to 15 December in 2017 and 2018 with the same number of pigs. The experimental period was selected based on the comfortable temperature available in the pig barn during these period. The research team had interacted with pig’s farmers to gather their understanding of weather variability in pig barn. According to Dong et al. (Citation2001), temperatures of 16–25°C are most comfortable for sows in pig barn. Before the beginning of the experiment, a two-week observation phase was implemented to define the best data measuring conditions. On the first day of each experiment, ear tags were implanted for identification in each pig after cleaning and disinfection of the application spot on the skin with isopropyl alcohol. The barn was equipped with drinkers and feeders, and the pigs were restrained with halters for feeding and drinking. The feed was provided twice a day, at 10.00 am and 17.00 pm in an equal amount of feed, and the amounts of feed offered and leftovers of each pig were recorded daily to estimate feed intake. Moreover, the body weights were determined by averaging weights measured on two times in day at study onset.
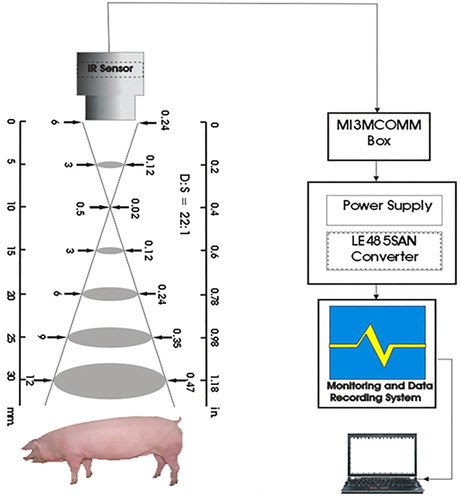
The body surface temperature of pig was measured using four infrared sensors (IR sensor, model-MI3, Raytek corporation, California, United States of America) at a fixed distance (20 cm) which were positioned perpendicularly to the pig’s body at four different body regions of each pig: left side (LS), right side (RS), forehead (FH) and back side (BS) at the same time (). The IR sensor is a non-contact and non-invasive temperature measuring instrument, which has been adopted in a number of studies for measuring body surface temperature of livestock and wildlife animals (GürdiL et al. Citation2007; Mccafferty and Dominic Citation2007), for disease detection (Montanholi et al. Citation2008; Schaefer et al. Citation2012) and animal welfare (Stewart et al. Citation2005; Nääs et al. Citation2014). Since it is unnecessary to touch the pig’s body, infrared (IR) measurement technique considerably reduces the risk of spreading infection. Moreover, in animals, this is advantageous since handling and restraint increase stress, causing effects on core and surface temperatures (Loughmiller et al. Citation2001; Vianna et al. Citation2005; Ludwig et al. Citation2007; Stewart et al. Citation2010; Magnani et al. Citation2011 and Warriss et al. Citation2006). The IR sensor recorded readings every 2 h in a day, from 9.00 am to 17.00 pm and the measured temperature data were automatically transmitted to computer. Furthermore, detailed experimental observations were made on different management systems such as feeding, drinking, manure etc. in day time for a more explanation of the experimental set-up. Livestock environment management systems (LEMS) and weather sensors were installed to record data of temperature, humidity, carbon dioxide, smoke and wind speed in every five-minute intervals inside and outside of pig barn, respectively. However, for this the study we used the equal interval data obtained from IR sensor, LEMS and weather sensor during the experiment period. The LEMS and weather sensors’ data reception were connected to the computer where the data were transmitted for storage.
Figure 1. Schematic diagram for measuring pig’s body temperature using IR sensor.
2.3 Development of artificial neural network
Artificial neural networks (ANNs) are made up of interconnecting artificial neurons, which may be used either to gain an understanding of biological neural networks or to solve artificial intelligence problems without the need to create a model of a real biological system (Bishop Citation1996; Nadimi et al. Citation2011). To develop an ANN topology, three main layers, the input, hidden and output layers are required (). Each ANN contains neurons or nodes, which are connected to each other by weighted connections according to the required specified architecture and the weighted values are automatically adjusted by training the network according to a specified learning rule until it performs the desired task appropriately (Bishop Citation1996; Khashei-Siuki et al. Citation2011). The number of hidden nodes is selected based on the specific problem of the study and typically is determined by trial and error (Tufail et al. Citation2008). The reliability of the neural network performance is measured by testing the network with several input–output vectors (Bishop Citation1996). Samarasinghe (Citation2016) discussed the ANN theory and its application for applied sciences and engineering fields. The output of the ANN network was reported by Hydrology (Citation2000) as shown in Equation (1).(1)
(1) where yt is the network output (pig’s body temperature), n is the number of hidden nodes, m is the number of input nodes, f is the transfer function,
are the weights from the input to hidden nodes,
are the vectors of weights from the hidden to the output nodes and α0 and β0j denote the weights of arcs leading from the bias terms.
Figure 2. Topology of Feed Forward Back-propagation neural network for log-sigmoid transfer function with 12 neurons (n) in hidden layers to predict pig’s body temperature. W and B of the ANN model are shown weight to hidden layer from input layer, weight to layer, hidden layer to output layer and bias to layer, bias to layer 2 and bias to output layer.
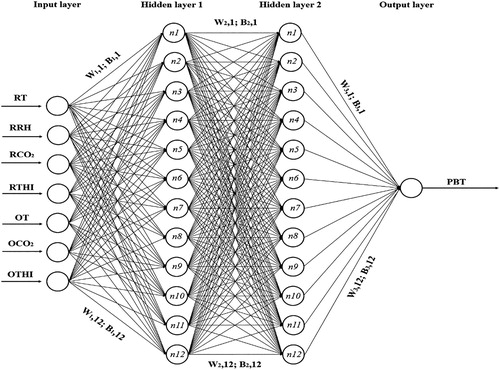
In the present work, different ANN models were developed using the Matlab (R2018a) neural network toolbox. To evaluate the capability of ANNs to predict pig’s body temperature, four different ANN models, including Feed Forward Back-propagation (FFB), Layer recurrent (LR), Elman (EL) and Cascade Forward Back-propagation (CFB) with different learning algorithms, transfer functions, hidden layers and neuron in each layer, were performed. To find the best topology for each ANN model, two hidden layers and neurons in each hidden layer (4–20) were tested through trial and error. The Levenberg-Marquardt training function, Gradient descent weight and bias learning function and the three transfer functions (Log-sigmoid, Linear transfer function (purelin) and Tan-sigmoid) were examined for the hidden and output layers to elucidate which function performed better. A maximum 1000 epochs (iterations) and mean square error (MSE) were used for each run on the training, testing and cross-validation dataset. Finally, the best ANN architecture for desirable output was determined based on the lowest error on the training, testing and validation sets of data. In avoidance of the risk of overtraining and memorization, the convergence of the average of RMSE values during the training, testing and cross-validation stages in different epochs (6–1000) were investigated. The dataset was randomly partitioned into three subsets (65%), (20%) and (15%) for training, testing and validation of the ANNs and MLR, respectively (Abdipour et al. Citation2018).
2.4 Development of multiple linear regression model
Multiple linear regression (MLR), also known simply as multiple regression, has been used extensively in agricultural fields more than other prediction techniques (Parimala and Mathur Citation2006; Golkar et al. Citation2011; Huang et al. Citation2013; Abdipour et al. Citation2015; Abdipour et al. Citation2016; Basak Citation2019). The goal of MLR is to model the linear relationship between the explanatory (independent) and response (dependent) variables. As a predictive analysis, MLR is based on linear and additive associations of the explanatory variables and attempts to model the relationship between two or more explanatory variables and a dependent variable by the assumption of a linear relationship (Abdipour et al. Citation2019). Multiple linear regression model was developed according to Equation (2) (Darlington and Hayes Citation2016):(2)
(2) where yi is the body surface temperature, β0–βn are the coefficients of regression, X1–Xn are the input variables and ε is the error associated with the ith observation.
2.5 Model performance and data analysis
The model performance to predict the desired output was determined using four statistical quality parameters, including root mean square error (RMSE), mean absolute error (MAE), mean absolute percentage error (MAPE) and coefficient of determination (R2). They are mathematically expressed as shown from Equations (3)–(6).(3)
(3)
(4)
(4)
(5)
(5)
(6)
(6) where n is the number of data, Oi is the observed values, Pi is the predicted values and the bar denotes the mean of the variable. Moreover, a sensitivity analysis was also conducted in this study to observe the effects of independent variables on the output and provide insight into the usefulness of individual variable. Statistical calculations were performed with Statistical Package for the Social Sciences (IBM SPSS Statistics 22.0.0.0, New York, United States of America) and Origin Pro 9.5.5 (OriginLab, Northampton, Massachusetts, United States of America).
3. Results and discussion
3.1 Input variables selection
The selection of input variables is an important consideration in each ANNs and MLR modelling methods to determine the model structure (). It also affects the weighted coefficient of ANNs and the results of those models (Emamgholizadeh et al. Citation2015). Although there are different methods to select the best input variables, the correlation coefficient is one of the effective methods for this purpose (Abdipour et al. Citation2019). It deduces simple relationships between variables, and it would be helpful in identifying the traits by which they have a strong correlation between input and output variable. In the present study, correlation coefficient method has been performed to analyze the relationship between input and output variables. As it is clear from , there is positive correlation between pig’s body temperature (PBT) and room temperature (RT), room temperature-humidity index (RTHI), outside temperature (OT), outside temperature-humidity index (OTHI). Similar results were reported by other researchers that RT (Barb et al. Citation1991; Azim et al. Citation1996; Prunier et al. Citation1997; Burri et al. Citation2009; Basak Citation2019), RTHI (Bouraoui et al. Citation2002; Mader Citation2006; White et al. Citation2008; Renaudeau et al. Citation2011; Ross et al. Citation2015; Basak Citation2019), OT (Christon Citation1988; Verstegen and Close Citation1994), OTHI (Amezcua et al. Citation2014) are constantly associated with the body temperature of pig. Negative correlation was also observed between PBT and the room relative humidity (RRH), room CO2 concentration (RCO2) and the outside CO2 concentration (OCO2). In confirmation of the above results, some researchers reported a negative correlation, and had an association between PBT and RRH (Ingram Citation1965; Brown Citation2011; Basak et al. Citation2019), RCO2 and OCO2 (Hartung et al. Citation1994; Arieli and Kerem Citation1995; Le et al. Citation2009). However, the outside relative humidity (ORH), age of pig (AG), feed intake (FI) and body weight (BW) showed no significant correlation with PBT. Based on the correlation results, RT, RRH, RCO2, RTHI, OT, OCO2 and OTHI were considered as the most important traits for evaluating the ANNs and MLR models because they have a good correlation (r ≥ 0.5) with pig’s body temperature.
Figure 3. Pearson correlation coefficients of input variables with body temperature of pig. AG: age of pig; FI: feed intake; BW: body weight of pig of capsules per plant; OTHI: outside temperature-humidity index; OCO2: outside CO2 concentration; ORH: outside relative humidity, OT: outside temperature; RTHI: room temperature-humidity index; RCO2: room CO2 concentration; RRH: room relative humidity; RT: room temperature.
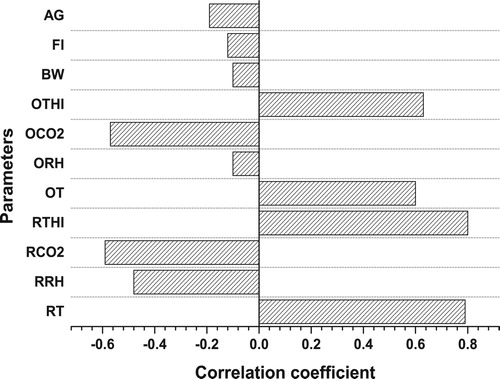
Table 1. Summary of the estimated parameters for ANN/MLR models.
3.2 Artificial neural network model development and performance
To achieve an efficient model through input variables (RT, RRH, RCO2, RTHI, OT, OCO2 and OTHI), four different ANNs models, including Feed Forward Back-propagation (FFB), Layer recurrent (LR), Elman (EL) and Cascade Forward Back-propagation (CFB) with Levenberg-Marquardt training function, Gradient descent weight and bias learning function and the three transfer functions (Log-sigmoid, Linear transfer function (purelin) and Tan-sigmoid) were trained with two hidden layers and neurons in each hidden layer (4–20). In this study, ANN models were performed to identify the relationship between input–output variables aided by hidden layer nodes, which the nodes clarify the conformation of the data measured from experiment. The results of the R2 and RMSE for each ANN model with three different transfer functions for training, validation and testing stage are shown in . As shown in , the development of FFB model with log-sigmoid transfer function, LR with tan-sigmoid transfer function, EL with tan-sigmoid transfer function and CFB model with log-sigmoid transfer function had the best performance due to the least RMSE and the highest R2 in training, validation and testing stages. These models have been used by many researchers to predict the performance of different animals and crops fields (Aarnink and Elzing Citation1998; Arogo et al. Citation2003; Grivas and Chaloulakou Citation2006; Kai et al. Citation2006; Emamgholizadeh et al. Citation2015; Abdipour et al. Citation2018). Regarding the performance of non-linear functions in this study, the relations between input variables and pig’s body temperature may be somewhat non-linear in nature due to higher efficiency. As the results showed, the performance of the ANN models with a linear function such as purelin decreased because of high RMSE values in training, validation and testing stages (). This reduction in efficiency is probably related to the nature of the function, since linear functions perform a simple linear transformation on the processed input and then carry it to the output layer (Hagan et al. Citation1996; Abdipour et al. Citation2019). Compared to other transfer functions, non-linear variations have been used in many studies due to the high prediction accuracy (Alvarez Citation2009; Ahmadi et al. Citation2014; Mansouri et al. Citation2016; Elhami et al. Citation2017; Mansourian et al. Citation2017).
Table 2. The performance of the artificial neural network models with different transfer functions to predict body surface temperature of pig.
To find the appropriate number of neurons in hidden layers for the selected networks and transfer function, FFB model with log-sigmoid, LR with tan-sigmoid, EL with tan-sigmoid and CFB model with log-sigmoid and different number of neurons in each hidden layer (4–20) were tested through trial and error (). As the results showed, the FFB model and two hidden layers and 20 neurons in the hidden layer have given the best results in training (RMSE = 0.967 and R2 = 0.867), validation (RMSE = 1.003 and R2 = 0.859) and testing (RMSE = 0.888 and R2 = 0.895) stages. This model with a relatively simple topology had the highest performance to predict pig’s body temperature. Even though the complexity of the model which depends on the nature of the subject and types of input variables, the ANN models with simple topology that achieved in this study are more admired and accepted by the researchers (Zeng et al. Citation2016; Mansourian et al. Citation2017; Abdipour et al. Citation2018; Niazian et al. Citation2018).
Table 3. The performance of the artificial neural network models with different neurons in hidden layers to predict body surface temperature of pig.
To better understand the distribution of data and the ability of the selected models, the predicted and actual pig’s body temperature values for complete dataset were presented and compared in the scatter plots and box plots (– and and ). As shown in the scatter plots obtained from FFB model ( and ), the predicted PBT values have a very close distribution pattern with measured PBT values, and both have almost the same pattern with R2 = 0.871, RMSE = 0.961 and MAPE = 2.207. Also, based on the box plots results for FFB model ((b)), the both measured and predicted datasets with having same statistical parameters, such as the minimum of the sample, lower quartile, median, upper quartile and maximum of the sample, did not show significant difference. Moreover, the lack of outliers (unusual values of data) in the box plot ((b)), once again identified the FFB model for log-sigmoid transfer function with 20 neurons in two hidden layers as the best to predict PBT.
Figure 4. Measured and predicted pig’s body temperature in Feed Forward Back-propagation neural network for log-sigmoid transfer function with 20 neurons in hidden layers. (a) Scatter plot of measured and predicted pig’s body temperature. (b) Box plot of measured and predicted pig’s body temperature.

Figure 5. Measured and predicted pig’s body temperature in Layer recurrent neural network for Tan-sigmoid transfer function with 12 neurons in hidden layers. (a) Scatter plot of measured and predicted pig’s body temperature. (b) Box plot of measured and predicted pig’s body temperature.
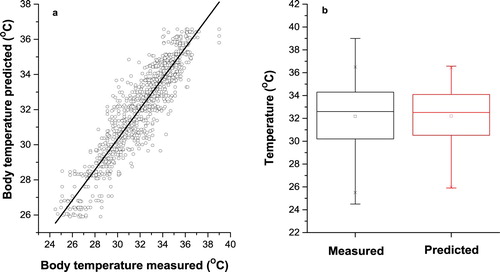
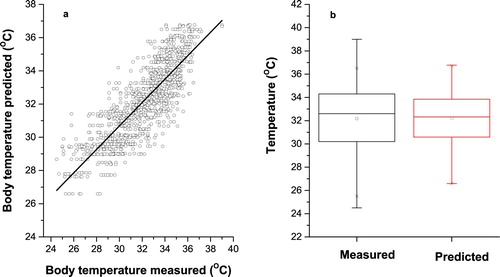
Figure 6. Measured and predicted pig’s body temperature in Elman neural network for Tan-sigmoid transfer function with 20 neurons in hidden layers. (a) Scatter plot of measured and predicted pig’s body temperature. (b) Box plot of measured and predicted pig’s body temperature.
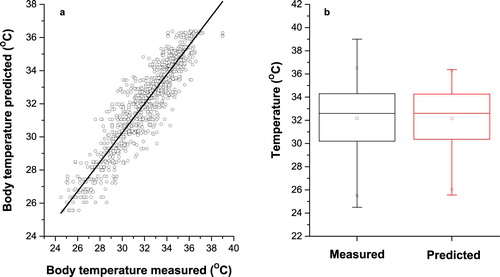
Figure 7. Measured and predicted pig’s body temperature in Cascade Forward Back-propagation neural network for log-sigmoid transfer function with 16 neurons in hidden layers. (a) Scatter plot of measured and predicted pig’s body temperature. (b) Box plot of measured and predicted pig’s body temperature.
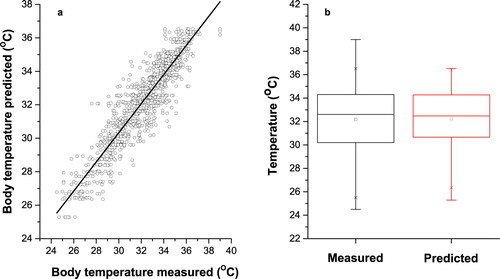
Table 4. The overall performance of the artificial neural network models with different transfer functions to predict body surface temperature of pig.
Table 5. The overall performance of the artificial neural network models with different neurons in hidden layers.
3.3 Multiple linear regression model development and performance
The prediction efficiency of regression-based models depends on the existence of linear relationships between input and output variables. Due to their simplicity, MLR models have been used in many studies compared to any other modelling techniques in agricultural sectors (Parimala and Mathur Citation2006; Karimi et al. Citation2009; Golkar et al. Citation2011; Ghoreishi et al. Citation2012; Huang et al. Citation2013; Abdipour et al. Citation2015; Abdipour et al. Citation2016; Basak Citation2019). By taking the same inputs and output data which were used for the ANN models, the efficiency of the regression model was evaluated to predict the PBT. The following equation (7) was computed to predict PBT:(7)
(7) where PBT is the pig’s body temperature, RT is the room temperature, RRH is the room relative humidity, RCO2 is the room CO2 concentration, RTHI is the room temperature-humidity index, OT is the outside temperature, OCO2 is the outside CO2 concentration and OTHI is the outside temperature-humidity index (OTHI).
The predicted PBT value in Equation (7) is a linear combination of the input variables (RT, RRH, RCO2, RTHI, OT, OCO2 and OTHI), such that the sum of the squared deviations of the measured and predicted PBT values is minimum. A formula model such as Equation (7) is useful in understanding how PBT changes with RT, RRH, RCO2, RTHI, OT, OCO2 and OTHI and what values of these variables are required to achieve the optimal value of PBT. The MLR model was less capable of predicting PBT in training (with R2 = 0.720, RMSE = 1.383 and MAPE = 3.423), validation (with R2 = 0.765, RMSE = 1.235 and MAPE = 3.045) and testing (R2 = 0.640, RMSE = 1.723, MAPE = 4.536) compared to the ANN models. To evaluate the efficiency of the MLR model, the pattern of the distribution of actual and predicted values of PBT for complete dataset was compared on the scatter plot and box plot ((a,b)). As shown in the box plot ((b)), there is a difference between the actual and predicted values in terms of the minimum of the sample, lower quartile, median, upper quartile and maximum of the sample. Moreover, the existence of outliers can be attributed to the inability of the model to predict PBT properly. Although it is possible to achieve higher-performing regression models, in this study the MLR (with R2 = 0.710) cannot be considered as an optimum model for predicting PBT.
Figure 8. Measured and predicted pig’s body temperature in Multiple linear regression (MLR) model with seven input variables. (a) Scatter plot of measured and predicted pig’s body temperature. (b) Box plot of measured and predicted pig’s body temperature.
3.4 Comparing ANN and MLR models for predicting PBT
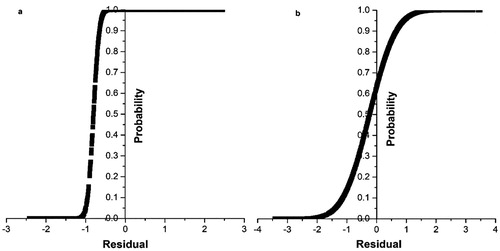
Based on statistical qualitative parameters (i.e. R2, RMSE and MAPE), the result of the study showed that all the ANN models provided a more powerful tool than the regression model for predicting PBT. The selected ANN model could predict PBT for training, validation and testing stages with a 20.42, 12.29 and 39.84% increase in R2 and a reduction of 30.10, 48.57 and 18.76% in RMSE, respectively, compared to the MLR model. Moreover, the ANN model to the MLR model is also well defined by considering the relatively similar values of the statistical parameters such as median or similar distribution for the actual and predicted values ((b) and (b)). In addition, a graphical presentation of the actual and predicted values by the ANN and MLR models over a graph () can help to better understand the ability of the two models for predicting PBT. Results obtained from the cumulative distribution function () showed that the predicted PBT values by the ANN model had greater prediction accuracy than the MLR model. As shown in , 80% of the data have a residual value between -1 and 1 for the ANN model, whereas it was 55% for the MLR model in the same boundary limit. Moreover, from the S-curve (), a significant proportion of the relationships between the input variables and PBT are followed through non-linear relationships, which may also affect the performance of the ANN and MLR models. However, the difference in performance between the ANN and MLR models showed the importance of choosing the best model to predict PBT. The higher ability of the ANN modelling methods compared with the MLR methods to capture the highly non-linear and complex relationship between output and inputs variables has been reported in many studies (Singh et al. Citation2003; Gholipoor et al. Citation2013; Khairunniza-Bejo et al. Citation2014; Mansourian et al. Citation2017; Abdipour et al. Citation2019). In general, all of the ANN models had higher efficiency in predicting PBT than the regression model in this study.
Figure 9. Cumulative distribution function calculated from measured and predicted pig’s body temperature. (a) Cumulative distribution function of measured and predicted pig’s body temperature for the ANN. (b) Cumulative distribution function of measured and predicted pig’s body temperature for the MLR.
3.5 Sensitivity analysis of input variables
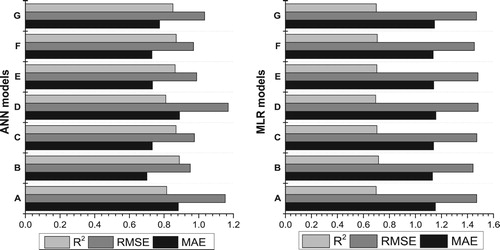
Sensitivity tests were performed for the both the MLR and ANN models in order to find out the individual effect of the input variables on the predicted PBT value. As shown in , the ability of the ANN and MLR models to predict PBT significantly decreased when they were run without RTHI. As illustrated in , the ANN and MLR models without RTHI had the lowest R2 (0.810, 0.694) and the highest RMSE (1.170, 1.482) and MAPE (2.592, 3.612), respectively. Therefore, RTHI can be said to be the most influential factor in predicting PBT in both models, followed by RT, OTHI, OT, RCO2, OCO2 and RRH, respectively. The importance of this variable to determine the PBT has led to the introduction of this variable in many modelling studies as an important indirect indicator to predict PBT (Basak Citation2019; Prunier et al. Citation1997; Azim et al. Citation1996; Barb et al. Citation1991; Burri et al. Citation2009; Mader Citation2006; Ross et al. Citation2015; White et al. Citation2008; Renaudeau et al. Citation2011; Bouraoui et al. Citation2002; Christon Citation1988; Verstegen and Close Citation1994; Amezcua et al. Citation2014). In addition to RTHI, three next important traits (i.e. RT, OTHI and OT) also had a significant effect to predict PBT in both models. These four traits (RTHI, RT, OTHI and OT) had a positive relationship and account for a total of 78% and 67% of the PBT variation in the ANN and MLR models, respectively. Therefore, they can be considered as the most important indirect indicators in the pig farming to determine the thermal comfort zone.
Figure 10. Sensitivity analysis of the input variables on body temperature of pig in ANN and MLR models. A: The best ANN/MLR model without RT; B: MLR/ANN model without RRH; C: MLR/ANN model without RCO2; D: MLR/ANN model without RTHI; E: MLR/ANN model without OT; F: MLR/ANN model without OCO2; G: MLR/ANN model without OTHI.
4. Conclusion
The research was conducted to evaluate modelling relationships between pig’s body temperature and ambient environment inside and outside of a pig barn. In the current study, four different ANN (FFB, LR, EL and CFB) models, along with a MLR model, were developed with seven selected input variable i.e. RT, RRH, RTHI, RCO2, OT, OCO2 and OTHI to predict PBT. The results showed a higher performance rate by the ANN models as compared to the MLR model. FFB model with log-sigmoid transfer function and two hidden layers in 20 neurons was selected as the best model to predict the PBT. This priority for ANN models for predicting PBT may be due to the existing non-linear association between body temperature of pig and its components of which the MLR method is unable to explain in its model. These results indicated that the selected ANN model does not suffer from this problem and can assuredly replace multiple linear models such as MLR for predicting PBT. Sensitivity analysis showed the number of temperature-humidity index in room (RTHI) is the most influential factor to predict PBT in the MLR/ANN models, followed by room temperature (RT), outside temperature-humidity index (OTHI), outside temperature (OT), room CO2 concentration (RCO2), outside CO2 concentration (OCO2) and room relative humidity (RRH), respectively. Therefore, if the temperature-humidity index increases inside the pig barn, it might raise the body temperature of pigs which may create thermal uncomfortable situation in pig barn. Similar to those observed in this study, it can be said that maintaining temperature-humidity index within comfortable limit along with room temperature can be a good approach to addressing the thermal comfort zone in a livestock barn. However, the above-described ambient environmental parameters may not always be the same when associated with body temperature of pig, and also, trying to achieve high prediction efficiency of PBT using the same attributes may lead to changes in the performance of the models. Therefore, more environmental factors as well as other growth factors may be included in models.
Disclosure statement
No potential conflict of interest was reported by the author(s).
Additional information
Funding
References
- Aarnink AJA, Elzing A. 1998. Dynamic model for ammonia volatilization in housing with partially slatted floors, for fattening pigs. Livest Prod Sci. 53(2):153–169.
- Abdipour M, Ebrahimi M, Izadi-Darbandi A, Mastrangelo AM, Najafian G, Arshad Y. 2015. Variability and association grain weight with grain size (and shape) and grain quality, and stepwise regression analysis on thousand grain weight in Iranian durum wheat landraces. Biol Forum Res Trend. 7(2):944–954.
- Abdipour M, Ebrahimi M, Izadi-Darbandi A, Mastrangelo AM, Najafian G, Arshad Y, Mirniyam G. 2016. Association between grain size and shape and quality traits, and path analysis of thousand grain weight in Iranian bread wheat landraces from different geographic regions. Not Bot Horti Agrobot Cluj Napoca. 44(1):228–236.
- Abdipour M, Hmazekhanlu MY, Ramazani SHR, Omidi AH. 2019. Artificial neural networks and multiple linear regression as potential methods for modeling seed yield of safflower (Carthamus tinctorius L). Ind Crop Prod. 127:185–194.
- Abdipour M, Ramazani SHR, Younessi-Hmazekhanlu M, Niazian M. 2018. Modeling oil content of sesame (Sesamum indicum L.) using artificial neural network and multiple linear regression approaches. J Am Oil Chem Soc. 95:283–297.
- Adair ER, Black DR. 2003. Thermoregulatory responses to RF energy absorption. Bioelectromagnetics Suppl. 6:17–38.
- Ahmadi SH, Sepaskhah AR, Andersen MN, Plauborg F, Jensen CR, Hansen S. 2014. Modeling root length density of field grown potatoes under different irrigation strategies and soil textures using artificial neural networks. Field Crops Res. 162:99–107.
- Alvarez R. 2009. Predicting average regional yield and production of wheat in the Argentine pampas by an artificial neural network approach. Eur J Agron. 30:70–77.
- Amezcua MDR, Walsh S, Luimes PH, Friendship RM. 2014. Infrared thermography to evaluate lameness in pregnant sows. Can Vet J. 55(3):268–272.
- Arieli R, Kerem D. 1995. Effect of accumulation of CO2 on the survival of immature pigs in a confined atmosphere. A: gas exchange. J Basic Clin Physiol Pharmacol. 6(1):1–18.
- Arogo J, Westerman PW, Heber AJ. 2003. A review of ammonia emissions from confined swine feeding operations. Trans. ASAE. 46(3):805–817.
- Azain MJ, Tomkins T, Sowinski JS, Arentson RA, Jewell DE. 1996. Effect of supplemental milk replacer on litter performance: seasonal variation in response. J Anim Sci. 74:2195–2202.
- Balasubramanian S, Panigrahi S, Logue CM, Gu H, Marchello M. 2009. Neural networks-integrated metal oxide-based artificial olfactory system for meat spoilage identification. J Food Eng. 91:91–98.
- Barb CR, Estienne MJ, Kraeling RR, Marple DN, Rampacek GB, Rahe CH, Sartin JL. 1991. Endocrine changes in sows exposed to elevated ambient temperature during lactation. Domest Anim Endocrinol. 8:117–127.
- Basak JK, Arulmozhi E, Khan F, Okyere FG, Park J, Lee D, Kim HT. 2019. Assessment of the influence of environmental variables on pig’s body temperature using ANN and MLR models. Indian J. Anim. Res. (accepted). DOI:10.18805/ijar.B-1199.
- Bishop CM. 1996. Neural networks for pattern Recognition. USA: Published by Oxford University Press. ISBN: 978-0198538646.
- Boilot P, Hines EL, Gardner JW, Pitt R, John S, Mitchell J, Morgan DW. 2002. Classification of bacteria responsible for ENT and eye infections using the cyranose system. IEEE Sens J. 2(3):247–253.
- Bouraoui R, Lahmar M, Majdoub A, Djemali M, Belyea R. 2002. The relationship of temperature humidity index with milk production of dairy cows in a Mediterranean climate. Anim Res. 51:479–491.
- Brown JA, Samarakone TS, Crowe T, Bergeron R, Widowski T, Correa JA, Faucitano L, Torrey S, Gonyou HW. 2011. Temperature and humidity conditions in trucks transporting pigs in two seasons in Eastern and Western Canada. Trans ASABE. 54:2311–2318.
- Burri M, Wechsler B, Gygax L, Weber R. 2009. Influence of straw length, sow behavior and room temperature on the incidence of dangerous situations for piglets in a loose farrowing system. Appl Anim Behav Sci. 117:181–189.
- Cervantes M, Antoine D, Valle JA, Vásquez N, Camacho RL, Bernal H, Morales A. 2018. Effect of feed intake level on the body temperature of pigs exposed to heat stress conditions. J Therm Biol. 76:1–7.
- Cervantes M, Ibarra N, Vásquez N, Reyes F, Avelar E, Espinoza S, Morales A. 2017. Serum concentrations of free amino acids in growing pigs exposed to diurnal heat stress fluctuations. J Therm Biol. 69:69–75.
- Christon R. 1988. The effect of tropical ambient temperature on growth and metabolism in pigs. J Anim Sci. 66:3112–3123.
- Darlington RB, Hayes AF. 2016. Regression analysis and linear models: concepts, applications, and implementation. New York, NY 10001-1020: Guilford Publications.
- Dong H, Tao X, Lin J, Li Y, Xin H. 2001. Comparative evaluation of cooling systems for farrowing sows. Appl Eng Agric. 17(1):91–96.
- Elhami B, Khanali M, Akram A. 2017. Combined application of artificial neural networks and life cycle assessment in lentil farming in Iran. Inform Process Agric. 4:18–32.
- Emamgholizadeh S, Parsaeian M, Baradaran M. 2015. Seed yield prediction of sesame using artificial neural network. Eur J Agron. 68:89–96.
- Farjam A, Omid M, Akram A, Fazel NZ. 2014. A neural network based modeling and sensitivity analysis of energy inputs for predicting seed and grain corn yields. J Agric Sci Tech. 16:767–778.
- Fieuzal R, Sicre CM, Baup F. 2017. Estimation of corn yield using multi-temporal optical and radar satellite data and artificial neural networks. Int J Appl Earth Obs Geoinf. 57:14–23.
- Gholipoor M, Rohani A, Torani S. 2013. Optimization of traits to increasing barley grain yield using an artificial neural network. Int J Plant Prod. 7(1):1–18.
- Ghoreishi M, Hossini Y, Maftoon M. 2012. Simple models for predicting leaf area of mango (Mangiferaindica L). Adv Biol Earth Sci. 2(2):845–853.
- Golkar P, Arzani A, Rezaei A. 2011. Determining relationships among seed yield, yield components and morpho-phenological traits using multivariate analyses in safflower (Carthamus tinctorius L). Ann Biol Res. 2:162–169.
- Grivas G, Chaloulakou A. 2006. Artificial neural network models for prediction of PM10 hourly concentrations, in the greater area of Athens, Greece. Atmos Environ. 40(7):1216–1229.
- GürdiL GAK, Pinar Y, Selvi KÇ. 2007. Applications of infrared thermography in animal production. J Fac Agric. 22(3):329–336.
- Hagan MT, Demuth HB, Beale MH. 1996. Neural network Design. Boston: Boston PWS Pub.
- Hartung J, Phillips VR. 1994. Control of gaseous emissions from livestock buildings and manure stores. J Agric Eng Res. 57:173–189.
- Huang J, Wang X, Li X, Tian H, Pan Z. 2013. Remotely sensed rice yield prediction using multi-temporal NDVI data derived from NOAA's-AVHRR. PLoS One. 8(8):1–13.
- Huey RB, Stevenson RD. 1979. Integrating thermal physiology and ecology of ectotherms: a discussion of approaches. Amer Zool. 19:357–366.
- Huynh TTT, Aarnink AJA, Verstegen MWA, Gerrits WJJ, Heetkamp MJW, Kemps B, Canh TT. 2005. Effects of increasing temperatures on physiological changes in pigs at different relative humidity. J Anim Sci. 83:1385–1396.
- Hydrology, ASCE Task Committee on Application of Artificial Neural Networks in Hydrology. 2000. Artificial neural networks in hydrology. I: preliminary concepts. J Hydrol Eng. 5(2):115–123.
- Ingram DL. 1965. The effect of humidity on temperature regulation and cutaneous water loss in the young pig. Res Vet Sci. 6:9–17.
- Jang JC, Lee MH, Lee JY, Choi HC, Choi DY, Kim HJ, Kim HT. 2015. Monitoring pig body temperature using infrared sensors. J Biosyst Eng. 40(4):368–372.
- Jeong WY, Yi OH, Lee SC, Lee SR. 2012. Establishment of data base for body temperature change in cattle. Korean Soc Lives Hous Environ. 18:95–98.
- Kai P, Kaspers B, van Kempen T. 2006. Modeling source of gaseous emissions in a pig house with recharge pit. Trans ASABE. 49(5):1479–1485.
- Karimi S, Tavallali V, Rahemi M, Rostami AA, Vaezpour M. 2009. Estimation of leaf growth on the basis of measurements of leaf lengths and widths, choosing pistachio seedlings as model. Aust J Basic Appl Sci. 3(2):1070–1075.
- Kerr BJ, Yen JT, Nienaber JA, Easter RA. 2003. Influences of dietary protein level, amino acid supplementation and environmental temperature on performance, body composition, organ weights and total heat production of growing pigs. J Anim Sci. 81:1998–2007.
- Kessel L, Johnson L, Arvidsson H, Larsen M. 2010. The relationship between body and ambient temperature and corneal temperature. Invest Ophthalmol Vis Sci. 51(12):6593–6597.
- Khairunniza-Bejo S, Mustaffha S, Ismail WIW. 2014. Application of artificial neural network in predicting crop yield: a review. J Food Sci Eng. 4:1–9.
- Khashei-Siuki A, Kouchakzadeh M, Ghahraman B. 2011. Predicting dry land wheat yield from meteorological data using expert system, Khorasan Province. Iran J Agr Sci Tech. 13:627–640.
- Le PD, Aarnink AJA, Jongbloed AW. 2009. Odour and ammonia emission from pig manure as affected by dietary crude protein level. Livest Sci. 121:267–274.
- Levine JA. 2004. Nonexercise activity thermogenesis (NEAT): environment and biology. Am J Physiol Endocrinol Metab. 286(5):675–685.
- Loughmiller JA, Spire MF, Dritz SS, Fenwick BW, Hosni MH, Hogge SB. 2001. Relationship between mean body surface temperature measured by use of infrared thermography and ambient temperature in clinically normal pigs and pigs inoculated with Actinobacillus pleuropneumoniae. Am J Vet Res. 62:676–681.
- Ludwig N, Gargano M, Luzi E, Carenzi C, Verga M. 2007. Technical note: applicability of infrared thermography as a non-invasive measurement of stress in rabbit. World Rabbit Sci. 15:199–205.
- Mader TL, Davis MS, Brown-Brandl T. 2006a. Environmental factors influencing heat stress in feedlot cattle. J Anim Sci. 84(3):712–719.
- Mader TL, Davis MS, Brown-Brandl T. 2006b. Environmental factors influencing heat stress in feedlot cattle. J Anim Sci. 84:712–719.
- Magnani D, Gatto M, Cafazzo S, Stelletta C, Morgante M, Costa LN. 2011. Difference of surface body temperature in piglets due to the backtest and environmental condition. Conference Proceedings of International Society for animal Hygiene; 2011 6 July; Vienna. p. 1029–1032.
- Mansouri A, Fadavi A, Mortazavian SMM. 2016. An artificial intelligence approach for modeling volume and fresh weight of callus-a case study of cumin (Cuminum cyminum L). J Theor Biol. 397:199–205.
- Mansourian S, Darbandi EI, Mohassel MHR, Rastgoo M, Kanouni H. 2017. Comparison of artificial neural networks and logistic regression as potential methods for predicting weed populations on dry land chickpea and winter wheat fields of Kurdistan province, Iran. Crop Prot. 93:43–51.
- Matsumura K, Gaitan CF, Sugimoto K, Cannon AJ, Hsieh WW. 2015. Maize yield forecasting by linear regression and artificial neural networks in Jilin, China. J Agric Sci. 153:399–410.
- Mccafferty DJ. 2007. The value of infrared thermography for research on mammals: previous applications and future directions. Mammal Rev. 37:207–223.
- McClure ML, Burdett CL, Farnsworth ML, Lutman MW, Theobald DM, Riggs PD, Grear DA, Miller RS. 2015. Modeling and mapping the probability of occurrence of invasive wild pigs across the contiguous United States. PLoS ONE. 10(8):1–17.
- Montanholi YR, Nicholas EO, Kendall CS, Schenkel FS, Mcbride BW, Miller SP. 2008. Application of infrared thermography as an indicator of heat and methane production and its use in the study of skin temperature in response to physiological events in dairy cattle (Bos Taurus). J Therm Biol. 33(8):468–475.
- Moon BE, Kim HT, Kim JG, Ryou YS, Kim HT. 2016. A fundamental study for development of unglazed transpired collector control system in windowless pig house. J Agric Life Sci. 50(2):175–185.
- Moradi G, Dehghani S, Khosravian F, Arjmandzadeh A. 2013. The optimized operational conditions for biodiesel production from soybean oil and application of artificial neural networks for estimation of the biodiesel yield. Renew Energy. 50:915–920.
- Morales A, Cota SEM, Ibarra NO, Arce N, Htoo JK, Cervantes M. 2016. Effect of heat stress on the serum concentrations of free amino acids and some of their metabolites in growing pigs. J Anim Sci. 94:2835–2842.
- Morera P, Basirico L, Hosoda K, Bernabucci U. 2012. Chronic heat stress up-regulates leptin and adiponectin secretion and expression and improves leptin, adiponectin and insulin sensitivity in mice. J Mol Endocrinol. 48:129–138.
- Mostaço GM, Miranda KD, Condotta ID, Salgado D. 2015. Determination of piglets’ rectal temperature and respiratory rate through skin surface temperature under climatic chamber conditions. Eng Agríc Jaboticabal. 35(6):979–989.
- Mutlu AC, Boyaci IH, Genis HE, Ozturk R, Basaran-Akgul N, Sanal T, Evlice AK. 2011. Prediction of wheat quality parameters using near-infrared spectroscopy and artificial neural networks. Eur Food Res Tech. 233:267–274.
- Nääs IA, Garcia RG, Caldara FR. 2014. Infrared thermal image for assessing animal health and welfare. J Anim Behav Biometeorol. 2:66–72.
- Nadimi ES, Jørgensen RN, Blanes-Vidal V, Christensen S. 2011. Monitoring and classifying animal behavior using ZigBee-based mobile ad hoc wireless sensor networks and artificial neural networks. Comput Electron Agr. 82:44–54.
- Niazian M, Sadat-Noori SA, Abdipour M, Tohidfar M, Mortazavian SMM. 2018. Image processing and artificial neural network-based models to measure and predict physical properties of embryogenic callus and number of somatic embryos in Ajowan (Trachyspermum ammi (L.) Sprague). In Vitro Cell Dev Biol Plant. 54(1):54–68.
- Odabas MS, Leelaruban N, Simsek H, Padmanabhan G. 2014. Quantifying impact of droughts on barley yield in North Dakota, USA using multiple linear regression and artificial neural network. Neural Netw World. 24:343–355.
- Panigrahi S, Balasubramanian S, Gu H, Logue C, Marchello M. 2006. Design and development of a metal oxide based electronic nose for spoilage classification of beef. Sens Actuators B Chem. 119:2–14.
- Parimala K, Mathur R. 2006. Yield component analysis through multiple regression analysis in sesame. Int J Agric Sci. 2:338–340.
- Peterson CR, Gibson AR, Dorcas ME. 1993. Snake thermal ecology: the causes and consequences of body-temperature variation. In: Seigel RA, Collins JT, editors. Snakes: Ecology and Behavior. New York: Mc-Graw-Hill; p. 241–314.
- Prunier A, de Braganqa MM, Dividich JL. 1997. Influence of high ambient temperature on performance reproductive sows. Anim Prod Sci. 52:123–133.
- Qu G, Feddes JJR, Armstrong WW, Coleman RN, Leonard JJ. 2001. Measuring odor concentration with an electronic nose. Trans ASAE. 44(6):1807–1812.
- Quiniou N, Noblet J, van Milgen J, Dubois S. 2001. Modelling heat production and energy balance in group-housed growing pigs exposed to cold or hot ambient temperatures. Br J Nutr. 85:97–106.
- Renaudeau D, Anais C, Tel L, Gourdine JL. 2010. Effect of temperature on thermal acclimation in growing pigs estimated using a nonlinear function. J Anim Sci. 88:3715–3724.
- Renaudeau D, Gourdine JL, St-Pierre NR. 2011. A meta-analysis of the effect of high ambient temperature on growing–finishing pigs. J Anim Sci. 89:2220–2230.
- Rezende E, Bacigalupe LD. 2015. Thermoregulation in endotherms: physiological principles and ecological consequences. J Comp Physiol B. 185(7):709–727.
- Rome LC, Stevens ED, John-Alder HB. 1992. The influence of temperature and thermal acclimation on physiological function. In: Feder ME, Burggren WW, editors. Environmental Physiology of the Amphibians. Chicago: The University of Chicago Press; p. 183–205.
- Ross JW, Hale BJ, Gabler NK, Rhoads RP, Keating AF, Baumgard LH. 2015. Physiological consequences of heat stress in pigs. Anim Prod Sci. 55:1381–1390.
- Sabzalian MR, Khashei M, Ghaderian M. 2014. Artificial and hybrid fuzzy linear neural network-based estimation of seed oil content of safflower. J Am Oil Chem Soc. 91:2091–2099.
- Safa M, Nejat M, Nuthall PL, Greig BJ. 2016. Predicting CO2 emissions from farm inputs in wheat production using artificial neural networks and linear regression models–case study in Canterbury, New Zealand. J Agric Sci Tech. 7(9):268–274.
- Sagonas K, Meiri S, Valakos ED, Pafilis P. 2013. The effect of body size on the thermoregulation of lizards on hot, dry Mediterranean islands. J Therm Biol. 38:92–97.
- Samarasinghe S. 2016. Neural networks for applied sciences and engineering: from Fundamentals to complex pattern recognition. Boca Raton, Florida, United States: CRC Press.
- Schaefer AL, Cook NJ, Bench C, Chabot JB, Colyn J, Liu T, Okine EK, Stewart M, Webster JR. 2012. The non-invasive and automated detection of bovine respiratory disease onset in receiver calves using infrared thermography. Res Vet Sci. 93:928–935.
- Shin HW, Llobet E, Gardner JW, Hines EL, Dow CS. 2000. Classification of the strain and growth phase of cyanobacteria in potable water using an electronic nose system. IEE P-Sci Meas Tech. 147(4):158–164.
- Sinesio F, Di Natale C, Quaglia GB, Bucarelli FM, Moneta E, Macagnano A, Paolesse R, D’Amico A. 2000. Use of electronic nose and trained sensory panel in the evaluation of tomato quality. J Sci Food Agric. 80(1):63–71.
- Singh T, Kanchan R, Verma A, Singh S. 2003. An intelligent approach for prediction of triaxial properties using unconfined uniaxial strength. Min Eng J. 5:12–16.
- Siripatrawan U, Linz JE, Harte BR. 2004. Solid-phase microextraction, gas chromatography, and mass spectrometry coupled with discriminant factor analysis and multilayer perceptron neural network for detection of Escherichia coli. J Food Prot. 67:1597–1603.
- Siripatrawan U, Linz JE, Harte BR. 2006. Detection of Escherichia coli in packaged alfalfa sprouts with an electronic nose and an artificial neural network. J Food Prot. 69:1844–1850.
- Soerensen DD, Pedersen LJ. 2015. Infrared skin temperature measurements for monitoring health in pigs: a review. Acta Vet Scand. 57(5):1–11.
- Srivastava AK. 2003. Detection of volatile organic compounds (VOCs) using SnO2 gas-sensor array and artificial neural network. Sensor Actuat B-Chem. 96(1–2):24–37.
- Stewart M, Webster JR, Schaefer AL, Cook NJ, Scott SL. 2005. Infrared thermography as a non-invasive tool to study animal welfare. Anim Welf. 14:319–325.
- Stewart M, Webster JR, Stafford KJ, Schaefer AL, Verkerk GA. 2010. Technical note: effects of an epinephrine infusion on eye temperature and heart rate variability in bull calves. J Dairy Sci. 93:5252–5257.
- Sülia T, Halasa M, Benyedaa Z, Bodaa R, Belákb S, Avilésc MM, Carriónc EF, Vizcaíno JMS. 2017. Body temperature and motion: evaluation of an online monitoring system in pigs challenged with porcine reproductive & respiratory syndrome virus. Res Vet Sci. 114:482–488.
- Tufail M, Ormsbee L, Teegavarapu R. 2008. Artificial intelligence-based inductive models for prediction and classification of fecal coliform in surface waters. J Environ Eng. 134:789–799.
- Verstegen MWA, Close WH. 1994. The environment and the growing pigs. In: Cole DJA, Varley MA, Wiseman J, editors. Principles of pig science. Nottingham: Nottingham University Press; p. 333–353.
- Vianna DML, Carrive P. 2005. Changes in cutaneous and body temperature during and after conditioned fear to context in the rat. Eur J Neurosci. 21:2505–2512.
- Warriss PD, Pope SJ, Brown SN, Wilkins LJ, Knowles TG. 2006. Estimating the body temperature of groups of pigs by thermal imaging. Vet Rec. 158:331–334.
- White HM, Richert BT, Schinckel AP, Burgess JR, Donkin SS, Latour MA. 2008. Effects of temperature stress on growth performance and bacon quality in grow-finish pigs housed at two densities. J Anim Sci. 86:1789–1798.
- Wilson TE, Crandall CG. 2011. Effect of thermal stress on cardiac function. Exerc Sport Sci Rev. 39:12–17.
- Zeng W, Xu C, Wu J, Huang J. 2016. Sunflower seed yield estimation under the interaction of soil salinity and nitrogen application. Field Crops Res. 198:1–15.
- Zhang H, Balaban MO, Principe JC. 2003. Improving pattern recognition of electronic nose data with time-delay neural networks. Sensor Actuat B-Chem. 96(1–2):385–389.
- Zimmerman LC, O’Connor MP, Bulova SJ, Spotila JR, Kemp SJ, Salice CJ. 1994. Thermal ecology of desert tortoises in the eastern Mojave desert: seasonal patterns of operative and body temperatures, and microhabitat utilization. Herpetol Monogr. 8:45–59.