
 ?Mathematical formulae have been encoded as MathML and are displayed in this HTML version using MathJax in order to improve their display. Uncheck the box to turn MathJax off. This feature requires Javascript. Click on a formula to zoom.
ABSTRACT
Mathematical models provide valuable information for livestock improvement programmes. In this study, we evaluated the ability of five mathematical models (3P and 4P Gompertz, 3P and 4P logistic and neural network) to predict the growth of six tropically adapted dual purpose (TADP) chicken breeds (Fulani, FUNAAB Alpha, Kuroiler, Noiler, Sasso and Shika-Brown) under on-station and on-farm in Nigeria. Data for body weight were collected every 14 days from 1939 birds reared on-station, and every 28 days from 58,639 birds reared on-farm. Parameters used to evaluate the growth models were the adjusted coefficient of determination (AdjR2), Akaike’s information criterion (AIC), Bayesian information criterion (BIC) and root mean square error (RMSE). The AdjR2 for Gompertz 3P was higher than or equal to the AdjR2 for logistics 3P, Gompertz 4P and logistics 4P but was equal to or lower than the AdjR2 for the neural network (NN) for all TADP chickens raised on-station. Based on the goodness-of-fit criteria, Gompertz 3P had the best predictive values (AdjR2 = 0.989–0.998) for TADP chickens raised on-station, while logistic 3P was the best-fit model for TADP chickens raised on-farm. In conclusion, non-linear models and NN models yielded a good fit with the age-weight data of TADP chickens on-station and on-farm.
Introduction
Indigenous chickens contribute immensely to food security and livelihoods of smallholder farmers in the tropics. Despite being inferior to broilers in body weight, indigenous chickens are preferred for their survivability, disease resistance, meat quality and scavenging ability. Growth, defined as an increase in body size, is a defining parameter of biological systems (Lawrence and Fowler Citation2002). Body weight is one of the most significant traits in poultry production because it is associated with growth rate, feed conversion efficiency and occurrence of diseases in a flock (Amraei et al. Citation2017). Poultry growth patterns have been predicted using different mathematical models (Darmani et al. Citation2003; Sengul and Kiraz Citation2005; Roush and Branton Citation2006; Yaya et al. Citation2019). Several factors both non-genetic (health, age, welfare, location and feed) and genetic (breed or strain) have been implicated in the huge variations in growth curves fitted to the mathematical models (Darmani et al. Citation2010).
The application of mathematical models to fit data to the growth curve in chickens provides parameters that are used to predict body weight at a specific age and to detect the beginning of the reduction in growth rate (Yakupoglu and Atil Citation2001). Such analysis of the growth curve is highly desirable in developing countries to assist in the quest for maximization of genetic gains for improved performance in livestock production and attainment of animal protein sufficiency (Abbas et al. Citation2014).
Mathematical modelling is useful for optimizing growth rate, livestock performance, slaughter age, appropriate feeding and selection (Sariyel et al. Citation2017). A useful growth model should be parsimonious and contain parameters that have biological and physical meaning (France et al. Citation1996). The age–weight relationship has been described by many mathematical models such as logistic model (Grossman and Bohren Citation1985; Tsoularis and wallace Citation2002), Richard model (Knizetova et al. Citation1991) and Gompertz model (Barbato Citation1991; N'dri et al. Citation2006).
In many studies of Japanese quail growth data, Gompertz, logistic or von Bertalanffy growth models were used (Tzend and Becker Citation1981; Akbaş and Oğuz Citation1998; Alkan et al. Citation2009; Narinç et al. Citation2010; Narinç and Aygün Citation2010; Alkan et al. Citation2012). A common characteristic of these models is the fixed inflection point. The body weight at the inflection point is identified as 37% of the asymptotic weight in both the Gompertz and von Bertalanffy models and 50% in the logistic model. In fixed growth models, the genetic variations of asymptotic weight and point of inflection weight are equal, which constitute a problem for genetic improvement (Darmani et al. Citation2010).
Analyses of broiler growth data using the Gompertz growth models result in a single sigmoidal curve (Wang et al. Citation2004; Strathe et al. Citation2010). Santos et al. (Citation2005) used the Gompertz model to analyse growth in two slow-growing broiler lines housed in two different systems. Dourado et al. (Citation2009) used the Gompertz model to examine the growth of slow-growing broilers reared in the free-range system. Gompertz, logistic and Richard models were used by Norris et al. (Citation2007) to analyse the body weight of indigenous Venda and Naked Neck chickens of South Africa and growth curve parameters were estimated and compared.
Several studies, estimating the biological parameters of the growth curve for chickens, have been reported. Knizetova et al. (Citation1985) observed age at inflection point values of 63.7, 79.8 and 81.5 days for White Cornish, White Leghorn and New Hampshire cockerels, respectively. The logistic and Gompertz models have been extensively used in poultry production for on-the-spot assessment of body weight changes and nutritional challenges (Gous et al. Citation1999; Darmani et al. Citation2003; Sakomura et al. Citation2005) because of their robust nature in modelling growth curve patterns. Yapi et al. (Citation2011) observed that indigenous chickens took longer (51.22 days) to reach the point of inflection than the commercial genotypes (50.68 days for C-Nana and 46.91 days for C-nana). Ait and Moula (Citation2013) reported maturation growth rate (K) of 0.0260 and 0.0294 g d–1 for the chickens of Kabyle in Algeria, whose values were superior to the values of 0.0189 and 0.0205 g d–1 reported by Yapi et al. (Citation2011) for the indigenous chickens in Cote d’Ivoire.
Both Gompertz and logistic models belong to the Richards family of three-parameter sigmoid growth models (Tjørve and Tjørve Citation2017), which have been reported to be adequate in explaining weight growth in chickens (Zhao et al. Citation2015; Michalczuk et al. Citation2016).
The Neural network model learns the growth parameters of algorithms automatically from data without resorting to the underlying biological basis of the equation. Its ability to cope with high inputs of data, non-linearity and prediction accuracy of 98–99% is an indication that it can successfully replace the conventional methodologies (Sivanandam et al. Citation2008; Milosevic et al. Citation2019). Also, it belongs to the group of high-resolution models, and its flexibility makes it a generalized alternative to Gompertz and logistic equations (Thornley and France Citation2007; Ahmad Citation2009). Safari et al. (Citation2017) observed that neural network models are more efficient and reliable in describing the relationship among parameters than non-linear regression models.
In meat type chickens, an appropriate body weight is required for optimal production at the end of rearing. Mathematical models have been used to fit growth models, where biologically relevant parameters could be related to performance, such as asymptotic weight (Teleken et al. Citation2017). These models have three or four parameters and at least one parameter of the model has a biological meaning (Iqbal et al. Citation2019). Selvaggi et al. (Citation2015) reported that Gompertz 3P model fitted live weight data more appropriately for male and female birds than the 4P models in non-descript Italian chicken breeds. However, most studies have only explored 3P models with a single asymptote in fitting the growth curves of indigenous and exotic chickens. These models are prone to overestimation of predicted data, thereby leading to erroneous inferences in estimating genetic gain in breed improvement programmes. However, the use of 4P versions of logistic (Liao and Liu Citation2009) and Gompertz (Wellock et al. Citation2004; Porter et al. Citation2010) models might minimize overfitting of the curves.
Studies comparing mathematical models for chicken growth, using 3P logistic and Gompertz models, have been widely reported in the literature (Thornley and France Citation2007; Zhao et al. Citation2015; Michalczuk et al. Citation2016). However, studies, comparing the predictive ability of 3P Logistic and Gompertz models and their 4P versions with neural network model in TADP chickens, under both on-station and on-farm conditions, have not been reported. This is the purpose of this report.
The aim of this study was to assess the predictive ability of different mathematical models (3P and 4P Gompertz, 3P and 4P logistic and neural network) for forecasting the growth of TADP chickens at 0–20 weeks under on-station and on-farm conditions in Nigeria. We hypothesize that models that are parsimonious under on-station conditions will also be under on-farm conditions. In addition, we expected to observe sexual dimorphism in TADP chickens for sigmoid growth patterns.
Materials and methods
Experimental site
The on-station test was conducted at Fol-Hope Farms, Ibadan, Oyo State and the Federal University of Agriculture, Abeokuta (FUNAAB), located within the Southern Guinea Savanna, and Dry Lowland Rainforest agro-ecological zones, respectively. The testing of the birds commenced in May 2016. The on-farm test was carried out in five agro-ecological zones as follows: Kebbi State (Sudan and Northern Guinea Savanna), Kwara State (Southern Guinea Savanna), Nasarawa State (Southern Guinea Savanna), Imo State (Wet Lowland Rain Forest and Fresh Water Swamp) and Rivers State (Mangrove Swamp and Fresh Water Swamp).
Management systems
A total of 1939 d-old chicks of both locally sourced breeds (Fulani, FUNAAB Alpha, Noiler and Shika-Brown) and imported breeds (Kuroiler and Sasso) were brooded to 42 days (). The birds were sexed at 42 days, and males and females were grown separately until 140 days under station (intensive production system) conditions. The stocking density was 10 chicks/m2, seven birds/m2, and five birds/m2 during 0–42d, 43–91d and 92–140d, respectively. Commercial feed (Chick mash at 0–42d: 2,993 kcal ME/kg, 22.3% CP and Grower mash at 43–140d: 3013 kcal ME/kg, 17% CP) and water were available ad libitum. Birds in both stations were fed the same proprietary feed. Standard biosecurity measures and vaccination schedules were observed at the test centres. Body weight was measured every two weeks. For the on-farm test, a total of 58,639 six-weeks-old pre-vaccinated chickens were distributed to 2100 households across five states representing different agro-ecologies (). Standard backyard scavenging management practices were followed by the farmers with the addition of overnight housing, feed supplementation and vaccination programmes. Body weight was taken every four weeks.
All applicable veterinary permits were obtained for the importation and use of the imported breeds for research purposes (Bamidele et al. Citation2019). Both the on-station and on-farm studies were approved by the International Livestock Research Institute (ILRI) Institutional Research Ethics Committee (IREC) with reference no.: ILRI-IREC2015-08/1, and ILRI Institutional Animal Care and Use Committee (IACUC) with reference number: ILRI-IACUC-RC2016.2. Each farmer gave written informed consent to participate in the study.
Statistical procedures
Repeated measures of individual body weight at different ages of males and females’ TADP chickens were fitted to 3P and 4P models, respectively. The 3P models sought to fit a response that is between zero and the estimated asymptote. The 4P models sought to fix a response between zero and two estimated asymptotes. The models used in fitting the growth curves are presented in .
Table 1. Equations of the non-linear regression growth curve models.
Table 2. Allocation of strains of chickens tested on-station in Nigeria.
Table 3. On-farm experimental allocation of households in Nigeria.
Neural network computations
The whole datasets for body weight and age were separated at random into two subsets (training and testing) using a supervised neural network. The training set consisted of 75% and testing subset consisted of 25%. The training sets were used to train the neural network models, and the testing sets were used to validate the models. The networks were tested with 100 hidden layers with 320 neurons in each hidden layer to optimize the body weights. Initial weights and bias matrix were randomly initialized between −1 and –1. We used a non-linear transformation (or activation) models tangent sigmoid as shown below
to compute the output from the summation of weighted inputs
of neurons in each hidden layer, where
is a constant. A pure linear transformation model was used as an output layer for getting network responses (Sivanandam et al. Citation2008).
We implemented both the specialized modelling technique (SMT) and the predictive modelling technique (PMT). The SMT adopts the fit curve procedures which contain varieties of inbuilt, non-linear models using ordinary least squares methods, while the PMT was used to train, test and validate the neural network for estimating or forecasting age–weight relationship.
Breed and sex effects were estimated using the general linear model to compute the summary statistics (Means ± SD). Significant differences in means were separated using Tukey test. The growth models (3P and 4P Gompertz; 3P and 4P logistic) were fitted to the measurements of actual body weight related to age via a non-linear procedure, using the Marquardt algorithm of J.M.P 13.2 statistical software. On the other hand, the two-layer fully connected multilayer perceptron algorithm procedures were used to model the neural network using default random holdback methods which was set at 0.3333 with hidden nodes of 1000. The models’ performances were compared based on the AdjR2, RMSE, AIC and BIC. RMSE and AdjR2 of the models were considered as the calculated goodness-of-fit parameters for comparing the different models across breeds of TADP chickens. We obtained AIC using , where
is the number of observations,
is the sum of the square of errors, and
is the number of parameters. We derived BIC using
. Estimated mean parameters obtained from different models were used to plot the general growth curves of the TADP chickens.
Results and discussion
Results on growth performance of the TADP chickens raised on-station, and on-farm have previously been reported by Bamidele et al. (Citation2019), and Ajayi et al. (Citation2020), respectively. Estimated growth curve parameters of male and female birds raised on-station are presented in and , respectively. Different growth models of the six TADP chickens used in this study showed variations in estimated asymptotic weight. The TADP chickens had higher upper asymptotic weight, except for logistic 3P (1332.09 g) and 4P (1408.14 g) in Fulani which was lower, than the Lohmann average of 1500 g of body weight for laying hens. The weight at the inflection point was lower than the upper asymptotic weight for all the TADP chickens. The earlier occurrence of the maturity rate in Gompertz than in logistic models implies that the Gompertz model is more sensitive to growth response. The asymptotic weight represents the maximum growth response for animals which are mostly affected by genotype and environment interactions (Narinç et al. Citation2010). The weight at the inflection point was above 1000 g for all TADP chickens except for Fulani and Shika-Brown. Noiler had the lowest scale parameters (5.22 weeks, Gompertz 4P and 9.54 weeks, logistic 3P) followed by Kuroiler (8.83 weeks, Gompertz 3P and 10.14 weeks, logistic 3P), Sasso (9.76 weeks, Gompertz 3P and 10.92 weeks, logistic 3P), FUNAAB Alpha (8.85 weeks, Gompertz 3P and 10.21 weeks, logistic 3P), Fulani (11.45 weeks, Gompertz 4P and 12.22 weeks, logistic 4P) and Shika-Brown (9.59 weeks, Gompertz 3P and 10.85 weeks, logistic 3P). The age at the inflection point at 10 weeks (70 days) in Sasso chicken as observed in was lower than the previously reported 74.2–79.8 days in SASSO T44 populations but higher than the 63.7 days in White Cornish population, as reported by Knizetova et al. (Citation1985). The difference between Noiler and the other breeds in the inflection points (age and weight) could be due to the fact that Noiler birds came into the experiment at 42 d of age when compared to the other breeds that were monitored from day old.
Table 4. Estimated growth curve parameters of male birds raised on-station from 0 to 20 weeks.
Table 5. Estimated growth curve parameters of female birds raised on-station from 0 to 20 weeks.
For data collected on female birds raised on-station (), all the computational models (3P and 4P logistic models, 3P and 4P Gompertz and Neural network) fitted the data satisfactorily. It is known that the model with the highest AdjR2 and the lowest AIC value better explains the change in body weight (Keskin and Dag Citation2006; Sahin et al. Citation2014). Neural network had the best accuracy of reconstructing the body weight across the TADP chickens with the highest AdjR2 (0.992–0.998) and the lowest RMSE (5.993–49.327). The AdjR2 values obtained in this study for all the models are greater than 0.98 and higher than the values reported by Cetin et al. (Citation2007) and Yakubu and Madaki (Citation2017) for linear, quadratic, Gompertz and neural network. The age at the inflection point of 13 weeks in Noiler was higher than the 10 weeks for Fulani, Sasso, Shika-Brown, FUNAAB Alpha and Kuroiler estimated in female birds raised on-station from 0 to –20 weeks by the prediction profiler ().
For the data collected from male birds raised on-farm from 6 to 18 weeks (), the 4P models (logistic 4P and Gompertz 4P) had poor iterations and failed to converge in modelling the growth curves due to optimization problem which made the parameters not estimable. Our results show huge disagreement between the observed and predicted male data for 4P models. The logistic 3P had the highest AdjR2 in Fulani, Kuroiler, Noiler and Sasso. This implies that logistic 3P fitted the liveweight data more accurately.
Table 6. Estimated growth curve parameters of male birds raised on-farm from 6 to 18 weeks.
The age at inflection point at 12 weeks (84 days of age) of male birds raised on-farm from 6 to 18 weeks in this study was higher than the results obtained in local genotypes of slow-growing broilers (44.00 and 49.62 days of age) using the Gompertz model (N'dri et al. Citation2006; Dourado et al. Citation2009). The age at the inflection point in the present study was similar to those reported by Yapi et al. (Citation2011) for indigenous local ecotypes (savannah and forest) and that of slow-growing broilers obtained by Narinç et al. (Citation2010) in Hubbard. Logistic 3P had the best maturity index in TADP chickens.
Estimated growth curve parameters of female birds raised on-farm from 6 to 18 weeks are presented in . Logistic 3P had higher scale parameters for Fulani (7.18 weeks), FUNAAB Alpha (14.59 weeks), Kuroiler (11.02 weeks), Noiler (8.43 weeks) and Shika-Brown (9.89 weeks) which are similar to estimates reported by Yang et al. (Citation2006) in Jinghai (Chinese) yellow chickens.
Table 7. Estimated growth curve parameters of female birds raised on-farm from 6 to 18 weeks.
The maturity index of 0.03–0.12 for female birds raised on-farm from 6 to 18 weeks in this study was close to the 0.137 reported for an Italian nondescript chicken breed from 2 to –24 weeks of age (Darmani et al. Citation2010) but higher than the values reported by Ait and Moula (Citation2013) for chickens of Kabyle in Algeria (0.0260 and 0.0294 g d−1), and by Yapi et al. (Citation2011) for indigenous local chickens in Cote d’Ivoire (0.0189 vs. 0.0205 g d−1).
Estimated growth curve parameters by breed in TADP chickens raised on-station and on-farm are presented in and . We advocated for the increase in power of prediction by pooling the male and female record to increase the sample size despite the fact that sexual dimorphism was observed in this study. The highest adjusted coefficient of determination (0.999) was recorded in ANN model in Shika-Brown in the pooled data which was higher than when the sex was considered singularly. The utilization of the ANN statistical methodology may provide livestock managers another tool in the evaluation of data to assist in the development of appropriate TADP chicken management plans for genetic improvement strategies. Fulani had the least AIC value across the models (90.35–102.56), followed by Noiler (105.46–122.44) and Shika-Brown (108.83–111.54). Gompertz 3P had the best goodness of fit in Sasso, Kuroiler, Shika-Brown and Noiler, respectively. Gompertz model had a lower maturity index in all the breeds than logistic models. Kuroiler had the heaviest upper asymptotic weight (3115.45–3897.82 g) which was higher than the 675.3–886 gm for the Kabyle traditional chickens reported by Ait and Moula (Citation2013), and the 1501.2–2219.5 gm for the local chicken in Cote d’Ivoire, as obtained by Yapi et al. (Citation2011). The differences could be attributed to the fact that Kuroiler is an improved Indian local chicken, while the Kabyle and Ivorian local chickens are unimproved. In this study, the improved TADP chickens had an earlier scale parameter than the unimproved Fulani chickens. This is in agreement with the report of Mignon and Beaumont (Citation2000) that animals selected for heavier body weight arrive at the age at the inflection point and scale parameters earlier.
Figure 1. Growth curve parameters of the TADP breeds.
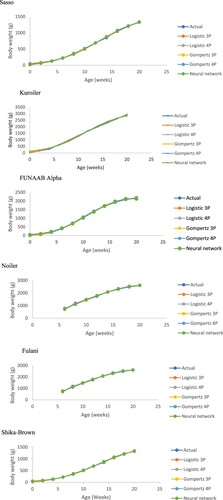
Table 8. Estimated growth curve parameters by breed of TADP chickens raised on-station and on-farm.
Conclusion
From the results above, it can be concluded that non-linear models and neural network model yielded good fit with the age-weight data of TADP chickens on-station and on-farm. However, these results validate the fact that neural network models can compete with non-linear models for modelling of the body weight data at different ages and thereby expanding the statistical tool kit available to analyse data and make predictions in TADP chickens. The stability of biological parameters of non-linear offers an advantage for effective planning of feed resources for optimal utilization and breeding improvement strategy in TADP chickens.
Acknowledgements
The authors are grateful to Dr. Tadelle Dessie (ACGG Program Leader) and ILRI, for their support in conducting the ACGG research project in Nigeria.
Disclosure statement
No potential conflict of interest was reported by the author(s).
Additional information
Funding
References
- Abbas AA, Yosif AA, Shukur AM, Ali FH. 2014. Effect of genotypes, storage periods and feed additives in broiler breeder diets on embryonic and hatching indicators and chicks blood parameters. Sci Agric. 7:44–48.
- Ahmad HA. 2009. Poultry growth modeling using neural networks and simulated data. J Appl Poult Res. 18:440–446. doi:10.3382/japr.2008-00064
- Ait KA, Moula N. 2013. Performances de productions de la poule locale kabyle. Revue Agric. 5:1–4.
- Ajayi FO, Bamidele O, Hassan WA, Ogundu UE, Yakubu A, Alabi OO, Akinsola OM, Sonaiya EB, Adebambo OA. 2020. Production Performance and survivability of six dual purpose genotypes of chicken under smallholder farmers’ management practices in Nigeria. Arch Anim Breed. 63:387–408. doi:10.5194/aab-63-387-2020
- Akbaş Y, Oğuz I. 1998. Growth curve parameters of lines of Japanese quail (Coturnix coturnix japonica), unselected and selected for four-week body weight. Arch Geflugelkunde. 62(3):104–109.
- Alkan S, Mendes M, Karabag K, Balcioglu MS. 2009. Effects of short term divergent selection for 5-week body weight on growth characteristics in Japanese quail. Arch Für Gef. 73:124–131.
- Alkan S, Narinç D, Karsli T, Karabağ K, Balcioğlu MS. 2012. Effects of thermal manipulations during early and late embryogenesis on growth characteristics in Japanese quails (Coturnix coturnix japonica). Arch Für Gef. 76:184–190.
- Amraei S, Mehdizadeh SA, Salari S. 2017. Broiler weight estimation based on machine vision and artificial neural network. Br Poul Sci. 58(2):200–205. doi:10.1080/00071668.2016.1259530
- Bamidele O, Sonaiya EB, Adebambo OA, Dessie T. 2019. On-station performance evaluation of improved tropically adapted chicken breeds for smallholder poultry production systems in Nigeria. Trop Anim Health Prod. doi:10.1007/s11250019021589.
- Barbato GF. 1991. Genetic architecture of growth curve parameters in chickens. Theor Appl Gen. 83:24–32. doi:10.1007/BF00229222
- Cetin MT, Sengul B, Sogut S, Yurtseven S. 2007. Comparison of growth models of male and female partridges. J Biol Sci. 7:964–968. doi:10.3923/jbs.2007.964.968
- Darmani KH, Kebreab E, López S, France J. 2003. A comparative evaluation of functions for the analysis of growth in male broilers. J Agr Sci. 140:451–459. doi:10.1017/S0021859603003149.
- Darmani KH, Porter T, Lopez S, Kebreab E, Strathe AB, Dumas A, Dijkstra J, France J. 2010. A review of mathematical functions for the analysis of growth in poultry. World Poul Sci J. 66:227–239. doi:10.1017/S0043933910000280
- Dourado LRB, Sakomura NK, Nascimento DCN, Dorigam JC, Marcato SM, Fernandes JBK. 2009. Growth and performance of naked neck broiler reared in free-range system. Ciência e Agrotecnologia. 33:875–881. doi:10.1590/S1413-70542009000300030
- France J, Dijkstra J, Dhanoa MS. 1996. Growth functions and their application in animal science. Annde Zoo. 45:165–174. doi:10.1051/animres:19960637
- Gompertz B. 1832. On the nature of the function expressive of the law of human mortality, and on a new mode of determining the value of life contingencies. Phil Trans Roy Soc London. 123:513–585.
- Gous RM, MoranJr.ET, Stilborn HR, Bradford GD, Emmans GC. 1999. Evaluation of the parameters needed to describe the overall growth, the chemical growth, and the growth of feathers and breast muscles of broilers. Poult Sci. 78:812–821. doi:10.1093/ps/78.6.812
- Grossman M, Bohren BB. 1985. Comparison of proposed growth curve functions in chickens. Gro. 46:259–274.
- Iqbal F, Waheed A, Huma Z, Faraz A. 2019. Nonlinear growth functions for body weight of thalli sheep using Bayesian inference. Pak J Zool. 51:1421–1428.
- Keskin I, Dag B. 2006. Comparison of the linear and quadratic models for describing the growth of live weight and body measurements in Anatolian merino male lambs in fattening period: estimation of growth curve parameters in Konya merino sheep. J Anim Vet Adv. 5:19–23.
- Knizetova H, Hyanek J, Hyankova L, Belicek P. 1985. Comparative study of growth curves in poultry. Gen Sel Evolut. 27:365–375. doi:10.1186/1297-9686-27-4-365
- Knizetova H, Hyanek J, Knize B, Roubicek J. 1991. Analysis of growth curves in fowl. I. Chickens. Br Poult Sci. 32:1027–1038. doi:10.1080/00071669108417427
- Lawrence TLJ, Fowler VR. 2002. Growth of farm animals. 2nd ed. Wallingford: CAB International, 347.
- Liao J, Liu R. 2009. Re-parameterization of five-parameter logistic function. J Chemo. 23:248–253. doi:10.1002/cem.1218
- Michalczuk M, Damaziak K, Goryl A. 2016. Sigmoid models for the growth curves in medium-growing meat type chickens, raised under semi-confined conditions. Ann Anim Sci. 16(1):65–77. doi:10.1515/aoas-2015-0061.
- Mignon GS, Beaumont C. 2000. Les courbes de croissance chez les oiseaux. Inra Prod Anim. 13(5):337–348. doi:10.20870/productions-animales.2000.13.5.3802
- Milosevic B, Ciric S, Lalic N, Milanovic V, Savic Z, Omerovic I, Doskovic V, Djordjevic S, Andjusic L. 2019. Machine learning application in growth and health prediction of broiler chickens. W Poul Sci J. 75:401–410. doi:10.1017/S0043933919000254
- Narinç D, Aksoy T, Karaman E. 2010. Genetic parameters of growth curve parameters and weekly body weights in Japanese quail. J Anim Vet. Adv. 9:501–507. doi:10.3923/javaa.2010.501.507
- Narinç D, Aygün A. 2010. Growth curve analyses in poultry science. W Poult Sci. 73:395–408. doi:10.1017/S0043933916001082
- N'dri AL, Mignon GS, Sellier S, Tixier-Boichard M, Beaumont C. 2006. Genetic relationships between feed conversion ratio, growth curve and body composition in slow growing chickens. Br Poult Sci. 47:273–280. doi:10.1080/00071660600753664
- Norris D, Ngambi JW, Benyi K, Makgahlela ML, Shimelis HA, Nesamvuni EA. 2007. Analysis of growth curves of indigenous male Venda and Naked Neck chickens. S Afr J Anim Sci. 37:21–26.
- Porter T, Kebreab E, Darmani KH, Lopez S, Strathe AB, France J. 2010. Flexible alternatives to the Gompertz equation for describing growth with age in Turkey hens. Poult Sci. 89:371–378. doi:10.3382/ps.2009-00141
- Ratkowsky D. A., Reedy T. J.. 1986. Choosing near-linear parameters in the four-parameter logistic model for radioligand and related assays. Bio. 42:575–582.
- Roush WB, Branton SL. 2006. Comparison of Gompertz and neural network models of broiler growth. Poult Sci. 85:794–797. doi:10.1093/ps/85.4.794
- Safari AA, Faghih MF, Zare M, Seidavi A, Laudadio V, Selvaggi M, Tufarelli V. 2017. Artificial neural network and non-linear logistic regression models to fit the egg production curve in commercial-type broiler breeders. Eur Poult Sci. 81. DOI: 10.1399/eps.2017.212.
- Sahin A, Ulutas Z, Karadavut U, Yildirim A, Arslan S. 2014. Anadolu mandasi malaklarinda buyume egrisinin cesitli dogrusal olmayan modeller kullanilarak karsilastirilmasi. Kafkas Univ Vet Fak Derg. 20:357–362. (In Turkish, with English abstract).
- Sakomura NK, Longo FA, Oviedo-Rondon EO, Boa-Viagem C, Ferraudo A. 2005. Modelling energy utilization and growth parameter description for broiler chickens. Poult Sci. 84:1363–1369. doi:10.1093/ps/84.9.1363
- Santos AL, Sakomura NK, Freitas ER, Fortes CMS, Carrilho ENVM. 2005. Comparison of free range broiler chicken strains raised in confined or semi-confined systems. Rev Bras de Ciên Aví. 7:85–92. doi:10.1590/S1516-635X2005000200004
- Sariyel V, Aygun A, Keskin I. 2017. Comparison of growth curve models in partridge. Poult Sci. 96(6):1635–1640. doi:10.3382/ps/pew472
- Selvaggi M, Laudadio V, Dario C, Tufarelli V. 2015. Modelling growth curves in a nondescript Italian chicken breed: An opportunity to improve genetic and feeding strategies. J Poult Sci. 52:288–294. doi:10.2141/jpsa.0150048
- Sengul T, Kiraz S. 2005. Non-linear models for growth curves in large white turkeys. Turk J Vet Anim Sci. 29:331–337.
- Sivanandam SN, Sumathi S, Deepa SN. 2008. Introduction to neural networks using matlab 6.0. Tata McGraw Hill, 1st ed.
- Strathe AB, Danfær A, Sørensen H, Kebreab E. 2010. A multilevel nonlinear mixed-effects approach to model growth in pigs. J Anim Sci. 88:638–649. doi:10.2527/jas.2009-1822
- Teleken JT, Galvão AC, daS R, Teleken JT, Galvão AC, daS R. 2017. Comparing non-linear mathematical models to describe growth of different animals. Acta Sci Anim Sci. 39:73–81. doi:10.4025/actascianimsci.v39i1.31366
- Thornley JHM, France J. 2007. Mathematical models in agriculture: quantitative methods for the plant, animal and ecological sciences, 2nd ed. Wallingford: CAB International.
- Tjørve KMC, Tjørve E. 2017. The use of Gompertz models in growth analyses, and new Gompertz-model approach: an addition to the unified-Richards family. PLoS ONE. 12(6):e0178691. doi:10.1371/journal.pone.0178691
- Tsoularis A, Wallace J. 2002. Analysis of logistic growth models. Math Biol. 179:21–55. doi:10.1016/S0025-5564(02)00096-2
- Tzend RY, Becker WA. 1981. Growth patterns of body and abdominal fat weight in male broiler chickens. Poult Sci. 60:1101–1106. doi:10.3382/ps.0601101
- Wang DQ, Lu LZ, Ye WC, Shen JD, Tao ZR, Tao ZL, Ma FL, Chen YC, Zhao AZ, Xu J. 2004. Study on the growth regularity of jinyun muscovy duck. Zhe J Anim Sci Vet Med. 6:3–5.
- Wellock I, Emmans G, Kyriazakis I. 2004. Describing and predicting potential growth in the pig. Anim Sci. 78:379–388. doi:10.1017/S1357729800058781
- Yakubu A, Madaki J. 2017. Modelling growth of dual-purpose Sasso hens in the tropics using different algorithms. J Genet Mol Biol. 1(1):1–9. doi:10.35841/genetics-molecular-biology.1.1.1-9
- Yakupoglu C, Atil H. 2001. Comparison of growth curve models on broilers growth curve I: parameters estimation. Onl J Biol Sci. 1:680–681. doi:10.3923/jbs.2001.680.681
- Yang Y, Mekki DM, Lv SJ, Wang LY, Yu JH, Wang JY. 2006. Analysis of fitting growth models in Jinghai mixed-sex yellow chicken. Int J Poult Sci. 5:517–521. doi:10.3923/ijps.2006.517.521
- Yapi VC, Loukou EN, Konan NYBJ-C, Toure G, Kreman K, Youssao I, Kayang B, Rognon X, TixierBoichard M. 2011. Poids vif et paramètres de la courbe de croissance des poulets de race locale (Gallus domesticus) en côte d’Ivoire. Agro Afri. 23(3):273–281.
- Yaya W, Ke L, Honghua L, Haiyue C, Haiguang M, Xinyang D, Zhaozheng Y. 2019. Comparison of nine growth curve models to describe growth of partridges (Alectoris chukar). J Appl Anim Res. 47(1):195–200. doi:10.1080/09712119.2019.1599900
- Zhao Z, Li S, Huang H, Li C, Wang Q, Xue L. 2015. Comparative study on growth and developmental model of indigenous chicken breeds in China. Open J Anim Sci. 5(2):219–223. doi:10.4236/ojas.2015.52024