
 ?Mathematical formulae have been encoded as MathML and are displayed in this HTML version using MathJax in order to improve their display. Uncheck the box to turn MathJax off. This feature requires Javascript. Click on a formula to zoom.
ABSTRACT
This study aimed to evaluate the predictive ability of NIRS for the estimation of the chemical composition and organic matter digestibility (OMD) of total mixed rations (TMR) for dairy cows. Moreover, herein, empirical equations based on chemical parameters were developed for calculating the OMD. Samples were collected from Galician dairy farms and were scanned in duplicate a Foss NIRSystem 6500 monochromator (1100-2500 nm). The predictive ability of NIRS models was evaluated according to the coefficient of determination in external validation (2). High
2 (equal to or higher than 0.90) was shown in predicting chemical composition, however, the estimation of OMD was acceptable (
2 = 0.83). The ability of the NIRS models for estimating the chemical composition was considered excellent, with the ratio performance deviation of external validation (
) higher than 3.0, allowing for quantitative predictions. The estimation of the OMD value by NIRS was considered acceptable (
= 2.5), and led to reduction in the standard error of external validation, in comparison of the best empirical model based on the chemical composition of samples (from ± 2.06% to ± 1.89%). Therefore, this study demonstrated that the NIRS is an effective technology for the rapid and precise nutritional evaluation of TMR in Galicia.
1. Introduction
The dairy cattle sector in Galicia is strategic for its direct and indirect economic value generation and its contribution to employment in rural areas as well as for territorial planning. In Galicia, cow milk production totals 7.3 Mt, accounting for 39% of the cow milk produced in Spain. This autonomous community is the largest cow-milk-producing region in Spain and ranks among the top 10 milk-producing regions in the European Union (Eurostat Citation2019).
Profitable and environment-friendly milk production through economical and balanced diets requires accurate estimation of the composition of the ration consumed by livestock. To this end, an advanced nutritional assessment system is necessary for reliable and accurate nutritional evaluation of the complete rations of dairy cows.
The energy value of ruminant feeds is estimated in animals (in vivo studies). Usually, in vivo digestibility is evaluated in sheep as a complex, long, and expensive technique, used only for collecting reference samples or for research purposes. Indirect methods are needed to estimate the energy value as in vivo analytical techniques cannot be routinely used because of cost, time, and labour constraints (Gosselink et al. Citation2004). Alternative methods for assigning the energy value of food include the use of regression equations based on chemical parameters, in vitro digestion techniques, and near infrared reflectance spectroscopy (NIRS).
Empirical equations derived from statistical associations between digestibility and specific chemical fractions of samples have been used for decades and are still used at the present. The methods used to predict organic matter digestibility (OMD) consist of defining the mathematical relationships between in vivo values and results from parameters determined in the laboratory. The equations are derived from regressions established between in vivo OMD and the concentration of a specific chemical fraction. The feed fractions with the strongest effect on digestibility are cell wall components because the cellular content of forages and livestock feed is almost entirely digestible for ruminants (Goering and Van Soest Citation1970). As an alternative to in vivo procedures, one of the most useful in vitro methods for estimating feed OMD is based on the use of ruminal fluid and pepsin (Tilley and Terry Citation1963). Numerous studies indicate that determining in vitro digestibility using the Tilley-Terry method corrected by known in vivo digestibility standards provides reliable estimates and is the reference for designing alternative estimation methods (Nousiainen Citation2004; Huhtanen et al. Citation2009; Gierus et al. Citation2016). NIRS is widely regarded as a viable tool for reliably, quickly, and inexpensively determining the nutritional value of ruminant feed (Bastianelli et al. Citation2018). Numerous references to NIRS prediction models for estimating the value of digestibility and chemical composition of different types of ruminant feed and forage are available in the literature (Bastianelli et al. Citation2018).
This study aimed to evaluate the ability of NIRS to estimate the chemical composition and OMD of total dairy cow rations and attempted to develop empirical equations based on chemical parameters for estimating OMD, by comparing their predictive capacity with that of NIRS models.
2. Material and methods
2.1. Sample collection and preparation
A total of 121 samples of TMR received in the Galician Interprofessional Laboratory of Milk Analysis (Laboratorio Interprofesional Galego de Análise do Leite–LIGAL) from dairy cattle farms in Galicia from 2005 to 2015 for analysis. In addition, experimental diets were formulated to provide four different forage:concentrate ratios (100:0, 80:20, 60:40, 40:60), representing the expected variability in samples from dairy farms. As a result, the whole set were constituted by 125 samples.
The samples were prepared by drying in a hot air oven (Unitherm, Russell-Lindsey Engineering, Birmingham, England) at 80 °C for 16 hours and were subsequently ground to 1 mm in a hammer mill (Christy and Norris Ltd., Chelmsford, England).
2.2. Laboratory analysis of the chemical composition of samples
The organic matter (OM) content was assessed by muffle furnace combustion at 550 °C to constant weight. Nitrogen content was analyzed by Kjeldhal and a colorimetric determination in an autoanalyzer Bran + Luebbe. Factor of conversion to CP was 6.25 (method no. G-188-97 Rev 2, Bran + Luebbe, Analyser Division, Norderstedt, Germany). Neutral detergent fibre (NDF) was determined according to the procedure proposed by Van Soest et al. (Citation1991), and acid detergent fibre (ADF) was determined according to Goering and Van Soest (Citation1970). These procedures are adapted to the hot extractor Fibertec 1020 System (Foss Tecator AB, Sweden). Crude fibre (CF) was determined according to Official Method no. 7 (BOE, Citation1995). The starch (STA) content was determined by polarimetry according to Official Method no. 34 (BOE, Citation1995). Ether extract (EE) was determined according to the Official Method of the Association of Official Analytical Chemists (AOAC) (Citation2003). Hemicellulose (HCEL) content was calculated as the difference between NDF and ADF.
2.3. Digestibility determinations of samples
The OMD values were only available for 71 samples of whole collection. The OMD was determined using the procedure described by Tilley and Terry (Citation1963) and modified by Alexander and McGowan (Citation1966), using two rumen cannulated donor cows. The samples were incubated by duplicate and the analysis was repeated when the difference between replicates exceeded 5% of the mean. To control the variability between different runs, in each in vitro series, the four experimental diets formulated, were included as reference samples, which have known in vivo OMD. The in vitro digestibility values were corrected using these set of four reference samples. Subsequently, the values of in vitro digestibility of each sample were expressed as in vivo digestibility through a one-step regression equation.
The in vivo digestibility determination of four reference samples was performed with five Galician wethers over two years of age, housed in metabolic cages equipped with faeces and urine separators. The animals were fed vitamin-mineral blocks at maintenance level and received the diets as the only feed. The diets were formulated following four different forage:concentrate ratios (100:0, 80:20, 60:40, 40:60). The feed was offered daily in an unique ration in the morning. The pre-experimental period of adaptation to the study feed was 7 days, followed by an adaptation period to the metabolic cages and adjustment to voluntary ingestion of another 7 days, during which the feed offered and refused by the animals were weighed daily, followed by 11 continuous days of voluntary ingestion and faecal production control. The feed offered, feed refused and faeces for each animal were weighed and sampled daily. The sampling was performed only once a day, by taking an aliquot of 10% of the feed offered and refused, and 20% of the feaces produced per animal. The samples taken daily were frozen at −20 °C until their analysis.
Based on the results from the in vivo evaluation, the value of in vivo apparent digestibility was calculated for each animal using the following equation:
, where
is the coefficient of apparent digestibility (%) of constituent
(OM),
and
are the amounts of the constituent ingested and excreted by the animal during the 11 control days of the evaluation, respectively.
2.4. Statistical analysis used to develop regression equations based on chemical composition
The relationships between OMD values and chemical parameters were examined by simple and multiple linear regression and correlation analysis, accompanied by a step-by-step regression process, selecting the best univariate and multivariate models in terms of explained percentage of variance of the dependent variable, using the procedures CORR, STEPWISE, GLM, and REG of the statistical package SAS v. 9.4 (SAS Institute, Citation2012). Prior to the development of models based on chemical parameters for calculating the OMD values, the collected samples were sorted by their OMD value. Then each fifth sample was assigned to the independent validation set, which were reserved for externally test the predictive models later. The predictive models were built on the remaining four-fifths. A sequential cross-validation process (Leave one out strategy; Massart et al. Citation1997) was used to build the predictive models whereby one of the samples was sequentially excluded from the calibration set on which the prediction validation was performed. This process was repeated a number of times equal to the total number of samples, and then the standard error of cross-validation () was computed from the estimation errors (
i = difference between the observed value and that predicted by the model) of the samples of the validation set as
,
being the total number of samples of the collection. Models with a percentage of explained variance in cross-validation lower than 20% were excluded. Additionally, those that included variables with a high degree of collinearity as predictors were also excluded, by considering their negative effect on the stability of the coefficients from the regression models, which were estimated using diagnostic tools with the SAS REG procedure. The calibration models of OMD were subjected to external validation, which carries out predictions on the independent validation set previously reserved. The value of the standard error of external validation (
) was calculated as the standard error of the difference between observed and predicted values, that is,
and the
value, as the mean value of difference between the observed and predicted values (
), assessing the coefficient of determination in external validation (
2) by linear regression between the observed values and the values predicted by equation.
2.5. NIRS data acquisition
The spectral information of the TMR samples was recorded from samples dried and ground to pass a 1 mm sieve, on a Foss NIRSystem 6500 on-line NIR spectrophotometer (Foss NIRSystem, Silver Spring, Washington, USA) equipped with a spinning module and located in a temperature-controlled room (24 ± 1 °C).
Spectral data were obtained by reflectance, from 1100 to 2500 nm (every 2 nm), using a standard ring cup window 3.75 cm diameter (FOSS IH-0307). Samples were scanned in duplicates, recording the absorbance data as , where R is the reflectance. Spectral data collection and chemometric treatment of data were performed using WinISI II software package version 1.50 (Infrasoft International, Port Matilda, PA, USA, 2000). All samples were allowed to stabilize at room temperature prior to NIR spectral data acquisition.
2.6. NIRS Calibration
Prior to carrying out NIR calibrations, the structure and variability of the population was studied using the CENTER algorithm included in the WinISI II software package (Shenk and Westerhaus Citation1991). This algorithm was performed a principal component analysis (PCA), and calculated the global Mahalanobis distance (GH) of each sample to the centre of the population in an n-dimensional space. The samples with > 3 were identified as spectral outliers (Shenk and Westerhaus Citation1991) and removed, repeating the process of detecting and removing spectral anomalies until all samples had a GH value lower than the recommended maximum.
An independent validation set was used to robustly test the precision of each calibration model. The set of samples was divided into two: a calibration set containing about 75% (93 samples) and an external validation set containing the remaining 25% (32 samples). These samples were selected randomly using the CENTER algorithm included in the WinISI software (Shenk and Westerhaus Citation1991).
As spectral pre-treatments, standard normal variate (SNV); Detrend (D), the combination of both (SNV + D) (Barnes et al. Citation1989) and Weighted multiplicative scatter correction (W-MSC) (Shenk and Westerhaus Citation1993) procedure was used for scatter correction, and several derivate mathematical treatments were tested: 1,4,4,1; 1,5,5,1; 1,6,4,1; 1,8,4,1; 1,10,5,1; 1,10,10,1; 2,4,4,1; 2,5,5,1; 2,6,4,1; 2,8,4,1; 2,10,5,1; 2,10,10,1, where the first digit denotes the derivative order (1 = first derivative, 2 = second derivative), the second digit denotes the size (nanometres) of the segment used to calculate the derivative), and the third and fourth digits denote the size (nanometres) of the intervals, used to calculate the smoothing of the derivative (Shenk and Westerhaus Citation1995).
The prediction models were performed by modified partial least squares regression (MPLS, Martens and Næs Citation1987) between spectral data and reference values, applying the cross-validation procedure to determine the optimal number of terms of the model. Four cross-validation groups were included to prevent over-fitting, which were sequentially used to cross-validate the prediction models. Furthermore, during the development process of prediction models, two elimination passes of chemical outliers were applied (T > 2.5; Mark and Workman Citation2003).
The statistics used to select the best model were: standard error of cross-validation (), standard error of external validation (
), coefficient of determination calculated in cross-validation (
) and external validation (
2). Moreover, the ratio of prediction to deviation (
, defined as the ratio between of the standard deviation for reference data to
and the range error ratio (
, defined as the ratio between of the range in the reference data to
) (Williams and Sobering Citation1996; Williams Citation2001; Williams Citation2014), was applied to evaluate the prediction ability of the models. Besides, the external validation was evaluated following the protocol outlined by Shenk et al. (Citation2001).
2.7. Standard error of the reference analytical methods
To evaluate the results of the NIRS models respect to the reference analytical method error, the standard error of the reference method () was calculated for each parameter from the variance between replicates of the same sample according to the following formula:
(Windham and Coleman Citation1989), where
is the replicate
of sample
,
is the mean of the replicates of sample
,
is the number of replicates and
is the number of samples. The
values of the reference analytical methods of the present study are showed in .
Table 1. Standard error of the reference method for determining the chemical composition and in vitro and in vivo digestibility.
3. Results
3.1. Empirical equations for OMD prediction
The mean, range and standard deviation of reference data of chemical composition and organic matter digestibility parameters of the collection of samples of TMR (n = 71) used to derive empirical equations for OMD prediction based on chemical constituents as predictors are given in . The average value of chemical composition (and range of variation), expressed as %DM were OM: 93.1 (88.2 to 96.5), CP: 14.6 (8.2 to 18.9), NDF: 41.2 (31.3 to 58.6), ADF: 23.1 (16.7 to 33.6), CF: 19.7 (14.2 to 30.1), HCEL: 18.1 (13.6 to 25.0), EE: 3.3 (1.9 to 5.5) and STA: 21.8 (5.1 to 34.6). The average value of OMD was 70.0%, ranging from 58.0 to 77.5%.
Table 2. Chemical composition and organic matter digestibility of the collection of samples of TMR used to derive empirical equations for OMD prediction.
The set samples represents a broad range of total mixed rations that include diets with a high concentrate content for lactating cows to rations with high forage content for dry cows. According to Parrini et al. (Citation2019), data set with a wide range of variability is essential for the development of a successful NIRS calibration model. The parameter that showed the highest variability was starch ( = 32.4%), followed by ether extract (
= 24.7%) and crude protein (
= 20.8%), whereas the parameter that showed the lowest variability was the OM content (
= 2.0%). The different fibre parameters showed intermediate variability, with CV values of 16.4% for CF, 15.1% for NDF, 11.8 for ADF, and 11.0% for HCEL, whereas OMD had a low coefficient of variation (
= 5.7%).
3.1.1. Correlations between chemical composition and organic matter digestibility
The value of the coefficient of correlation between OMD and the different chemical parameters were −0.84 for NDF, −0.79 for ADF, −0.74 for CF, −0.66 for HCEL, and 0.59 for CP. The high correlations between NDF and CF and ADF (
= 0.94, in both cases), and between ADF and CF (
= 0.98) also stand out ().
Table 3. Matrix of correlations between chemical composition and organic matter digestibility parameters of the collection of samples of TMR used to derive empirical equations for OMD prediction.
3.1.2. Predictive equations of OMD based on chemical parameters
shows the regression statistics for different models with chemical parameters as predictors, which are arranged within each group in increasing order of explained variance by calibration model (2). The multivariate model for estimate of OMD values, with NDF, STA, and CP contents as predictors, showed values of the coefficient of determination in cross-validation
and error prediction
of 0.76 and ± 1.93%, respectively. The elimination of STA from the equation reduce the value of
to 0.73 and increased the
to ± 2.07%. The subsequent elimination of CP, leaving only the concentration of NDF as a predictor, reduced the coefficient of determination for cross-validation to 0.68 and increased the standard error for cross-validation to ± 2.26%. The other univariate model, with ADF as the only predictor, showed the lowest value of
and the highest of
(0.59 and ± 2.54%, respectively).
Table 4. Prediction equations for organic matter digestibility of samples of TMR based on chemical parameters .
For external validation processes, the corresponding values of 2,
and RPDev, which are calculated when applying the four predictive models to external validation set, were 0.74, ± 2.06%, and 1.9 for the first, 0.63, ± 2.16%, and 1.8 for the second, 0.51, ± 2.45%, and 1.6 for the third, and 0.32, ± 2.90%, and 1.3 for the last model, respectively. For the first three equations, the observed value of
was lower than
(Shenk and Westerhaus Citation1995), which indicates excellent accuracy. Shenk et al. (Citation2001) reported that
values ranging from 0.70 to 0.89, indicate that the prediction model has a reasonable fit, whereas the values between 0.50 and 0.69 indicate a mediocre fit. Williams (Citation2001) established that
values ranging from 1.5 to 2.0 indicate that the model can be useful for qualitative prediction. Therefore, as the first three equations meet these criteria, they provide an approximate qualitative prediction of OMD values, whereas the equation, with ADF as the only predictor, should not be used to predict of OMD.
The slope of regression between predicted and reference values of OMD for the validation test was greater than 1.1 for the first three equations, therefore the prediction was prone to undesirable deviations, then the performance of that calibration should be regarded with caution.
3.2. NIRS models for prediction of chemical composition and OMD
The descriptive characteristics of the different parameters of chemical composition and OMD of the calibration and external validation sets, which were used to develop the NIRS predictive models as well as the corresponding statistics, are given in . The mean values (and range of variation) of the chemical constituents in the calibration and external validation populations, expressed as %DM, were OM: 92.7 (87.9 to 96.5) and 92.7 (88.2 to 96.4), CP: 15.2 (8.1 to 19.5) and 14.4 (7.1 to 18.9), NDF: 41.0 (31.0 to 67.0) and 42.7 (35.0 to 55.4), ADF: 23.1 (14.4 to 40.7) and 24.4 (16.9 to 33.4), CF: 19.5 (11.6 to 35.9) and 20.5 (13.3 to 28.9), EE: 3.3 (1.7 to 5.7) and 3.2 (2.1 to 5.1) and STA: 21.1 (5.1 to 45.4) and 20.7 (5.9 to 30.9). The mean OMD was 70.3% (ranging from 58.2 to 77.5%) in the calibration set and 69.3% (ranging from 58.0 to 76.9%) in the external validation set. All parameters reflected the wide variation in the composition of mixtures of forages and concentrates used in dairy cow feeding.
Table 5. Calibration, cross-validation and external validation statistics of NIRS models for predicting the chemical composition and organic matter digestibility of TMR samples.
The prediction models resulting from the first derivative provided more accurate and precise estimates for all parameters. The NIRS models were derived by the following spectral pretreatments: Detrend for OM, W-MSC for CF and EE, and SNV + D for CP, NDF, ADF, STA and OMD. The number of samples eliminated as chemical outliers in calibration process, expressed as a percentage of the total initial samples in the collection ranged from 2.1 to 5.3% for the different prediction models obtained.
The coefficients of determination () and the standard errors of prediction in cross-validation (
) were 0.92 and ± 0.45% for OM, 0.98 and ± 0.40% for CP, 0.98 and ± 0.74% for NDF, 0.95 and ± 0.88% for ADF, 0.98 and ± 0.58% for CF, 0.98 and ± 0.12% for EE, 0.99 and ± 0.81% for STA and 0.80 and ± 1.63% for OMD, respectively. According to the criteria defined by Shenk et al. (Citation2001) to judge the goodness of fit of equations based on the value of the coefficient of determination in cross-validation, the fit was excellent (
≥ 0.90) for the prediction of all chemical constituents of the TMR samples and good (
from 0.70 to 0.89) for OMD prediction. Based on the criteria defined by Williams (Citation2014) and Williams and Sobering (Citation1996) for evaluating the predictive quality of models based on
cv and
cv in cross-validation process, the estimation of all chemical parameters of the collection was good (
cv > 3 and
cv > 10). The ability prediction of NIRS model for OMD estimation was mediocre (
cv from 2.0 and 2.5), although the value of the statistic
cv of this model (11.8) exceeds the minimum value of 10, indicated by Williams (Citation2014) as the threshold for suitability of the NIRS model for quantitative prediction of biological parameters.
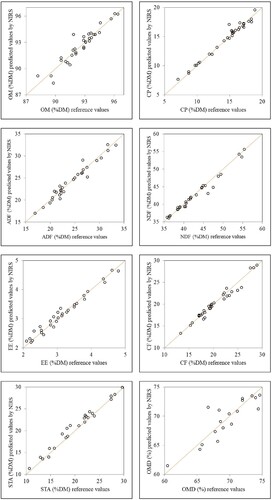
shows the scatter plots of reference data versus predicted values by NIRS for the external validation (independent) sets of chemical parameters and OMD. The values of the coefficient of determination 2, the
and the
ev were 0.90, ± 0.54%, and 3.4 for MO; 0.97, ± 0.52%, and 6.2 for CP; 0.98, ± 0.91%, and 6.2 for NDF; 0.95, ± 0.89%, and 4.6 for ADF; 0.96, ± 0.76%, and 5.0 for CF; 0.98, ± 0.12%, and 6.6 for EE; 0.99, ± 0.87%, and 8.4 for STA; 0.83, ± 1.89% and 2.5 for OMD, respectively. Considering the criteria defined by Williams (Citation2014) and Williams and Sobering (Citation1996), the predictive quality of the calibration models based on
ev values was good for all prediction models of chemical constituents, providing quantitative predictions with high reliability for independent samples, and acceptable for qualitative prediction of OMD. The
ve value of this parameter, however, lies at the limit of validity of model for quantitative predictions, as indicated by Williams (Citation2014).
Figure 1. Scatter plot of reference data vs. predicted values by NIRS of chemical composition and organic matter digestibility for samples of TMR.
Based on their robustness and reliability in the routine analysis of independent samples following indicated by Shenk et al. (Citation2001) and Shenk and Westerhaus (Citation1991), the models obtained showed a perform well and their validity by following criteria: 2 ≥ 0.60,
= ±0.60
and slope ranging from 0.9 to 1.1 in all models, although the criterion that the value of
c does not exceed
was fully met by the EE and STA estimation equations and only approximately met by OM, CP, NDF, ADF, CF, and OMD prediction models, indicating that some degree of variability in the set of external samples is not perfectly captured in the calibration set for these parameters. Furthermore, in all cases, the
values were lower than twice the standard error of the reference method, indicating low uncertainty, according to Shenk and Westerhaus (Citation1995).
4. Discussion
The collection of samples of total mixed ration for dairy cow that were used in this study mostly (86%) composed of TMR for cows at different lactation stages and the remaining (14%), of samples intended for feeding replacement animals and dry cows.
For this reason, the mean composition of the set of samples differs slightly to the usual compositions of TMR for lactating cows found in other databasess. Thus, the mean value of STA (21.8% DM) of our collective of samples is lower than that usually recommended by nutritionists (i.e. Linn et al. Citation2018) based on NRC recommendations (NRC Citation2001) for dairy cows at different stages of lactation (STA: 25-35% DM). Similarly, the mean NDF (41.2% DM) values exceed (NDF: 28-32% DM) the recommended upper limit.
The average values of our collection are similar to those assessed in dairy farms collaborating in different projects conducted at CIAM (G. Flores, personal communication) where feed mixtures for cows in different stages of lactation are also included with those for lactating cows from the first calving and rearing. For this, the mean content and range of variation of the following were assessed: CP (14.9% DM, ranging from 9.6 to 21.3), STA (23.6% DM, ranging from 17.8 to 34.4), ADF (23.1% DM, ranging from 17.8 to 34.4) and NDF (39.2% DM, ranging from 32.3 to 51.5). These values show the similarities between both sets of samples with the OMD value being somewhat higher (72.1%, ranging from 57.3 to 81.1) than that of the collection used in our study (70.0%, ranging from 58.0 to 77.5). Therefore, the ranges of the different variables determined in our collection represent the samples that could be expected in future analyses.
4.1. Empirical equations for OMD prediction
The equations selected in this study for predicting the OMD of TMR were two multivariate models based on the content of NDF, CP, and STA as well as that of NDF and CP. Two other equations based on NDF and ADF were used as single predictors. The coefficient of determination in cross-validation ranged from 0.76 in the first model to 0.61 in the model based on the ADF content, with the values in cross-validation ranging from ± 1.9 to ± 2.5% and the
cv value ranging from 2.0 to 1.5. The multivariate equations and the NDF-based equation meet the criteria set by Shenk et al. (Citation2001) and by Williams (Citation2001), with values of the coefficient of determination in external validation (
2) ranging from 0.74 to 0.51, and are useful for approximate qualitative predictions of digestibility in both collections of samples similar to the calibration group and independent samples. Conversely, the equation based on ADF, with a
2 of 0.32, that is, below the limit value of 0.50 (Windham and Coleman Citation1989), would not be useful for making predictions in independent samples.
Donker and Naik (Citation1979), from a small database consisting of 14 rations of dairy cows with a wide range of variation, derived equations based on CF and CF and CP to estimate the digestibility of rations (TDN), reporting values of coefficient of determination in calibration (2) of 0.89 and 0.95, respectively. Using a set of 224 mixed rations (forages and concentrates) for dairy goats, Giger et al. (Citation1986) developed univariate models for OMD prediction, with values of
2 and
in calibration ranging from 0.32 and ± 3.2% for CF to 0.50 and ± 2.8% for lignin (LAD), respectively. Whereas the multivariate prediction equations based on the fibre content (CF, ADF, or NDF), LAD, and CP were more accurate, with
2 values ranging from 0.56 to 0.64 and with
between ± 2.6 and ± 2.3%, and the magnitude of both statistics was slightly lower than those assessed in the empirical equations derived in this study. De Boever et al. (Citation1999), using a collection of 37 samples of fibre-rich raw materials (CF ≥ 19% DM and OMD ≤ 70%), derived an equation based on CF as the only component that explained 81% of the variance of OMD with an
value of ± 4.5% and with an
ratio of 2.3, based on which they considered the predictive performance of the empirical equation acceptable even though the number of observations in the collection was too low to derive robust equations.
4.2. NIRS models for chemical composition and OMD prediction
The NIRS calibration equations derived in this study for predicting OM, CP, NDF, ADF, CF, EE, and STA contents showed excellent quality, meeting the criteria defined by Williams (Citation2014). All equations have values of coefficient of determination in external validation 2 > 0.90 (from 0.90 for OM to 0.99 for STA) and
ev > 3.0 (from 3.4 for OM to 8.4 for STA). Our results showed the ability of NIRS to estimate, with high accuracy, the values of the chemical composition of samples of TMR, which were in line with those reported by other authors. For example, De Boever et al. (Citation1995), using a collection of 179 samples of feeds with different ingredients for cattle, reported that NIRS models for chemical composition prediction perform well with
values of ± 1.4% for CP, ± 1.4% for CF, and ± 0.7% for EE. In a study using samples of feed mixtures for large birds, Swart et al. (Citation2012) reported that NIRS models for CP, CF, and NDF prediction shows excellent performance, with values of
2 ≥ 0.94 and
ev ≥ 4.0, as well as a good for EE and ADF (
2 and
ev near 0.90 and 3.0, respectively) and poor for ash (
2 < 0.70 and
< 2.0). Khaleduzzaman et al. (Citation2017) using a group broiler diets samples, reported values of
≥ 0.95 for CP and EE, while for CF content was slightly worse (
= 0.81).
NIRS models performed by Mentink et al. (Citation2006) for estimating the chemical composition of TMR of dairy farms in Wisconsin (USA) showed the cv values similar to or higher than 3.0 for CP, NDF, and STA and ranging from 2.0 to 2.5 for EE, and ash, indicating that the NIRS technology is useful in predicting the composition of basic nutrients such as CP, NDF, STA, and EE in TMR. The NIRS models derived in the study by Ki et al. (Citation2009), to estimate the chemical composition of a wide collection (n = 253) of TMR of South Korean dairy farms, were less satisfactory, with values of coefficient of determination in cross-validation (
) and
vc of 0.69 and 1.3 for ash, 0.89 and 2.3 for CP, 0.72 and 1.5 for EE, 0.84 and 2.4 for CF, 0.88 and 2.3 for ADF, and 0.82 and 1.9 for NDF, respectively, which indicates that the predictive capacity of the models are low as the
cv indicates that they would provide only a quality classification of the samples for these components (CP, CF, and ADF) according to the criteria defined by Williams (Citation2014). Better results were found in the study by Soldado et al. (Citation2009) from a collection of 183 samples of TMR from dairy farms in the Cantabrian coast, reporting values of
and
cv of 0.62 and 9.7 for ash, 0.82 and 14.0 for CP, 0.81 and 13.4 for CF, 0.74 and 11.6 for EE, 0.71 and 11.1 for STA, 0.81 and 13.6 for NDF, and 0.77 and 12.7 for ADF, respectively, indicating that NIRS predictions these parameters with good accuracy and precision, except for ash content. Therefore, the results of this study are in line with those observed in our study regarding the satisfactory capacity of NIRS prediction models to estimate the chemical composition of TMR for dairy cows although the accuracy of NIRS calibration equations derived in the aforementioned study is slightly lower than that of our study.
The NIRS model selected in this study for OMD estimation would allow an acceptable quantitative prediction of independent samples, according to the criteria by Shenk et al. (Citation2001), Saeys et al. (Citation2005), and Williams (Citation2014), with values of 0.83 for 2, 2.5 for
ev, 10.0 for
ev, and ± 1.8% for
in external validation. In turn, a comparison between the predictive capacity of NIRS in estimating the OMD and that of the best empirical models based on the chemical composition of TMR shows that the former is better than the latter. After estimating the OMD of independent samples, the NIRS prediction model increased the percentage of explained variance from 74 to 83% and reduced the prediction error by 8%, that is, from ± 2.06% for the best empirical equation to ±1.89% for the NIRS prediction model.
Information on the predictive performance of NIRS models in estimating the digestibility of TMR for dairy cattle in the literature is scarce but matches our results, showing the potential of NIRS for estimating digestibility values of these samples. The study by De Boever et al. (Citation1995) analyzing the usefulness of the NIRS technique for predicting the in vivo digestibility of cattle feed mixtures consisting of different ingredients reported an in vivo OMD prediction error of ± 2.1%, somewhat higher than the value obtained in our study. The authors concluded that NIRS is a suitable technique for analyzing the nutritional value of compound feeds for ruminants. Other studies show that NIRS models, for estimating the digestibility values of samples of TMR have a good predictive capacity, concurrent with their ability to quantitatively predict the chemical composition of mixtures feed. Valiente et al. (Citation2004) developed NIRS models for predicting the digestibility value of different mixtures of cereal and straw in proportions ranging from 60:40 to 15:85, which were evaluated in sheep (n = 16), reporting a satisfactory in vivo OMD prediction with values of 0.85 for 2 and ± 1.9 for
in calibration process, whereas in cross-validation the coefficient of determination
was 0.75, and the
was ± 2.6%, similar to the in vivo digestibility determination error, which was ± 2.2%. Using a much higher number of samples, Mentink et al. (Citation2006) reported that the quality of the digestibility estimation (in vitro DOMD and DMS) by NIRS in a collection of 110 samples of TMR of North American dairy farms was acceptable and that the NIRS models showed in cross-validation values of 0.80 and 0.88 for
2.6 and 2.2 for
cv, 11.5 and 13.6 for
cv, and a low standard error
of ± 1.4 and ± 1.0% for DOMD and DMS, respectively, which highlights the usefulness of NIRS for estimating the energy value of TMR used in dairy cattle feeding, in line with our results.
5. Conclusions
The NIRS prediction models for estimating the OMD of total mixed ration for dairy cows based on chemical parameters showed superior predictive capacity than empirical equations. The NIRS prediction models were good for all chemical constituents, allowing quantitative estimations with high reliability and acceptable quantitative prediction of OMD. The predictive ability of empirical equations for estimating the OMD of TMR was lower than that of NIRS. Therefore, the NIRS calibrations developed in this study are a useful tool for quick and accurate nutritional evaluation of TMR used in dairy farms in Galicia, facilitating farmers’ adoption of the formulation of balanced and economic rations, and, thereby, providing advisory tools to milk dairy production.
Disclosure statement
The authors declare no conflict of interests.
References
- Alexander RH, McGowan M. 1966. The routine determination of in vitro digestibility of organic matter in forages. J Bri Grass Soc. 21:140–147.
- AOAC. 2003. Official Method 2003.06 Crude fat in feeds, cereal grains, and forages. J. AOAC Int. 86:888–899.
- Barnes RJ, Dhanoa MS, Lister SJ. 1989. Standard normal variate transformation and Detrending of near infrared diffuse reflectance spectra. Appl Spectrosc. 43:772–777.
- Bastianelli D, Bonnal L, Barre P, Nabeneza S, Salgado P, Andueza B. 2018. La spectrométrie dans le proche infrarouge pour la caractérisation des ressources alimentaires [Near infrared spectrometry for the characterization of feed resources]. Dossier: Ressources alimentaires pour les animaux d'élevage. 31(3):237–254.
- BOE. 1995. Métodos oficiales del MAPA BOE n° 52, del 2 de marzo de 1995, pp. 7161-7237. ESPAÑA [Official Methods of the Ministry of Agriculture, Fisheries and Food (Ministerio de Agricultura, Pesca y Alimentación – MAPA), Official State Gazette (Boletín Oficial del Estado – BOE) no. 52 of March 2, 1995, pp. 7161-7237, SPAIN]. Real Decreto 2257/1994 del 25 noviembre 1995, por el que se aprueba los métodos oficiales de análisis de piensos o alimentos para animales y sus primeras materias [Royal Decree 2257/1994 of November 25, 1995, whereby the official methods of analysis of animal feed and their raw materials are approved]. Boletín Oficial del Estado, 2 de marzo de 1995, 52, 7161-7237.
- De Boever JL, Cottyn BG, De Brabander DL, Vanacker JM, ChV B. 1999. Equations to predict digestibility and energy value of grass silages, maize silages, grass hays, compound feeds and raw materials for cattle. Nutr Abstr Rev Ser B. 69(11):835–850.
- De Boever JL, Cottyn BG, Vanacker JM, ChV B. 1995. The use of NIRS to predict the chemical composition and the energy value of compound feeds for cattle. Anim Feed Sci Technol. 51:243–253.
- Donker JD, Naik DG. 1979. Predicting total digestible nutrients and estimated net energy of dairy cows rations from chemical components. J Dairy Sci. 62:424–432.
- Eurostat. 2019. Available at: http://ec.europa.eu/eurostat/statisticsexplained/index.php/Milk_and_milk_product_statistics
- Gierus M, Eickler B, Resch R, Loges R, Taube F, Poetsch EM. 2016. Using in vitro methods to estimate metabolizable energy content of five forage legumes harvested under different defoliation systems. Die Bodenkultuur: J. Land Manag. Food Environ. 67(3):121–131.
- Giger S, Sauvant D, Hervieu J, Dorleans M. 1986. Étude de la prévision de la digestibilité des rations mixtes distribuées à des chèvres laitières par ses caractéristiques analytiques [Predicting ability of different analytical criteria for digestibility of mixed diets given to dairy goats]. Ann zootech. 35(2):137–160.
- Goering HK, Van Soest PJ. 1970. Forage fiber analysis (apparatus, reagents, procedures and some applications). In: United States Department of Agriculture, editor. Agriculture handbook no. 379. Washington (DC): USDA; 20 p.
- Gosselink JMJ, Dulphy JP, Poncet C, Jailler M, Tamminga S, Cone JW. 2004. Prediction of forage digestibility in ruminants using in situ and in vitro techniques. Anim Feed Sci Technol. 115:227–246.
- Huhtanen P, Rinne M, Nousiainen J. 2009. A meta-analysis of feed digestion in dairy cows. 2. The effects of feeding level and diet composition on digestibility. J Dairy Sci. 92(10):5031–5042.
- Khaleduzzaman ABM, Mamun MAA, Salim HM. 2017. Development of local calibrations for the nutritional evaluation of commercial poultry diets by using near infrared reflectance spectroscopy. J Appl Anim Res. 45(1):8–14.
- Ki KS, Kim SB, Lee HJ, Yang SH, Lee JS, Jin ZL, Kim HS, Jeo JM, Koo JY, Cho JK. 2009. Prediction on the quality of total mixed ration for dairy cows by Near Infrared Reflectance Spectroscopy. J Kor Grassl Forage Sci. 29(1):31–36.
- Linn J, Hutjens M, Shaver R, Otterby D, Howard WT, Kilmer L. 2018. Formulating dairy cow rations. University of Minnesota Extension. Available at: https://extension.umn.edu/dairy-milking-cows/formulating-dairy-cow-rations
- Mark H, Workman J. 2003. Statistics in Spectroscopy. Amsterdam: Elsevier – Academic Press.
- Martens H, Næs T. 1987. Multivariate calibration by data compression. In: Williams P., Norris K., editor. Near-infrared technology in the agricultural and food industries. Minnesota, USA: American Association of Cereal Chemists, Inc. St. Paul; p. 57–88.
- Massart DL, Vandeginste BGM, Buydens LMC, De Jong S, Lewi PJ, Smeyers-Verbeke J. 1997. Handbook of Chemometrics and Qualimetrics, Part A. Data Handling in Science and Technology, volume 20. Amsterdam: part A Elsevier.
- Mentink RL, Hoffman PC, Bauman LM. 2006. Utility of near-infrared reflectance spectroscopy to predict nutrient composition and in vitro digestibility of total mixed rations. J Dairy Sci. 89(6):2320–2326.
- National Research Council (NRC) . 2001. Nutrient Requirements of Dairy Cattle. Washington (DC): National Academy Press, 381 p.
- Nousiainen J. 2004. Development of tools for the nutritional management of dairy cows on silage-based diets [PhD Academic dissertation. University of Helsinki, Department of Animal Science Publications 72, Finland, pp. 61. Available at: http://ethesis.helsinki.fi/julkaisut/maa/kotie/vk/nousiainen
- Parrini S, Acciaioli A, Franci O, Pugliese C, Bozzi R. 2019. Near Infrared Spectroscopy technology for prediction of chemical composition of natural fresh pastures. J Appl Anim Res. 47(1):514–520.
- Saeys W, Mouazen AM, Ramon H. 2005. Potential for on site analysis of pig manure using Visible and Near Infrared Reflectance Spectroscopy. Biosyst Eng. 91(4):393–402.
- SAS. 2012. SAS system, version 9.4. Cary (NC): SAS Institute Inc., EEUU.
- Shenk JS, Westerhaus MO. 1991. Population structuring of near infrared spectra and modified partial least squares regression. Crop Sci. 31:1548–1555.
- Shenk JS, Westerhaus MO. 1993. Analysis of agriculture and food products by Near Infrared Reflectance Spectroscopy. Monograph. Port Matilda (PA): Department of Agronomy, Pennsylvania State University, Owners of Infrasoft International.
- Shenk JS, Westerhaus MO. 1995. The application of near infrared reflectance Spectroscopy (NIRS) to forage analysis. In: G.C. Fahey, editor. Forage Quality, Evaluation, and Utilization. Madison (WI): A.S.A., C.S.S.A., S.S.S.A.; p. 406–449.
- Shenk JS, Workman JJ, Westerhaus MO. 2001. Application of NIR spectroscopy to agricultural products. In: Burns DA, Ciurczak EW, editors. Handbook of near infrared analysis. New York: Marcel Dekker; p. 419–474.
- Soldado A, De La Roza-Delgado B, Martínez-Fernández A, Vicente F, López L, Díaz-Bueno E, 2009. Predicción de la composición bromatológica en dietas completas: Clonación de instrumentos y transferencia de ecuaciones NIRS en producto intacto [Prediction of bromatologic content of raw total mixed rations: standardization and transference of equations between NIR instruments]. In: F Joy, editor. Actas XIII Jornadas sobre Producción Animal AIDA. Spain: Zaragoza; p. 340–342. https://www.aida-itea.org/aida-itea/files/jornadas/2009/comunicaciones/2009_NyA_44.pdf.
- Swart E, Brand TS, Engelbrecht J. 2012. The use of near infrared spectroscopy (NIRS) to predict the chemical composition of feed samples used in ostrich total mixed rations. S Afr J Anim Sci. 42(1):550–554.
- Tilley JM, Terry RA. 1963. A two-stage technique for the in vitro digestion of forage crops. J Bri Grass Soc. 18:104–111.
- Valiente OL, Andueza D, de Vega A, Olmos G, Muñoz F. 2004. The use of NIRS for prediction of intake, digestibility and diet composition in sheep fed mixed grain: roughage diets. J Anim Feed Sci. 13(1):227–230.
- Van Soest PJ, Robertson JB, Lewis BA. 1991. Methods for dietary fiber, neutral detergent fiber, and nonstarch polysaccharides in relation to animal nutrition. J Dairy Sci. 74(10):3583–3597.
- Williams PC. 2001. Implementation of Near-Infrared technology. In: Williams, Norris, editor. Near-infrared technology in the agricultural and food industries. Minnesota, USA: American Association of Cereal Chemists, Inc. St. Paul; p. 145–169.
- Williams PC. 2014. The RPD statistic: a tutorial note. NIR News. 25:22–26.
- Williams PC, Sobering DC. 1996. How do we do it: a brief summary of the methods we use in developing near infrared calibrations. In: Davies, Williams, editor. Near Infrared Spectroscopy: The Future Waves. Chichester, Reino Unido: NIR Publications; p. 185–188.
- Windham WR, Coleman SW. 1989. Animal response prediction. In: Marten, editor. Near Infrared Reflectance Spectroscopy (NlRS): Analysis of forage quality. Washington (DC): USDA HandBook n° 643; p. 32–35.
- Windham WR, Mertens DR, Barton IIFE. 1989. Protocol for NIRS calibration: sample selection and equation development and validation. In: Marten, editor. En: Near Infrared Reflectance Spectroscopy (NlRS): Analysis of forage quality. Washington (DC): USDA Hand Book n° 643; p. 96–103. EEUU