
ABSTRACT
Canine mammary gland tumour (CMT) commonly affects the female dog. The objective of this study was to develop a doxorubicin-resistant CMT cell line and determine its in vitro and in vivo characteristics, including mRNA and microRNA (miRNA) expression profiles. Doxorubicin-resistant CMT-Star cells were developed from CMT-Stylo cells. The cells were characterized, including tumorigenicity in NOD/SCID mouse models. MiRNA and mRNA expression of the two cell lines were profiled and clustered. ATP binding cassette subfamily B member 1 (ABCB1) and subfamily G member 2 (ABCG2) expressions were significantly increased in the CMT-Star cell line. CMT-Star cells also had altered expression of 785 genes and 14 miRNAs. Downregulating plasminogen (PLG) and plasminogen activator urokinase (PLAU) while upregulating transforming growth factor beta receptor 3 (TGFBR3), epidermal growth factor receptor 1 (EGFR1) and ABCB1 rendered CMT-Star cells less proliferative, less invasive and more resistant to chemotherapeutic drugs. The upregulated miRNAs in CMT-Star cells include miRNA-191, -29a, -107, -99b, -874, -93 and -210, while the downregulated miRNAs include miRNAs-106a, -92a, -92b, -155 and -15b. TGFβR, EGF receptor 1 and Wnt signalling are enriched in doxorubicin-resistant CMT-Star cells and could be potential therapeutic targets in dogs with doxorubicin-resistant CMT.
Introduction
Due to their homogeneity, normal tissue cells respond in almost the same way to chemotherapeutic drugs; however, in cancer, tumour cell heterogeneity (genetic and phenotypic) may lead to some cells in the tumour cell population having drug resistance properties (Gottesman Citation2002). The drug-resistant cells present in the general tumour cell population will remain alive after all other cell types have been killed by the drug, and will later repopulate the tumour with new cells as recurrence, or grow in other tissues as metastasis.
Drug resistance in cancer cells, either acquired or inherent, is a major cause of failure of many forms of anti-cancer chemotherapy (Gottesman et al. Citation2002; Komarova and Wodarz Citation2005; Lippert et al. Citation2008), including in up to 90% of patients with metastatic cancer (Longley et al. Citation2006). A drug resistance mechanism can be effective against one drug due to changes in the cell that affect how that particular drug acts, or it can be effective against many drugs of different classes, which is termed multi-drug resistance (Gottesman et al. Citation2002; Komarova and Wodarz Citation2005). There is a continuous need to identify new therapeutic targets in cancer cells, and more importantly, in drug-resistant cancer cells.
A large group of energy-dependent transporters known as the ABCs (ATP binding cassettes) moves nutrients and other molecules in and out of animal cells (Gottesman et al. Citation2002). ABCs comprise seven families with members such as ABCG2, ABCB1, ABCC1 and others (there are 48 known ABC transporters) known to be involved in transporting numerous cytotoxic drugs out of cancer cells, leading to multi-drug resistance therein (Gottesman et al. Citation2002; Martin et al. Citation2014; Moitra Citation2015). The ABC transporters are important for protecting normal stem cells and are sometimes used as stem cell identification markers (Moitra Citation2015). Due to their unmistakable significance in the quest for effective anti-cancer therapy, various studies on these transporters have accumulated vast amounts of data. Spontaneous canine cancers have been described as good large-animal models for the study of human cancers (Nerurkar et al. Citation1989; Selvarajah et al. Citation2009; Queiroga et al. Citation2011). The female dog is affected by mammary cancer about four times more often than women (Cullen and Matthew Citation2002), making CMT a very much available natural model for breast cancer research with the aim of understanding the molecular basis of cancer progression. In the canine species, studies have reported increased expression of some of the known drug resistance genes, such ABCB1, ABCG2 and ABCC1 in drug resistant cancer cells, including drug resistant CMT, compared to the normal tissues or drug sensitive cancer cells (Tomiyasu et al. Citation2010, Citation2014; Gartzke et al. Citation2015; Salgado et al. Citation2015). The expression of ABCC1 in CMT was of prognostic significance in 37% of the dogs in a study, negatively influencing their overall survival (Salgado et al. Citation2015).
The entry into the genomic era has directed cancer therapy to a more personalized approach, where each patient is seen as an individual at molecular level to determine the driver mutations in the cancer genome that differentiate it from the patient genome. This allows the designing of a treatment regimen and approach that best suits that particular patient based on targetable changes in the genome (Morris Citation2016). These genomic changes that confer the cancer cell its advantageous phenotype is a result of altered gene expression in the cancer cell. Gene expression changes in the cancer cell could be broadly due to transcriptional or post-transcriptional gene regulation. In any case, these changes could be the basis for the initiation and progression of cancer and must be identified and reversed or circumvented for successful anti-cancer therapy.
Alterations in protein expression due to microRNA (miRNA) regulation of mRNA is described as the most common mode of post-transcriptional gene regulation, as it has been predicted that about 60% of all mRNAs are regulated by miRNAs (Bartel Citation2009). MiRNAs are short (20–24 nucleotides) non-coding RNAs that play important roles in all biological pathways in multicellular organisms, including mammals (Jansson and Lund Citation2012). MiRNA post-transcriptional regulation of mRNA is essential in processes such as cell cycle control, cell proliferation, apoptosis, differentiation, migration, metabolism and stem cell maintenance in both normal and cancerous cells (Jansson and Lund Citation2012; Rothschild Citation2014; Fish et al. Citation2020). The involvement of miRNAs in oncogenesis and cancer progression has made them very attractive targets in oncology research since their discovery almost three decades ago (Ambros Citation1989; Piva et al. Citation2013; Zadran et al. Citation2013; Schultz et al. Citation2014; Tang et al. Citation2016); the activity of a few miRNAs has been modulated for therapeutic applications (Rothschild Citation2014; Zhang et al. Citation2015). MiRNA expression has been reported to be involved in resistance to chemotherapy in cancer cells. Increased expression of miRNA-210 was reported in the plasma of patients with trastuzumab-resistant breast cancer (Jung et al. Citation2012). Similarly, in patients with colorectal cancer, miRNA-107 expression was associated with sensitivity to chemotherapeutic agents (Molina-Pinelo et al. Citation2014). Paclitaxel sensitivity was also improved by ectopic expression of miRNA-100 in breast cancer cells (Zhang et al. Citation2015). Modulating the transcription of miRNAs such as miRNA-107, miRNA-210 and miRNA-100 in drug-resistant cancer cells would facilitate the identification of novel therapeutic targets in such cancers. Overall, miRNAs involved in cancers act as tumour suppressors or oncogenes, with each category exerting its effect depending on its level of expression and activity (Qin et al. Citation2013). Therefore, the objective of this study was to develop, characterize (in vitro and in vivo) and profile (mRNA and miRNA expression) a doxorubicin-resistant sub-line from a canine mammary gland adenocarcinoma cell line.
Materials and methods
CMT-Stylo cell line
The CMT-Stylo canine mammary adenocarcinoma cell line was developed as a primary culture of mastectomy tissue. The tumour was obtained upon consent from the owner; routine histopathology using haematoxylin and eosin staining confirmed the tumour as grade 3 tubulopapillary adenocarcinoma (Goldschmidt et al. Citation2011). The tumour tissue dissociation, the primary culture and confirmation of the cells as CMT cells, using gene expression for ten genes using canine specific primers, have been reported (Foong et al. Citation2018). Briefly, about 100 gm tumour tissue was dissociated by 4 h incubation in 2% Trypsin-EDTA solution (Sigma- Aldrich®, USA). The mixture was centrifuged at 200 g for 10 min. The resultant cell pellets were plated in RPMI 1640 medium (Gibco®, USA) supplemented with 10% foetal bovine serum (FBS) and 1% streptomycin and penicillin at 37°C in 5% CO2.
Induction of doxorubicin resistance in CMT-Stylo cells
Passage 18 CMT-Stylo cells were exposed to steadily increasing concentrations of doxorubicin (Boryung Pharmaceutical, Korea), a minor modification of published methods for chemoresistance induction in cancer cells (Tegze et al. Citation2012; Zhou et al. Citation2017). First, the cells were cultured with 1 nM doxorubicin in complete DMEM. The cells were seeded at a density of 200,000 cells per 25 cm2 flask. After the cells achieved 75% confluence (after 2 weeks in culture), the doxorubicin concentration was increased to 10 nM until the cells were 75% confluent again. The cells were then exposed to 20 nM, then 40, 50, 60, 70, 80 and 100 nM doxorubicin. At each concentration, the cells took 12–17 days to reach 75% confluence. The induction of resistance took about 5 months (4 months, 3 weeks) to produce cells that could proliferate in 100 nM doxorubicin. At every stage, some cells were frozen, and some were lysed in RLT buffer (Qiagen®, Germany) with 1% β-mercaptoethanol (BIORAD, Singapore) for RNA isolation and stored at −80°C until further processing. Doxorubicin cytotoxicity in the cells was also determined (MTT [3-(4, 5-dimethylthiazol-2-yl)-2, 5 diphenyl tetrazolium bromide)] assay). The doxorubicin-resistant cell line produced from CMT-Stylo was designated CMT-Star.
Cytotoxicity assay to determine the IC50
At passage 28, both the CMT-Stylo cells and the doxorubicin-resistant CMT-Star cells were seeded for the MTT assay. Single cells were seeded in three 96-well plates at a density of 10,000 cells per well in 100 µL medium. The cells were incubated for 24 h in 5% CO2 at 37°C. After 24 h, the medium was replaced with 100 µL new medium containing 10 µM doxorubicin as the highest concentration, followed by serial dilution by half. The last row of wells (i.e. H-wells) was left untreated as the control. The treated cells were again incubated at 37°C in 5% CO2. After 72 h, the MTT assay was performed.
Briefly, 20 µL MTT (5 mg/mL, Thermo Fisher Scientific) was added to each well and incubated for 3–4 h. Most of the medium was removed, leaving only the purple formazan. Dimethyl sulfoxide (DMSO, 100 µL, Thermo Fisher Scientific) was added to each well and the plate was placed on a shaker for 15 min to allow uniform distribution of the DMSO to dissolve the formazan crystals formed by MTT. The absorbance was measured at 570 nm using a spectrophotometer (Infinite® 200 PRO NanoQuant, Switzerland).
Prism 7 software (GraphPad Software, USA) was used to plot the viability/cytotoxicity curves and to determine the doxorubicin IC50. The IC50 of doxorubicin in the CMT-Stylo and CMT-Star cells was determined by at least three independent MTT assays, and the values are reported as the mean and standard deviation. The cytotoxic effects of cyclophosphamide (Biochem Pharmaceutical, India), carboplatin (Hospira, Australia), vincristine (United Pharm, Korea) and meloxicam (Safecon Lifesciences, India) were also determined for both cell lines as described for doxorubicin to determine the type of induced resistance in the CMT-Star cells (i.e. single- or multi-drug resistance). These drugs were chosen for their different mechanisms of action. Cyclophosphamide and carboplatin both cause DNA damage in cells (Chhipa et al. Citation2005; Saijo Citation2012), vincristine inhibits mitotic cell division (Rai and Wolff Citation1996) and meloxicam is a non-steroidal anti-inflammatory drug (Pang et al. Citation2014). They represent the different classes of drugs commonly used in the treatment of CMT.
Cell proliferation assay and determination of cell doubling time
To determine the proliferation rate of the CMT-Stylo and CMT-Star cells, a previously described protocol (Yang et al. Citation2015) was used with minor modifications. Briefly, 3000 cells per well were seeded in each well of a 24-well plate and incubated in DMEM supplemented with 10% FBS and 1% penicillin and streptomycin at 37°C in 5% CO2. The cells in three wells (triplicate) were counted each day (after each 24 h) for 1–6 days, and the mean of the three wells was recorded for that day. Three independent experiments were conducted and the mean number of cells per day was used to construct the proliferation curves of the number of cells per day and to determine the cell doubling time. The proliferation curves were drawn and cell doubling time was determined using free online Roth V. 2006 software (Argast et al. Citation2011).
Apoptosis and cellular morphological changes (acridine orange/propidium iodide [AO/PI] double staining)
To determine the cellular morphological changes and apoptosis in the CMT-Stylo cells and CMT-Star cells in response to doxorubicin treatment, AO/PI double staining was performed according to a published protocol (Abu et al. Citation2014). Both dyes bind to DNA; AO binds to the DNA in live and dead cells while PI binds to the DNA of dead cells (with no membrane integrity). Briefly, 2.4 × 10⁵ cells per well were seeded in 6-well plates and cultured in complete medium (DMEM supplemented with 10% FBS and 1% penicillin and streptomycin), and incubated at 37°C in 5% CO2. The cells were incubated for 24 h before 24-, 48- and 72-h treatment with 100 nM doxorubicin. At each time point, the cells were harvested using trypsin and centrifuged with the spent medium at 200 g for 10 min at 4°C. The supernatant was discarded and the cells washed twice with cold phosphate-buffered saline (PBS) by centrifugation at 100 g for 5 min. The cells were resuspended in 100 µL PBS, and 10 µL cell suspension was stained with 10 µL AO/PI double stain at 10 µg/mL. The stained cells were immediately viewed using a fluorescent microscope (Leica DM IRM, Meyer Instruments, USA) and pictures were taken using an image analyzer within 30 min of staining. CMT-Stylo and CMT-Star cells were also incubated in untreated wells for comparison. Morphological changes such as membrane blebbing, chromatin condensation, nuclear fragmentation and other changes were noted. The proportions of cells that exhibited such changes in each group were noted. Cells in five high-power fields (×40 magnification) were assessed and counted.
Anchorage-independent growth assay
The anchorage-independent colony formation assay was performed using a previously described semisolid agarose bilayered system (Selvarajah Citation2011) with minor modifications. A total of 1.5 mL basal agar containing 0.5% agarose in DMEM (Thermo Fisher Scientific) supplemented with 10% FBS (Thermo Fisher Scientific) and 1% penicillin and streptomycin was plated in a 6-well plate. The top layer (1.5 mL) containing 0.35% agarose in DMEM supplemented with 10% FBS and 1% penicillin and streptomycin and 6000 cells per well was plated. The experiment was performed in triplicate, and the 6-well plates were incubated in 5% CO2 at 37°C for 15 days. Twice a week, 100 µL fresh medium was added to the surface to prevent desiccation. After 2 weeks, 200 µL crystal violet (staining dye) were added to the culture and incubated overnight. The colonies [minimum of 50 cells in a cluster (Yang Citation2012)] were counted and imaged using NIS Elements image analysis software version 4.2 (Nikon Instruments Inc., USA).
Wound-induced migration assay
The wound-induced migration assay was performed according to a previously described protocol (Pang et al. Citation2011) with minor modifications. Briefly, about 10,000 cells per well each from the CMT-Stylo and CMT-Star cell lines were seeded in 6-well plates. The cells were incubated in DMEM (Thermo Fisher Scientific) supplemented with 10% FBS (Thermo Fisher Scientific) and 1% penicillin and streptomycin at 37°C in 5% CO2 until 85% confluent. A scratch (wound) was made using a 200-µL pipette tip, and then each well was washed with medium. Fresh complete growth medium (2.5 mL) was added to each well and incubated. Pictures were taken at 0, 4.5, 7, 24 and 28 h after wounding. The cell migration rate (%) was determined using the following formula: (A – B)/A × 100, where A = the initial width of the wound and B = the width of wound at time of measurement (Pang et al. Citation2011). Two separate sections of the wounds were measured for each cell type, and the proliferation rates are given as the means and standard deviation of the two measurements.
Tumour sphere formation assay
A tumour sphere is a spherical clump of cells comprising CSC and differentiated tumour cells, derived from a single CSC (Zhou et al. Citation2015), although some differentiated tumour cells could form spheres (Pastrana et al. Citation2011). The size of the tumour sphere and the number cells therein depend on proliferation of the sphere forming cells, as well as the duration of the culture (Zhou et al. Citation2015), however, spheres of 30 µm and above have been reported 2 days following single-cell-derived sphere formation assay (Chen et al. Citation2016).
The tumour sphere formation assay was performed according to a previously described protocol (Lehmann et al. Citation2012) with slight modifications. CMT-Stylo and CMT-Star (1 × 10⁴ cells each) were incubated in triplicate in 6-well ultra-low attachment plates (Corning®, USA) in serum-free DMEM-F12 (Thermo Fisher Scientific) supplemented with 1% penicillin and streptomycin, 10 ng/mL basic human fibroblast growth factor (bFGF, Thermo Fisher Scientific) and 10 ng/mL epidermal growth factor (EGF, Thermo Fisher Scientific) and incubated at 37°C in 5% CO2. The spheres that formed after 7 days’ incubation were measured, and images were obtained using NIS Elements image analysis software (Nikon) version 4.2 on a light microscope (Nikon ECLIPSE TS100).
Animal ethics approval and animal models
The Universiti Putra Malaysia (UPM) Institutional Animal Care and Use Committee (IACUC) approved this study with the approval code UPM/IACUC/AUP-R059/2015.
Six female NOD/SCID mice, aged 6 weeks, purchased from BioLASCO (Japan) were housed in individually ventilated cages (IVC) in a specific pathogen–free (SPF) room at a density of five mice per cage. Feed and water were provided ad libitum, and the temperature was maintained at 25°C with a 12-h light/dark cycle. The mice were allowed to acclimatize to the new environment for 10 days prior to the experimental procedures.
The tumour induction method was adopted from previously published protocol (Shen et al. Citation2008; Tomiyasu et al. Citation2010) with slight modifications. CMT-Stylo cells (1 × 10⁷) suspended in 300 µL complete growth medium were administered subcutaneously to the left flank in three NOD/SCID mice. In another set of three mice, 1 × 10⁷ CMT-Star cells were administered subcutaneously to the left flank. In each mouse, 300 µL complete growth medium was administered to the opposite site (right) of the first injection site to serve as a control.
Animal monitoring and observation
The mice were monitored for a maximum 77 days post-injection for tumour development at the injection sites and for metastasis. During the observation period, parameters such as mouse weight and tumour size were measured once a week. The other parameters observed were feed intake and survival. At the end of the study period, the mice were euthanized using CO2 inhalation. The developed tumours and internal organs (lung, liver, kidney and brain) were harvested for histopathology. The tumour tissues and organs were fixed in 10% buffered formalin, and a portion of the tumours was snap-frozen in liquid nitrogen and stored at −80°C.
The mice were removed from the study/euthanized if any of the following observations were made: tumour diameter of 2.5 cm, apparently sick (recumbent/labored breathing), loss of 10% of body weight within a week and ruptured tumour with active bleeding (National Research Council Citation2011; Barbieri et al. Citation2015; Bogachek et al. Citation2015).
Post-mortem examination and histopathology
The tumours and suspected lung tissues were harvested, and parts of the tissues were frozen, or fixed in 10% buffered formalin (Merck KGaA, Germany) and subsequently embedded in paraffin. A minimum of two tissue blocks were made per mouse. Two sections of 4-µm thickness were obtained from each tissue block. The sections were placed on plain microscope slides (Sail brand 7101, China) and stained with haematoxylin and eosin for routine histopathology assessment.
RNA isolation and cDNA synthesis
Total RNA was isolated from CMT-Stylo, CMT-Star 60 and CMT-Star 100 cells. Total RNA was extracted from 4 × 10⁶ cells using a RNeasy Plus Mini Kit (Qiagen®) according to the manufacturer’s instructions. To ensure DNA-free extracted RNA, we used two-step genomic DNA (gDNA) removal, which included using the manufacturer’s recommendation of using gDNA eliminator spin column and additional incubation with 80 µL RNase-free DNase (Qiagen®) to digest gDNA that might have passed through the RNA isolation columns. The RNA concentration and purity were determined using a spectrophotometer (Infinite® 200 PRO NanoQuant). A total of 1 µg RNA from each sample was reversed-transcribed into cDNA in 20-µL reaction volumes using a QuantiNova Reverse Transcription Kit (Qiagen®) according to the manufacturer’s instructions. Annealing was set at 25°C for 3 min, reverse transcription was at 45°C for 10 min and inactivation was at 85°C for 5 min.
Quantitative real-time PCR
QPCR was performed using 50 ng cDNA using a QuantiNova SYBR green kit (Qiagen®) as per the manufacturer’s protocol. The QPCR was run on a CFX96 Real-Time System (BIORAD®, USA). The total reaction volume was 20 µL, and the reaction mixture contained SYBR Green mix (DNA polymerase, SYBR Green PCR buffer, dNTPs), forward and reverse primers (500 nM each), nuclease-free water and 50 ng cDNA.
The primers of three drug resistance genes, i.e. P-gp (ABCB1, MDR1), ABCG2 (BCRP) and MRP1 (ABCC1), and two reference genes, i.e. GAPDH and RPS19, were used for the QPCR. Previously designed, validated and published primers for canine genes were used (). For each sample, the five genes were quantified in three technical replicates. Each primer was diluted in the appropriate volume of distilled water (dH2O, ultra) as recommended by the supplier to a stock solution of 100 µM. From the stock, a 1:10 working dilution of 10 µM was prepared for further use.
Table 1. Primers for drug resistance genes for quantitative real time polymerase chain reaction
The QPCR was hot-started for 2 min at 95°C, followed by denaturation at 95°C for 5 sec. The annealing and extension were run for 15 sec at the specific annealing temperatures of each primer set (). The QPCR was run for 40 cycles. Each sample was run in duplicate.
Statistical analysis
All experiments were performed in triplicate and the results are presented as the mean and standard deviation. The independent t-test was used to determine the significance of the variation between the mean IC50 of the cytotoxic drugs screened and the apoptosis-related parameters of the CMT-Stylo and CMT-Star cells, and to determine the significance of differences in colonies formed per field in the anchorage-independent growth assay. The independent sample t-test was also used to compare the mean of sphere sizes and tumour sizes between the mice injected with CMT-Stylo cells and the mice injected with CMT-Star cells.
Survival was compared using Kaplan–Meier survival analysis (log rank test, within 95% confidence interval), and the hazard ratio of the mice post-injection was determined using Cox regression. Significance was set at P < 0.05; we used IBM SPSS™ Statistics, version 22 (IBM Corporation, USA).
The QPCR data were analyzed using the comparative Ct (ΔΔCt) method (Kim et al. Citation2015), and results are reported as the fold change in gene expression, with significance set at P < 0.05, using CFX Manager Software version 3.1 (BIORAD®, USA).
The significance of differences in the cell migration rates in the wound-induced migration assay were determined using repeated measure ANOVA. For the microarray data, the differentially expressed genes between the samples were identified using a moderated t-test with Benjamini–Hochberg FDR.
Microarray hybridization and normalization for gene expression profiling of CMT-Stylo and CMT-Star cell lines
The quality of the total RNA was analyzed using an Agilent 2100 Bioanalyzer (USA) to obtain the RNA integrity number (RIN). After confirming that all samples had RIN ≥ 7, the samples were used for microarray hybridization in duplicate (technical replicates). The concentration of all RNA samples was normalized to 50 ng prior to cyanine-3 (Cy3) labelling using a One-Color Low Input Quick Amp Labelling Kit (Agilent) according to the manufacturer’s instructions. The Cy3-labelled complementary RNAs (cRNAs) were purified using an RNeasy Mini Kit (Qiagen, USA). Dye incorporation and cRNA yield were evaluated using a NanoVue™ Plus Spectrophotometer (GE Healthcare, UK). Cy3-labelled cRNA (0.825 μg) with specific activity >6 pmol Cy3/µg cRNA was fragmented at 60°C for 30 min in a 25-μL reaction volume containing 25× Agilent fragmentation buffer and 10× Agilent blocking agent following the manufacturer’s instructions. After fragmentation, 25 μL mixture was combined with 25 μL 2× Hi-RPM Hybridization Buffer and immediately hybridized (in duplicate) to Agilent SurePrint Canine Gene Expression 4 × 44 K Microarray v2 (Design ID: 021193) for 17 h at 65°C in a rotating Agilent microarray hybridization oven. After hybridization, the microarrays were washed for 1 min at room temperature with GE Wash Buffer 1 (Agilent) and for 1 min at 37°C with GE Wash Buffer 2 (Agilent). The slides were immediately scanned using an Agilent SureScan® Microarray Scanner (G4900DA) with 5-μm resolution at 532 nm wavelength (Cy3) using the extended dynamic range (10–100%) setting. Normalized intensities were extracted using Agilent Feature Extraction software for further analysis.
Microarray gene expression data analysis
Microarray gene expression data were analyzed using Agilent GeneSpring Analysis Software version 14.8. Default flag settings were used to make the detection calls. The signal intensities of each probe were normalized to the 90th percentile with baseline transformation to the median of all samples. Hierarchical clustering of the differentially expressed genes in all samples and between sample subsets was performed to identify the upregulated and downregulated genes.
Microarray gene expression validation
The microarray gene expression results were validated using QPCR. Selected genes expressed differentially among the samples were chosen and their respective expression in each sample was determined. Canine-specific validated primers were used for the amplification using the kit and protocol used in the earlier QPCR assays. lists the genes, primers and the annealing temperatures used in the validation. The reference gene GAPDH was used.
Pathway analysis
The pathways regulated by the genes differentially expressed between the groups were determined using a single-experiment analysis (SEA)-moderated t-test with the following settings: Selected Annotations for Experiment (RefSeq Protein ID; Entrez Gene ID; Ensembl Gene ID; GenBank Accession; UniGene ID; TIGR ID), Selected Pathway Sources (WikiPathways) and Pathway Organism (Canis familiaris). DAVID was used for gene ontology of the differentially expressed genes between the cell groups to identify the biological processes, molecular functions and cellular compartments. This would yield an image of the differences in the cellular functions and processes that characterize the cells due to the effect of doxorubicin resistance.
MiRNA profiling of cell lines
The quality of the isolated RNA was analyzed using an RNA 6000 Nano and Small RNA kit, and a 2100 Agilent Bioanalyzer was used to check the total RIN and confirm the presence of small RNAs.
The concentrations of the four RNA samples were normalized to 100 ng before Cy3 labelling using a miRNA Complete Labeling and Hyb Kit (Agilent) according to the manufacturer’s instructions. The Cy3-labelled cRNA was dried using a vacuum concentrator, and then resuspended in 17 µL nuclease-free water before 10× Gene Expression Blocking Agent and 2 × Hi-RPM Hybridization Buffer (Agilent) were added for fragmentation at 100°C for 5 min. Forty-five microliters of the mixture were immediately hybridized (in duplicate) to an Agilent SurePrint® G3 Custom miRNA 8 × 60 K microarray (Design ID: 084492) for 20 h at 55°C in a rotating Agilent microarray hybridization oven. After hybridization, the microarrays were washed for 5 min at room temperature with GE Wash Buffer 1 (Agilent) and 5 min with GE Wash Buffer 2 (Agilent) at 37°C. The slides were immediately scanned using an Agilent SureScan® Microarray Scanner (G4900DA) with 3-μm resolution at 532 nm wavelength (Cy3) using the extended dynamic range (10–100%) setting. Normalized intensities were extracted using Agilent Feature Extraction software (version 11.5.1.1) with protocol miRNA_1200_Jun14, and all eight data files (in.txt format) were obtained. The miRNA microarray data were deposited in GEO under accession number GSE114889.
Differential miRNA transcription analysis
The expressed miRNAs from the cell lines were analyzed using a moderated t-test with the Benjamini–Hochberg FDR method; P-values were computed asymptotically, with a P-value of 0.05 and fold change cut-off at 2.0.
Prediction of targeted genes
Targeted genes of the entities identified from the Filter on Volcano Plot analysis with Benjamini–Hochberg multiple testing corrections were identified using the target prediction database TargetScan. The total number of entities that fulfilled the P-value of <0.05 in each comparison group was considered. The pathways regulated by the genes targeted by the differentially expressed miRNAs between the groups were determined using the SEA-moderated t-test with the following settings: Selected Annotations for Experiment (RefSeq Protein ID; Entrez Gene ID; Ensembl Gene ID; GenBank Accession; UniGene ID; TIGR ID), Selected Pathway Sources (WikiPathways) and Pathway Organism (Canis lupus familiaris).
Comparisons of dysregulated miRNA expression
The dysregulated miRNAs between the CMT-Stylo and CMT-Star cells were compared using Venn diagrams generated using Venny version 2.1.0 (http://bioinfogp.cnb.csic.es/tools/venny/) (Oliveros Citation2016). The potential overlap between the dysregulated genes and pathways in each comparison group in the gene expression portion with the genes and pathways targeted by the dysregulated miRNAs in the cell lines in this portion was determined using Venn diagrams.
Results
Characteristics of canine mammary gland tumour (CMT)-Stylo cells in vitro
The CMT-Stylo cell line comprises predominantly epithelial-like cells, with some cells having a mesenchymal-like structure. This was further supported by the detection of vimentin expression (an intermediate filament expressed in cells undergoing epithelial–mesenchymal transition [EMT]) in 44% of the cells (our unpublished work) in the tissue from which the CMT-Stylo cells were developed. The average cell size was 37.6 ± 6.32 µm ().
Figure 1. CMT-Stylo cells (A) and CMT-Star cells (B) in culture.
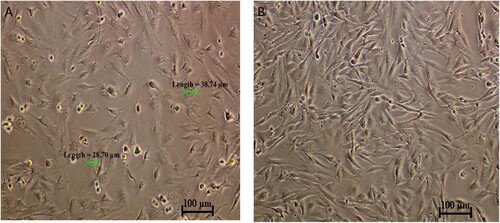
CMT-Stylo cells at passage 18 and CMT-Star cells at passage 6. CMT-star cells are maintained in culture media containing 5 nM doxorubicin.
CMT-Star cells are more resistant to doxorubicin and other cytotoxic drugs
The median inhibitory concentration (IC50) of doxorubicin in the CMT-Stylo cells was 404 ± 23.6 nM. Following exposure of the cells to 10 nM doxorubicin, the IC50 increased to 561 nM, and continued to increase in tandem with the increased resistance in the cells until 100 nM doxorubicin. The final IC50 of doxorubicin in the CMT-Star cells was 5013 ± 59 nM, which was significantly different (P = 0.000001) from the initial IC50 of the CMT-Stylo parental cells (A).
Figure 2. comparative IC50 between CMT-Stylo cells and CMT-Star cells treated with chemotherapeutic drugs. A: The graph shows cell viability plotted against log-transformed doxorubicin concentration in CMT-Stylo and CMT-Star cells. IC50 of doxorubicin of the CMT-Star cells was increased by 1140% compared to that in the CMT-Stylo cells (404 nM vs. 5013 nM). B shows cell viability plotted against log-transformed cyclophosphamide concentration in CMT-Stylo and CMT-Star cells. The IC50 of cyclophosphamide of the CMT-Star cells was increased by 91% compared to that of the CMT-Stylo cells (2714 nM vs. 5885 nM). C shows cell viability plotted against log-transformed carboplatin concentration in CMT-Stylo and CMT-Star cells. The IC50 of carboplatin of the CMT-Star cells was increased by 103.6% compared to that of the CMT-Stylo cells (338.6 nM vs. 689.5 nM). D shows cell viability plotted against log-transformed vincristine concentration in CMT-Stylo and CMT-Star cells. The IC50 of vincristine of the CMT-Star cells was increased by 117.6% compared to that of the CMT-Stylo cells (589.5 nM vs. 1283 nM). E shows cell viability plotted against log-transformed meloxicam concentration in CMT-Stylo and CMT-Star cells. The IC50 of meloxicam of the CMT-Star cells was increased by 42.3% compared to that of the CMT-Stylo cells (1184 nM vs. 1688 nM).
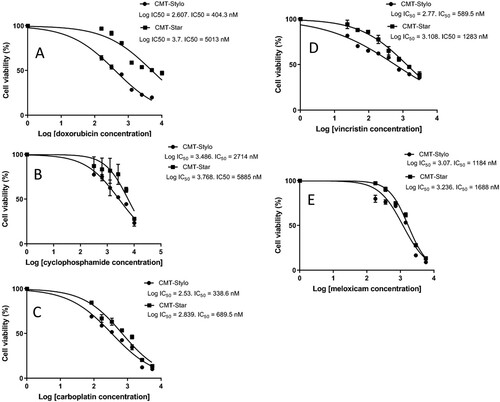
Similarly, the CMT-Star cells showed significantly increased resistance to the other cytotoxic drugs as compared to the CMT-Stylo cells: cyclophosphamide (P = 0.001) (B), carboplatin (P = 0.0003) (C), vincristine sulphate (P = 0.04) (D) and meloxicam (P = 0.002) (E) were all significantly less cytotoxic in the CMT-Star cells compared to the CMT-Stylo cells (). The IC50 of cyclophosphamide and vincristine of the CMT-Star cells were double that of the CMT-Stylo cells. This indicates that CMT-Star cells are more resistant to cytotoxic drugs, especially doxorubicin, compared to CMT-Stylo cells (the original cells).
CMT-Star cells are less proliferative than CMT-Stylo cells
The proliferation curves () show that the cell doubling time of the CMT-Stylo cells and CMT-Star cells was 23.55 ± 1.8 h and 24.4 ± 0.028 h, respectively over a period of 7 days (168 h).
Figure 3. Proliferation curves of CMT-Stylo and CMT-Star cells.
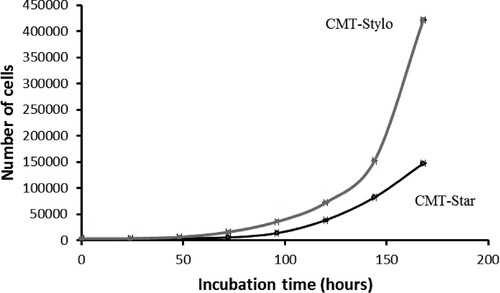
The cell doubling time curves indicates the time required for the cells to double in number. The growth curve was plotted as number of cells counted per cell line against time (h) for both cell lines.
CMT-Star cells are more resistant to apoptotic changes induced by exposure to doxorubicin
The morphological changes observed in both cell lines included membrane blebbing, nuclear fragmentation, chromatin condensation and vacuolation ().
Figure 4. Morphological changes in cells treated with doxorubicin (AO/PI double staining). Apoptosis related cellular changes observed in the cells treated with 100 nM doxorubicin include; BL (membrane blebbing), NF (Nuclear fragmentation), CC (chromatin condensation) and AP (full apoptosis). This figure is of CMT-Stylo cells at 72 h of culture in 100 nM doxorubicin.
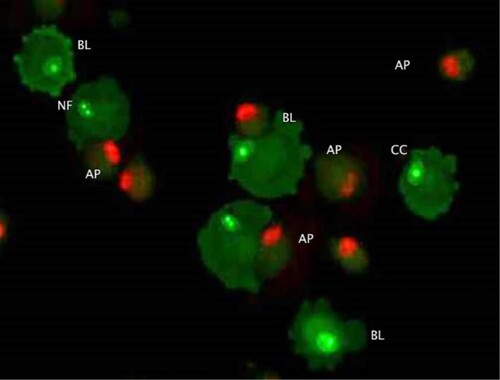
The independent t-test indicated a statistically significant difference in the proportions of CMT-Stylo and CMT-Star cells with membrane blebbing at 24 h (P = 0.0004), 48 h (P = 0.001) and 72 h (P = 0.001); more CMT-Stylo cells had membrane blebbing than CMT-Star cells. Additionally, more CMT-Stylo cells were in the late apoptotic stage at 48 h (P = 0.000007) and 72 h (P = 0.003) compared to CMT-Star cells. This further indicates the resistance of CMT-Star cells to doxorubicin compared to CMT-Stylo cells.
CMT-Star cells formed higher number of colonies compared to CMT-Stylo cells
We counted the total colonies in 15 fields from the soft agar in 6-well plates at ×100 magnification. The colonies were formed at different depths of the soft agar, and the microscope depth was adjusted continuously to view/count the colonies formed at various levels of the field. We counted a total of 118 CMT-Stylo colonies (mean, 7.87 ± 1.1 colonies per field); there were a total of 135 CMT-Star colonies (mean, 9 ± 1.6 colonies per field). The independent t-test showed that the CMT-Star cells formed significantly more colonies compared to the CMT-Stylo cells (P = 0.037).
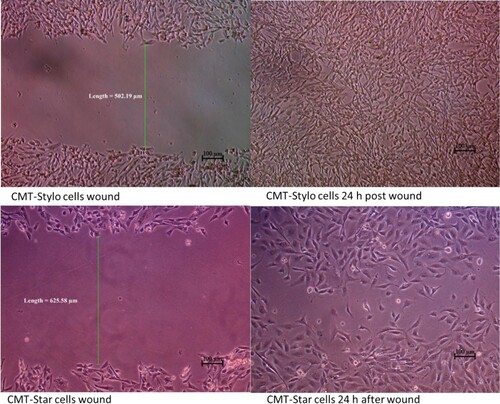
CMT-Star cells are less migratory compared to CMT-Stylo cells
The wound created in the CMT-Star cultures was 623.7 ± 11.6 µm wide; that in the CMT-Stylo cultures was 519.9 ± 17.5 µm wide. At 4.5 h, the width of the wound decreased to 526.58 ± 9.4 µm in the CMT-Star cultures and to 384.5 ± 17.8 µm in the CMT-Stylo cultures. At 7 h, the width of the wound was 423.27 ± 26.3 µm in the CMT-Star cultures and 246.79 ± 10.1 µm in the CMT-Stylo cultures. By 24 h, cells from both edges of the wounds in both cell lines had overlapped; therefore, the width could not be measured (). The mean migration rate of CMT-Star cells at 4.5 h was 16.4% ± 1.1%; that of the CMT-Stylo cells was 24.8% ± 1.7%. The mean migration rate at 7 h was 35.3% ± 4.7% in the CMT-Star cells and was 50.8% ± 2.5% in the CMT-Stylo cells. Repeated measure analysis of variance (ANOVA) revealed that the CMT-Stylo cells had significantly higher migration rates (P = 0.000015).
Figure 5. Wound induced migration assay. The wound was induced on the cells using sterile 200 µL pipette tips. The width of the wound created on CMT-Stylo cells was 502.19 µm, while that of CMT-Star cells was 625.58 µm. By 24 h, both wounds are almost completely closed up by the cells.
Both CMT-Star and CMT-Stylo cells have tumour sphere–forming cells
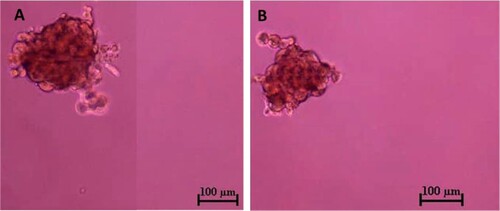
Three days after the CMT-Stylo and CMT-Star cells were incubated; spheroids were formed in the ultra-low attachment plates. After 7 days, the spheroids were dissociated into single-cell suspensions and cultured in similar conditions as before, and again formed spheroids (). The spheroids varied in size and floated in the medium independent of attachment. The average diameter of the CMT-Stylo spheroids was 226 ± 51.2 µm; that of the CMT-Star spheroids was 224.5 ± 47.5 µm. However, the independent t-test showed no significant difference in the sizes of spheres formed (P = 0.96).
Figure 6. Tumour sphere formation assay of CMT-Stylo (A) and CMT-Star (B) cells. The tumour spheres here were pictured after 7 days of incubation of respective cell lines in stem cell enrichment media, in ultralow attachment plates. The average size of the spheres formed by CMT-Stylo cells is 226 ± 51.2 µm in diameter, while that of CMT-Star cells is 224.5 ± 47.5 µm in diameter. Bar = 100 µm.
Both CMT-Star and CMT-Stylo were tumorigenic in mice models
All three non-obese diabetic/severe combined immunodeficient (NOD/SCID) mice injected with CMT-Star cells developed tumours at the injection sites, as did all three NOD/SCID mice injected with CMT-Stylo cells. shows post-mortem and tumour harvesting in one of the mice. At the earliest, the mice injected with CMT-Stylo cells developed palpable tumours at 18 days post-injection; the mice injected with CMT-Star cells developed tumours at 4 days post-injection. Two mice with CMT-Star tumours were removed from the study due to ruptured tumours resulting in significant ulceration, while the tumour of the remaining mouse remained intact up to when it reached the required size. The mean survival time of the mice injected with CMT-Stylo cells was 71.0 days (standard deviation [SD] ±3.8 days); that of the mice injected with CMT-Star cells was 58.3 days (SD ±3.5 days).
Figure 7. Post-mortem and harvesting of tumour from euthanized NOD/SCID mouse (A) Shows the mouse with tumour of about 2 cm (B) shows in-situ abdominal organs, with the tumour subcutaneously (C) Shows the harvested tumour and (D) shows the cut sections of the harvested tumour.
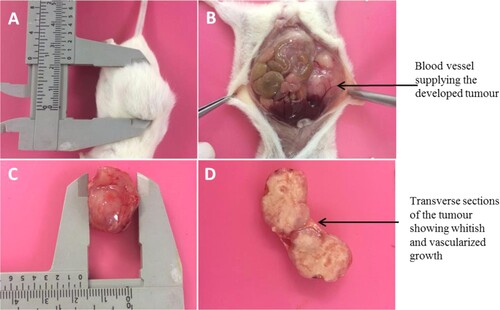
The CMT-Stylo tumours were 2.6, 2.8 and 2.8 cm in diameter, while the CMT-Star tumours were 1.9, 2 and 2.6 cm in diameter. The CMT-Stylo tumours had a larger mean size, being 2.73 cm (±0.12) in diameter as compared to the CMT-Star tumours, which were 2.17 cm (±0.38) in diameter. Four tumours (three from the mice injected with CMT-Stylo cells and one in a mouse injected with CMT-Star cells) grew beyond the targeted diameter of 2.5 cm. This occurred because measurements were made on the protruding parts of the tumours, but the tumours also grew inwardly towards the abdominal cavity, and their actual sizes were measured post-mortem. Despite the CMT-Stylo tumours being slightly larger, the independent sample t-test indicated no significant difference (P = 0.068) between the CMT-Stylo and CMT-Star tumours.
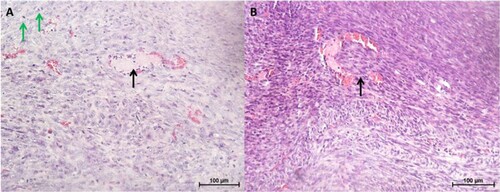
Histologically, the tumours were densely cellular and composed of a mixture of epithelial and fibroblast-like cells (). Occasionally, tubular structures and blood vessels were seen (c). Other features observed included areas of necrosis and mitotic figures (d). In one of the CMT-Stylo tumour tissues harvested, tumour cells were observed to have invaded a blood vessel (b). Further evidence of metastasis was not seen neither during the post-mortem examination nor in histopathological observation of the lung tissues. Overall, this part of the study indicates the higher invasive nature of the original CMT-Stylo cells compared to doxorubicin-resistant CMT-Star cells.
Figure 8. Histopathology of tumours and lung tissues from the mice injected with CMT-Star cells (Bar = 100 µm). Haematoxylin and eosin staining of harvested tumours. The tumours are densely cellular, with areas of connective tissue (A and C). (A) Shows a tumour tissue with the arrow pointing to angiogenesis, (B) shows lung tissue with mild congestion, (C) shows a tumour tissue with the arrow pointing to a tubular structure formed and (D) shows a tumour tissue with the arrow pointing to a mitotic figure. Bars = 100 µm.
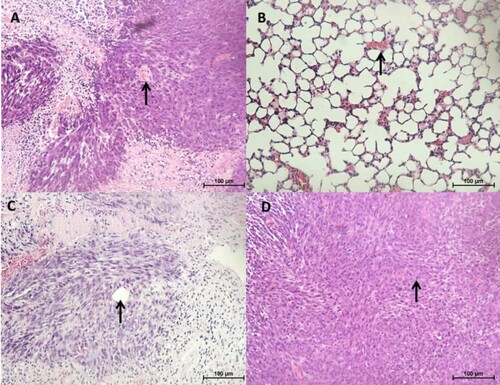
Figure 9. Histopathology of tumours and lung tissues from the mice injected with CMT-Stylo cells (Bar = 100 µm). Haematoxylin and eosin staining of harvested tumours. The tumour tissues are densely cellular. (A) Shows a tumour tissue (from a mouse injected with CMT-Stylo cells) with the arrow pointing to mitotic figures (green arrows) and a blood vessel (black arrow), (B) shows a tumour tissue with the arrow pointing at an invasion of a blood vessel by the tumour cells (from a mouse injected with CMT-Stylo cells). Bars = 100 µm.
Concentration and purity of isolated RNA
RNA was isolated from CMT-Stylo cells and CMT-Star cells resistant to 60 nM doxorubicin and from CMT-Star cells resistant to 100 nM doxorubicin. The concentration and purity of the isolated RNA from all samples was good (≥2 for 260/280 and 260/230). Accordingly, complementary DNA (cDNA) was synthesized from the RNA for quantitative real-time PCR (QPCR).
CMT-Star cells express known drug resistance genes
For the ABCB1 gene, the threshold cycle (Ct) value of the samples was 19.85–24.78 cycles. The Ct value for ABCG2 was 27.45–33.17 cycles; that for ABCC1 were 25.48–28.39 cycles. For the reference genes, the Ct value of GAPDH (glyceraldehyde-3-phosphate dehydrogenase) was 17.44–21.41 cycles among the sample; that for RPS19 (ribosomal protein S19) was 16.95–20.38 cycles. In each sample, the expression of the three drug resistance genes was normalized to the expression of the two reference genes. ABCB1 and ABCG2 gene expression was highest in the CMT-Star 100 cells (resistant to 100 nM doxorubicin), followed by that in the CMT-Star 60 cells (resistant to 60 nM doxorubicin); expression was lowest in the CMT-Stylo cells. This indicated increased expression of the two genes as the cells acquired resistance to higher concentrations of doxorubicin. However, ABCC1 gene expression was lowest in the CMT-Star 100 cells, followed by that in the CMT-Star 60 cells; expression was highest in the CMT-Stylo cells. This indicated decreased expression of the gene as the cells acquired resistance to higher concentrations of doxorubicin.
ABCB1 gene expression was significantly increased (P = 0.002) by 1.7-fold in the CMT-Star 60 cells compared to the CMT-Stylo cells. It was also significantly increased (P = 0.0005) by 3.3-fold in the CMT-Star 100 cells compared to the CMT-Stylo cells. On the other hand, ABCG2 gene expression was significantly increased (P = 0.01) by 2.2-fold in the CMT-Star 60 cells compared to the CMT-Stylo cells, and was also increased significantly (P = 0.0005) by 6.2-fold in the CMT-Star 100 cells compared to the CMT-Stylo cells. The ABCC1 gene, however, was significantly downregulated (P = 0.0005) by 4.5-fold in the CMT-Star 60 cells compared to the CMT-Stylo cells, and was also significantly downregulated (P = 0.0003) by 9-fold in the CMT-Star 100 cells compared to the CMT-Stylo cells.
Gene expression normalization and cluster analysis
A total of 43,663 entities were detected for all samples; after normalization, 43,620 entities remained for further analysis. Hierarchical clustering using GeneSpring based on all entities on the microarray after normalization revealed that the CMT-Stylo cells had a distinct gene expression profile as compared to CMT-Star cells. The gene expression profile data sets have been deposited to the Gene Expression Omnibus (GEO) repository at the National Center for Biotechnology Information (NCBI) (https://www.ncbi.nlm.nih.gov/geoprofiles/) under accession number GSE114888.
CMT-Star cells have a different gene expression profile related to doxorubicin resistance
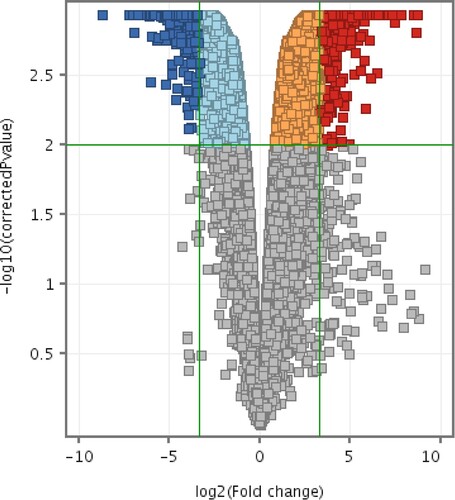
Compared to the CMT-Stylo cells, CMT-Star cells had differential expression of 1608 entities at P < 0.01 with a minimum fold change of 10. Of these, 801 entities were unknown expressed sequence tags (ESTs) and 17 were not functionally annotated for dog. Supplementary material 1 presents the 787 entities (genes) differentially expressed between the CMT-Star and CMT-Stylo cells. Supplementary material 2 presents the pathways regulated by the genes differentially expressed between the CMT-Star cells and CMT-Stylo cells. and depict the dendrograms and volcano plots, respectively, of the normalized intensity values at P < 0.01 and absolute fold change of 10 (Benjamini–Hochberg moderated t-test).
Figure 10. Hierarchical clustering of 1608 differentially expressed entities: 585 upregulated and 1023 downregulated in CMT-Star cells. The technical replicates of each sample demonstrated similar pattern of gene/entities expression by clustering together. From the figure, it is obvious that the doxorubicin-resistant CMT-Star has many of the genes/entities downregulated compared to CMT-Stylo (original cell).
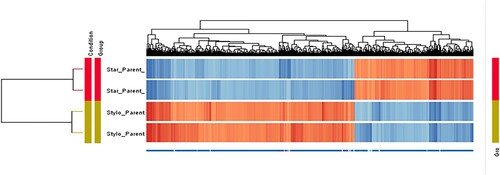
Figure 11. Volcano plots of differentially expressed entities differentially expressed between CMT-Star and CMT-Stylo cells. Entities with different expression in CMT-Star cells compared to CMT-Stylo cells at p < 0.01(y-axis) and absolute fold change of 10 (x-axis) (Benjamini Hochberg moderated t-test). Blue coloured entities are downregulated while the red coloured entities are upregulated in CMT-Star cells. The pale blue, orange and grey-coloured entities did not fall within the cut-off values set for the analysis.
CMT-Star cells have altered molecular functions, biological processes and cellular compartments related to doxorubicin resistance
The molecular functions, biological processes and cellular compartments of the differentially expressed genes between CMT-Star and CMT-Stylo cells were determined using the Database for Annotation, Visualization, and Integrated Discovery (DAVID). Supplementary material 3 summarizes the molecular functions, biological processes and cellular compartments of the upregulated and downregulated genes in CMT-Star cells as compared to the CMT-Stylo cells.
Microarray gene expression validation
Microarray showed that tenascin-C (TNC) and decorin (DCN) were downregulated in CMT-Star cells by 4.5- and 5.5-fold, respectively, compared to CMT-Stylo cells. QPCR validation showed that the two genes were downregulated in the CMT-Star cells by 1.1- and 6-fold, respectively. There were a total 475 entities following normalization of the signal intensities for each probe to the 90th percentile with baseline transformation to the median of all samples. A total of 425 entities remained for further analysis after filtering expression on normalized data with a 20th percentile lower cut-off and 100th percentile upper cut-off.
CMT-Star cells have a different miRNA expression profile related to doxorubicin resistance
The volcano plot () for the differentially expressed entities revealed a total of 14 miRNAs (with Benjamini–Hochberg false discovery rate [FDR] method) (). Eight miRNAs were upregulated in CMT-Star cells compared to CMT-Stylo cells; the remaining six miRNAs were downregulated in CMT-Star cells compared to CMT-Stylo cells.
Figure 12. Volcano plot of differentially expressed entities (microRNAs) in CMT-Star cells compared to CMT-Stylo cells. Fourteen entities (miRNAs) differentially transcribed in CMT-Star cells compared to CMT-Stylo cells (with Benjamini Hochberg FDR method) at p value of <0.05 (y-axis) and fold change cut off at 2.0 (x-axis). Blue coloured entities are downregulated while the red coloured entities are upregulated in CMT-Star cells.
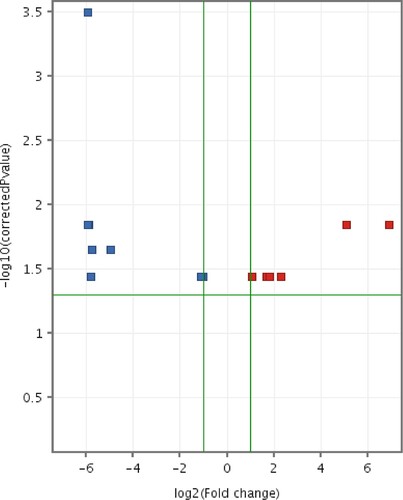
Table 2. Dysregulated microRNAs related to doxorubicin resistance in CMT-Star cells compared with CMT-Stylo cells.
Target gene (mRNA) prediction for the 14 differentially expressed miRNAs revealed 278 MIMAT accession numbers (mRNAs) that fulfilled the P-value of 0.05 (Supplementary material 4).
Supplementary material 5 shows the pathways regulated by the mRNAs targeted by the dysregulated miRNAs in CMT-Star cells.
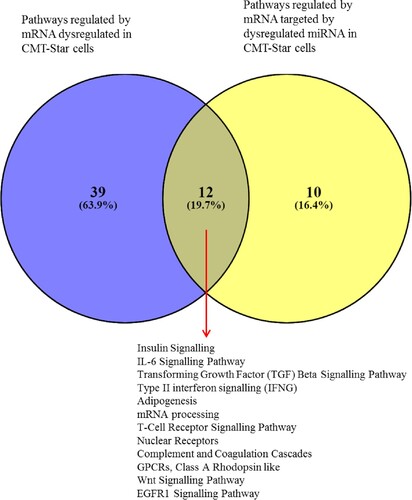
The Venn diagram of dysregulated CMT-Star cell genes from the gene expression microarray and genes targeted by dysregulated miRNAs in the same cells revealed 11 common regulated genes. Four were downregulated: CENPJ (centromere protein J), PLA2G1B (phospholipase A2, group IB), CA3 (carbonic anhydrase III) and CYBB (cytochrome b-245, beta polypeptide); seven were upregulated: PKD1 (polycystic kidney disease 1), CTSA (cathepsin A), LGALS9 (galectin 9), SGSH (N-sulfoglucosamine sulfohydrolase), ZNFX1 (zinc finger, NFX1-type containing 1), RORA (RAR-related orphan receptor A) and GBF1 (golgi brefeldin A resistant guanine nucleotide exchange factor 1). The Venn diagram also revealed that 12 common pathways were regulated by dysregulated CMT-Star cell mRNAs from the gene expression microarray and by mRNAs targeted by dysregulated CMT-Star cell miRNAs ().
Figure 13. Venn diagram of pathways regulated by mRNA and miRNA in CMT-Star cells. Twelve pathways are commonly regulated in CMT-Star cells from the gene expression microarray results and the miRNA microarray results as shown at the intercept of the Venn diagram; Insulin Signalling, IL-6 Signalling Pathway, Transforming Growth Factor (TGF) Beta Signalling Pathway, Type II interferon signalling (IFNG), Adipogenesis, mRNA processing, T-Cell Receptor Signalling Pathway, Nuclear Receptors, Complement and Coagulation Cascades, GPCRs, Class A Rhodopsin like, Wnt Signalling Pathway, EGFR1 Signalling Pathway.
Discussion
Although the pathogenesis and etiologies in the early development of mammary tumours in dogs may differ from that in humans, the dog is still a very much available model for breast cancer research with the aim of understanding the molecular basis of cancer progression and metastasis.
Here, the doxorubicin-resistant CMT-Star cell line was developed from a primary CMT-Stylo cell line that had been established from a dog with mammary gland adenocarcinoma. Compared to the parental cells, the new resistant cell line demonstrated lower cytotoxic effects and increased proliferation in the presence of up to 100 nM doxorubicin. The cell line was created by exposing CMT-Stylo cells to increasing concentrations of doxorubicin, a method adapted from a similar study on breast cancer cell lines (Tegze et al. Citation2012). This method was chosen to understand the progressive changes in gene expression by the cells to aid survival in doxorubicin-treated culture conditions.
Doxorubicin was chosen to induce resistance in the CMT-Star cells because of its common usage in canine cancers and its susceptibility to efflux by many of the known drug efflux pumps (Chekhun et al. Citation2006). Simultaneous resistance to other drugs of different classes is also due to drug efflux from the cells by the ABC genes. Increased resistance to the inducing drug as well to other drugs, as exhibited by the CMT-Star cells, also demonstrated that the cells had acquired a multi-drug–resistant phenotype following exposure to doxorubicin only.
The CMT-Star cells had a 1140% increase in the IC50 of doxorubicin (the resistance-inducing agent) and a 91% and 117.6% increase in the IC50 of vincristine and cyclophosphamide, respectively. Moreover, the IC50 of carboplatin and meloxicam in the cells were increased by 103.6% and 46.8%, respectively.
Morphologically, apoptotic changes were more pronounced in the CMT-Stylo cells compared to the CMT-Star cells following doxorubicin treatment. Other characteristics, i.e. cell doubling time, wound healing ability, anchorage-independent growth and tumour sphere–forming ability in ultra-low attachment plates, all demonstrated that the cells did not lose their cancer cell characteristics while phenotypically adapting to doxorubicin exposure. The longer cell doubling time observed in the CMT-Star cells compared to CMT-Stylo cells was recently observed in a CMT cell line following induced resistance to 5-fluorouracil (Zhou et al. Citation2017). This might be due to a higher number of stem cells with lower proliferation in the drug-resistant cells, as proposed in another report (Zhou et al. Citation2018). Additionally, CMT-Star cells had lower migration rates compared to CMT-Stylo cells, which could be attributed to the expected higher number of cancer stem cells (CSCs) in the cell population compared to that in CMT-Stylo cells, and might render the cells less invasive (Mohammadi-Yeganeh et al. Citation2016).
Here, we identified statistically significant increased expression of the ABCB1 and ABCG2 genes in CMT-Star cells compared to CMT-Stylo cells. Expression of the ABCs is well investigated, and several studies have documented them as one of the factors that confer multi-drug resistance in cancer cells (Gottesman et al. Citation2002; Martin et al. Citation2014; Moitra Citation2015). The multi-drug resistance observed in the CMT-Star cells was due to the expression of the ABCB1 and ABCG2 genes. The expression of these two known drug resistance genes in the CMT-Star cells renders the cells valuable for further studies aimed at identifying new molecular targets in dogs with drug-resistant CMT and for screening new therapeutic agents.
Contrary to the progressive increase in ABCB1 and ABCG2 gene expression in CMT-Star cells relative to CMT-Stylo cells in the present study, ABCC1 (MRP1) expression was progressively downregulated in CMT-Star cells compared to CMT-Stylo cells. The inherent expression of drug efflux pumps has been reported in many cancers, including CMT (Honscha et al. Citation2009). Here, the interesting finding was the progressive downregulation of ABCC1 with increasing drug resistance in the cancer cells, indicating the possible involvement of another regulatory mechanism that could be exploited for controlling the drug-resistant phenotype in these cancer cells.
Both CMT-Star and CMT-Stylo cells formed tumours in all three NOD/SCID mice injected per cell line, indicating the presence of tumorigenic (tumour-initiating) cancer cells in both cell populations. Other studies have used other immunodeficient mouse models such as nude mice (Ferletta et al. Citation2011), BALB/SCID mice (Caceres et al. Citation2015) and NOD/Shi-scid IL2Rgnull mice (Michishita et al. Citation2012) to characterize CMT cell lines in vivo. Here, up to about 10 million cells were used to induce tumours in the mice. A study on MDA-MB-435 breast cancer cells injected up to 15 million cells subcutaneously into the flanks of mice to induce tumours (Shen et al. Citation2008). By contrast, as few as 1000 CMT cells with a stem cell–like phenotype (CD44+) resulted in tumour development following injection into mice (Cocola et al. Citation2009).
The CMT-Star tumours became palpable at 4 days post-injection, while the CMT-Stylo tumours were palpable by day 14. That the CMT-Star tumours were palpable earlier might have been due to the suspected higher number of stem cells among the CMT-Star cells compared to CMT-Stylo cells.
Although the tumours formed by the CMT-Star cells were relatively smaller compared to the CMT-Stylo tumours, two-thirds of them ruptured, resulting in early removal of the affected mice from the study. A similar finding was reported in a study of MDA-MB-231 human breast cancer cells, where a tamoxifen-resistant cell line demonstrated a more aggressive phenotype (larger size, higher mitotic index, hemorrhages, necrosis) in athymic mice (Sipila et al. Citation1993). Here, the rupturing of the CMT-Star tumours influenced the survival time of the mice, with overall fewer survival days compared to that of the mice with CMT-Stylo tumours. The developed tumours were restricted to 2.5 cm in diameter, and apparently sick (recumbent/labored breathing) mice, or mice with ruptured tumour were removed from the study to prevent overburdening the mice with unnecessary pain and suffering (National Research Council Citation2011; Barbieri et al. Citation2015; Bogachek et al. Citation2015).
Mice injected with CMT-Stylo cells developed slightly larger tumours relative to that of the mice injected with CMT-Star cells, although this was not statistically significant. One of the tumour tissues also demonstrated blood vessel invasion by the neoplastic cells, which indicated the potential for distant metastasis. The NOD/SCID mice part of the study spanned 77 days post-injection. However, similar studies on CMT have lasted between 30 and 161 days (Ferletta et al. Citation2011; Barbieri et al. Citation2015; Caceres et al. Citation2015) and have reported metastasis (lung and lymph nodes) by 30 days after mammary fat pad tumour induction in 10 of 10 mice (Caceres et al. Citation2015).
The microarray findings for the dysregulated genes were validated using QPCR on four selected genes. Both microarray and QPCR validated DCN and TNC as having a similar expression pattern in the tested samples. This indicates the reliability of the microarray results, which identified changes in the expression of thousands of genes between the samples.
The TGFBR3 (transforming growth factor beta receptor 3) gene was significantly overexpressed in CMT-Star cells. This transmembrane receptor was upregulated by 6.9-fold in the CMT-Star cells. Overexpression of other TGFβR (TGFβR1 and TGFβR2) has been reported in CSC-like cells of CMT, where expression was associated with maintaining the drug-resistant phenotype (Rybicka et al. Citation2015). Repeated exposure to doxorubicin could have triggered the TGFBR3 overexpression in the CMT-Star cells, which might also be involved in doxorubicin resistance as reported for other TGFβR.
FGF receptor 3 (FGFR3), a transmembrane receptor, was overexpressed by 5.3-fold in CMT-Star cells. FGFR3 expression has not been reported in CMT or any other canine cancer. Together with other members of the FGFR group, this tyrosine kinase receptor has been established as an oncogene in human cancers (Marech et al. Citation2014; Brameld et al. Citation2017), including breast cancer (Sharpe et al. Citation2011), and could be targeted for therapy using a tyrosine kinase inhibitor approved by the Food and Drug Administration (FDA) for use in dogs with cancers (Marech et al. Citation2014): masitinib mesylate (AB1010). FGFR3 could be involved in CMT-Star cell proliferation during doxorubicin exposure, and targeting it may help prevent tumour cell proliferation in dogs with CMT.
Nuclear receptor subfamily 4, group A, member 2 (NR4A2) was upregulated by 5-fold in CMT-Star cells compared to CMT-Stylo cells. NR4A2 is associated with the maintenance of quiescence in stem cells (Hou et al. Citation2015). Furthermore, the loss of NR4A2 expression in stem cells results in the loss of stemness and initiation of the cell cycle of hematopoietic stem cells. The exposure of CMT-Star cells to doxorubicin and their subsequent acquisition of resistance may have also resulted in the upregulation of NR4A2, hence the increased stem cells in the population (Zhou et al. Citation2018).
Frizzled-related protein (FRZB) was upregulated by 6-fold in CMT-Star cells compared to CMT-Stylo cells. In dogs, FRZB is overexpressed in CMT cells compared with normal mammary gland cells (Lee et al. Citation2003, Citation2006). FRZB has been associated with resistance to ultraviolet (UV)-induced apoptosis in CMT cells via nuclear factor kappa B (NF-κB) activation (Lee et al. Citation2003). As reported earlier, CMT-Star cells were significantly more resistant to drug-induced apoptotic changes compared to CMT-Stylo cells. This is due to their drug-resistant phenotype as a result of expressing genes that inhibit cell apoptotic changes. A significantly smaller proportion of CMT-Star cells exhibited the early apoptotic sign of membrane blebbing as well as late apoptosis. FRZB expression in CMT-Star cells could be a mechanism of apoptosis resistance in the cells (Lee et al. Citation2003).
ALDH 3 family member A1 (ALDH3A1) was upregulated by 4.6-fold in the CMT-Star cells. ALDH expression is associated with the stem cell phenotype in many cancer types, including CMT (Michishita et al. Citation2012). The CSC phenotype has been associated with drug resistance in cancer cells (Barbieri et al. Citation2015), which could explain why ALDH was upregulated in the drug-resistant CMT-Star cells compared to CMT-Stylo cells. Moreover, the multi-drug resistance gene (ABCB1/MDR1) was significantly upregulated by 4.37-fold in the CMT-Star cells compared to CMT-Stylo cells. Taken together, the ALDH and ABCB1 upregulation in the CMT-Star cells reflects their resistance to multiple chemotherapeutic agents, as well as their having a higher number of cells with the stem cell phenotype. This renders CMT-Star cells highly valuable in the search for new therapeutic targets and for screening new therapeutic agents for improved anti-cancer therapy.
In the CMT-Star cells, myosin light chain kinase (MYLK) was downregulated by 8.7-fold as compared with CMT-Stylo cells. MYLK expression in Madin-Darby canine kidney (MDCK) cells has been correlated positively with increased invasion by the MDCK cells (Balasubramaniam et al. Citation2015). The MYLK downregulation in the CMT-Star cells could be linked to their less invasive nature compared to the CMT-Stylo. The more invasive nature of the CMT-Stylo cells was highlighted by the higher migration rates and their ability to invade blood vessels in the resulting tumour (haematoxylin and eosin–stained tissues) after the NOD/SCID mice had been injected with CMT-Stylo cells, a feature not observed in the CMT-Star cells.
Tissue factor pathway inhibitor 2 (TFPI2) was downregulated 7.4-fold in the CMT-Star cells compared with the CMT-Stylo cells. Due to its inhibitory effect on tissue invasion in hepatocellular carcinoma cells, TFPI2 is a tumour-suppressor gene (Zhu et al. Citation2013) and is downregulated in canine diffuse large B-cell lymphoma (Ferraresso et al. Citation2014) due to hypermethylation of its promoter, which the authors suggested could be considered in the future as a prognostic marker in dogs with diffuse large B-cell lymphoma. TFPI2 downregulation could be involved in the shorter latency period for tumour induction in vivo of the CMT-Star cells as compared to CMT-Stylo cells.
The serine protease plasminogen (PLG) and its activator, plasminogen activator, urokinase (PLAU), were both downregulated in CMT-Star cells by 6.9- and 4.7-fold, respectively, as compared to CMT-Stylo cells. Activated PLG (plasmin) activates collagenases that in turn degrade collagen (Hurst et al. Citation2012), an early step in the tissue invasion and initiation of metastasis by cancer cells. Immunohistochemical expression of PLAU in malignant CMT tissues has been associated with higher proliferation, histologic grade, lymph node metastasis and distant metastasis, as well as lower overall 2-year survival in dogs (Santos et al. Citation2011). The PLG and PLAU downregulation in CMT-Star cells as compared to CMT-Stylo cells might explain how the CMT-Star cells were less invasive than CMT-Stylo cells.
DCN and kallikrein 1 (KLK1) were downregulated in CMT-Star cells by 5.5- and 5.2-fold respectively, compared to the CMT-Stylo cells. As models of EMT, MDCK cells have both DCN and KLK1 upregulation, which has been linked to tissue invasion by the cells (Mathias et al. Citation2010). The DCN and KLK1 downregulation in the CMT-Star cells could be involved in decreasing the cell invasive capability. Several other genes downregulated in the CMT-Star cells are involved in extracellular matrix remodeling for enhanced tissue invasion and the initiation of metastasis to distant sites.
The cytoplasmic ribosomal protein pathway was the most downregulated pathway in the CMT-Star cells. It was represented by up to 30% of its known genes in these cells. This pathway is responsible for translating the mRNA transcribed in cells into proteins to be utilized for cell survival and function. The more proliferative and invasive nature of the CMT-Stylo cells means they have a higher need for protein synthesis compared to the drug-resistant CMT-Star cells. The EGF receptor 1 (EGFR1) signalling and Wnt signalling pathways, involved in the cell cycle and cell proliferation, were dysregulated in the CMT-Star cells compared to CMT-Stylo cells. These pathways and their known associated genes are crucial in oncogenesis and progression in canine cancers (Lee et al. Citation2003; Selvarajah et al. Citation2009; Rybicka et al. Citation2016; Hocker et al. Citation2017). Another regulated pathway in CMT-Star cells involved in cell cycle signalling was G1–S cell cycle control, a checkpoint that can determine whether the cell proceeds to the next stage of the cell cycle, ensuring cell proliferation (Tanaka and Iino Citation2014). The TGF-β and TGFβR signalling pathways were also enriched in the CMT-Star cells compared to CMT-Stylo cells. TGF-β signalling has been implicated in drug resistance in human breast cancer cells (Bhola et al. Citation2013). Inhibiting the signalling pathway results in increased susceptibility of triple-negative breast cancer cell lines to paclitaxel. The CMT-Star cells were resistant to 100 nM doxorubicin, and both the TGF-β and TGFβR signalling pathways were enriched in this cell line. It is therefore safe to say that the signalling of these pathways in the CMT-Star cells is involved in their doxorubicin resistance. The two pathways represent potential therapeutic targets requiring further research for confirmation.
Overall, the pathways regulated by the genes dysregulated in CMT-Star cells are involved in apoptosis, drug resistance, cell proliferation, extracellular matrix remodeling and tissue invasion. Identifying the key players in these dysregulated pathways using knock-out, knock-in and RNA interference (RNAi) is crucial for therapeutic targeting in cancer cells. The potential redundancy in many molecular pathway components in oncogenesis and tumour progression makes gene expression profiling the best approach for identifying therapeutic targets (including novel targets) for personalized therapy in dogs with mammary cancer as well as other cancers. This approach is more critical when the cancer cells have acquired resistance to one or more chemotherapeutic agents following exposure, which will render the identification and targeting of the dysregulated pathways and molecular targets the only viable option for the dog.
The upregulated genes in the CMT-Star cells compared to CMT-Stylo cells, as deduced from gene ontology, are mostly involved in intracellular and extracellular transport, decreased cell proliferation and growth and stem cell differentiation and protein transport activity. The upregulation of these functions and processes in CMT-Star cells is involved in how the cells expel drugs, and also suggests that the cells might have higher proportions of CSCs compared to CMT-Stylo cells. The downregulated genes, however, are mainly involved in increased transcription, protein synthesis and cell division. This is indicated in the higher proliferation rate of the CMT-Stylo cells as compared to the CMT-Star cells.
Seven characterized miRNAs were upregulated in CMT-Star cells compared to CMT-Stylo cells. miRNA-210 was upregulated by 6-fold in CMT-Star cells compared to CMT-Stylo cells. miRNA-210 was overexpressed in the plasma of patients with trastuzumab-resistant breast cancer (Jung et al. Citation2012). miRNA-210 transcription also correlated with tumour development. Another review highlighted the pathways regulated by miRNA-210 mainly through hypoxia-inducible factor (HIF), which included the pathways related to the cell cycle, apoptosis, angiogenesis and tumour growth (Huang et al. Citation2010). The upregulation of miRNA-210 in CMT-Star cells compared to CMT-Stylo cells supports the drug-resistant phenotype of CMT-Star cells and their shorter latency period, as compared to CMT-Stylo cells, to tumour formation in mice. It also supports the differences in cell cycle, tumour growth and resistance to apoptosis.
MiRNA-93 was upregulated by 5.9-fold in CMT-Star cells compared to CMT-Stylo cells. In a previous study using human breast cancer cells (Liu et al. Citation2012) associated miRNA-93 with increased tumorigenicity in mouse models by increasing the number of CSCs in luminal breast cancer cell lines such as MCF7 and MDA-MB-453. This upregulation in CMT-Star cells may be involved in increasing the number of CSCs and possibly the tumorigenic ability, as demonstrated in another study involving CMT cells in vitro (Zhou et al. Citation2018).
MiRNA-874 was upregulated by 5.9-fold in CMT-Star cells compared to CMT-Stylo cells. miRNA-874 is involved in regulating cell proliferation in pancreatic cancer, as its ectopic transcription results in decreased cancer cell proliferation (Huang et al. Citation2017). The upregulation of miRNA-874 in the CMT-Star cells might be involved in enhancing their proliferation despite their overall decrease in proliferation as compared to CMT-Star cells.
Similarly, miRNA-99b was upregulated by 5.8-fold in CMT-Star cells compared to CMT-Stylo cells, a feature described as inhibitory to cell proliferation and migration in colorectal carcinoma cells (Li et al. Citation2015) and cervical cancer cells in vitro (Wang et al. Citation2014). This could explain the lower CMT-Star cell proliferation as compared to CMT-Stylo cells.
MiRNA-107 was upregulated by 5-fold in CMT-Star cells compared to CMT-Stylo cells. miRNA-107 upregulation in colorectal cancer was associated with sensitivity to chemotherapeutic agents and to cancer cell proliferation (Molina-Pinelo et al. Citation2014). The upregulation of miRNA-107 in CMT-Star cells could be related to their doxorubicin resistance and lower proliferation rate as compared to CMT-Stylo cells. Modulating the transcription of miRNAs such as miRNA-107 in drug-resistant cancer cells would facilitate the identification of novel therapeutic targets in such cancers.
Five characterized miRNAs were downregulated in CMT-Star cells compared to CMT-Stylo cells. miRNA-106a was downregulated by 5-fold in CMT-Star cells compared to CMT-Stylo cells. miRNA-106a upregulation has been associated with oncogenesis in prostate, colon, lung cancer (Volinia et al. Citation2006) and melanoma (Rahman et al. Citation2019). Moreover, a study on ovarian cancer correlated increased miRNA-106a transcription with increased cell proliferation rate and increased number of ovarian CSCs (Liu et al. Citation2013). Decreased cell proliferation in drug-resistant cancer cells has been reported (Qiu et al. Citation2015). It is possible that the downregulation of miRNA-106a in CMT-Star cells decreases cell proliferation, maintaining their quiescent nature.
MiRNA-92a was downregulated by 2.2-fold in CMT-Star cells compared to CMT-Stylo cells. miRNA-92a enhances gastric cancer cell proliferation (Wu et al. Citation2013). The decreased miRNA-92a transcription in the CMT-Star cells might also be involved in decreasing their proliferation.
The Venn diagram comparing the dysregulated CMT-Star cell genes from the gene expression microarray with genes targeted by dysregulated miRNAs in the same cells revealed 11 common genes. The downregulated genes in CMT-Star cells were PLA2G1B, associated with enhanced tumour invasiveness (Gorovetz et al. Citation2008); CYBB (chronic granulomatous disease), involved in immune system modulation (Sanders et al. Citation2010); CA3, where expression has been linked to hypoxic conditions in canine oral malignancies (Meier et al. Citation2016) and pH regulation in the tumour microenvironment (Oosterwijk and Gillies Citation2014); and CENPJ, involved in centromere formation in cells (Kleylein-Sohn et al. Citation2007). It is possible that the downregulation of these genes in CMT-Star cells is involved in decreased tissue invasion compared to CMT-Stylo cells, while their upregulation in CMT-Stylo cells may enhance cell invasion and survival in hypoxic and unfavourable conditions, and higher invasive potential, as demonstrated in the wound-induced migration assay.
The upregulated genes in CMT-Star cells were RORA, involved in tumour microenvironment modifications; its downregulation in breast cancer confers poor prognosis (Sulakhe and Lautt Citation1987); LGALS9 negatively regulates tumour invasion and metastasis in breast cancer cells (Yamauchi et al. Citation2006). The upregulation of these genes in CMT-Star cells could be related to decreased tissue invasion in CMT-Star cells compared to CMT-Stylo cells.
GBF1 inhibits oncolytic adenovirus killing of melanoma cancer cells in vitro, and its knockdown enhanced the virus killing of melanoma cells (Prasad et al. Citation2014). SGSH is highly secreted in the exosomes of colorectal CSCs and is associated with intrinsic drug resistance of the CSCs (Emmink et al. Citation2013). The upregulation of these two genes in CMT-Star cells indicates their possible involvement in enhanced drug resistance and survival.
MiRNA regulation of the transcription of these genes between the CMT-Star and CMT-Stylo cells aids the acquisition and maintenance of their respective phenotypes. Overall, these genes are involved in drug resistance and lower susceptibility to drug-induced apoptotic changes. Other differences between the CMT-Stylo and CMT-Star cells due to the differentially expressed miRNAs are modifications of the tumour microenvironment, tissue invasion and metastasis, which were more enhanced in the CMT-Stylo cells, evidenced by higher migration rates and ability to invade blood vessels in vivo compared to CMT-Star cells.
The common pathways regulated by mRNAs dysregulated in CMT-Star cells and mRNAs targeted by dysregulated miRNAs in CMT-Star cells include insulin signalling; IL6 signalling; TGF-β signalling; interferon gamma (IFNG) signalling; adipogenesis; mRNA processing; T-cell receptor signalling; nuclear receptors; complement and coagulation cascades; G protein–coupled receptors (GPCRs), Class A rhodopsin-like; Wnt signalling and EGFR1 signalling. Several studies have also reported that these pathways and their known associated genes are highly crucial in oncogenesis and progression in canine cancers (Lee et al. Citation2003; Selvarajah et al. Citation2009; Rybicka et al. Citation2016; Hocker et al. Citation2017). The regulation of these genes and pathways might indicate a higher proportion of CSCs in CMT-Star cells compared to CMT-Stylo cells, which should be confirmed for further research.
The present study identified some uncharacterized miRNAs as differentially expressed: miRNA-8815 and miRNA-8816. Their dysregulation between the CMT-Star and CMT-Stylo cells indicates their potential roles in cancer biology and drug resistance in cancer cells. The main difference between the CMT-Star and CMT-Stylo cells is that CMT-Star cells are drug-resistant and low-proliferation compared to CMT-Stylo cells, and possibly have a higher proportion of cells with the CSC phenotype. The differentially expressed uncharacterized miRNAs could be associated with some of these highlighted cell characteristics. Further research is required to identify the specific and novel roles these miRNAs may play in cancer biology and drug resistance in cancers.
Conclusions
We developed a doxorubicin-resistant cell line from the primary canine mammary gland adenocarcinoma cell line CMT-Stylo, and named it CMT-Star. The putative drug transporter genes involved in chemotherapeutic resistance, i.e. ABCB1 and ABCG2, were highly expressed in CMT-Star cells compared to CMT-Stylo cells, and were involved in the doxorubicin resistance of the CMT-Star cells. With their multidrug-resistant phenotype, CMT-Star cells could be used to identify therapeutically targetable changes in drug resistant CMT cells, as well as the screening of new potential therapeutic agents in dogs with multidrug resistant CMT. Dysregulated signalling of genes and pathways such as that for IL6, TGF-β and TGFβR as well as Wnt in the drug-resistant CMT-Star cells was also identified. Further research is required to fully understand the specific roles and functions of selected genes in the oncogenesis, progression and drug resistance in canine mammary gland adenocarcinoma cells for possible identification of potential therapeutic targets in dogs with mammary gland tumours. The miRNAs in the drug-resistant CMT-Star cells aid their maintenance of the drug-resistant phenotype by regulating signalling pathways such as that for TGFβR, Wnt, nuclear receptors and IL6. The present study also identified miRNAs that have not been characterized in cancer that require further studies to establish their relevance to cancer cell biology. As a single miRNA can have multiple target genes and multiple miRNAs can regulate the expression of a single gene, there is a great need for further research to determine the significance of the selected miRNAs that were dysregulated in the drug-resistant CMT cells (i.e. miRNA-210, miRNA-93 and miRNA-106a). This will help establish their individual roles and potentiality as molecular markers or therapeutic targets in dogs with CMT.
TAAR_2032719_Supplementarymaterial
Download (184 KB)Acknowledgment
The authors are thankful to the Faculty of Veterinary Medicine laboratory staffs who assisted in the various procedures for this research (Post-Mortem, Virology, Clinical, Serology, Pharmacology, Biochemistry). A special appreciation is extended to Prof. Dr. Norjahan Banu Mohamed Alitheen for her kind support with flow cytometry assays, Miss Jovene for the technical support in gene expression studies and Dr Mazlina Mazlan for mice dissection assistance.
Disclosure statement
No potential conflict of interest was reported by the author(s).
Additional information
Funding
Related Research Data
References
- Abu N, Akhtar MN, Yeap SK, Lim KL, Ho WY, Zulfadli AJ, Omar AR, Sulaiman MR, Abdullah MP, Alitheen NB. 2014. Flavokawain A Induces apoptosis in MCF-7 and MDA-MB231 and inhibits the metastatic process in vitro. PLoS One. 9(10):e105244.
- Ambros V. 1989. A hierarchy of regulatory genes controls a larva-to-adult developmental switch in C. elegans. Cell. 57(1):49–57. http://www.sciencedirect.com/science/article/pii/0092867489901712.
- Argast GM, Krueger JS, Thomson S, Sujka-Kwok I, Carey K, Silva S, O’Connor M, Mercado P, Mulford IJ, David Young G, et al. 2011. Inducible expression of TGFβ, Snail and Zeb1 recapitulates EMT in vitro and in vivo in a NSCLC model. Clin Exp Metastasis. 28(7):593–614. http://www.ncbi.nlm.nih.gov/pubmed/21643654.
- Balasubramaniam SL, Gopalakrishnapillai A, Gangadharan V, Duncan RL, Barwe SP. 2015. Sodium-calcium exchanger 1 regulates epithelial cell migration via calcium-dependent extracellular signal-regulated kinase signaling. J Biol Chem. 290(20):12463–12473. http://www.ncbi.nlm.nih.gov/pubmed/25770213.
- Barbieri F, Thellung S, Ratto A, Carra E, Marini V, Fucile C, Bajetto A, Pattarozzi A, Würth R, Gatti M, et al. 2015. In vitro and in vivo antiproliferative activity of metformin on stem-like cells isolated from spontaneous canine mammary carcinomas: translational implications for human tumors. BMC Cancer. 15(1):228.
- Bartel DP. 2009. MicroRNAs: target recognition and regulatory functions. Cell. 136(2):215–233. http://www.pubmedcentral.nih.gov/articlerender.fcgi?artid=3794896&tool=pmcentrez&rendertype=abstract.
- Bhola NE, Balko JM, Dugger TC, Kuba MG, Sánchez V, Sanders M, Stanford J, Cook RS, Arteaga CL. 2013. TGF-β inhibition enhances chemotherapy action against triple-negative breast cancer. J Clin Invest. 123(3):1348–1358. http://www.pubmedcentral.nih.gov/articlerender.fcgi?artid=3582135&tool=pmcentrez&rendertype=abstract.
- Bogachek MV, Park JM, De Andrade JP, Kulak MV, White JR, Wu T, Spanheimer PM, Bair TB, Olivier AK, Weigel RJ. 2015. A novel animal model for locally advanced breast cancer. Ann Surg Oncol. 22(3):866–873. http://www.ncbi.nlm.nih.gov/pubmed/25326397.
- Brameld KA, Owens TD, Verner E, Venetsanakos E, Bradshaw JM, Phan VT, Tam D, Leung K, Shu J, LaStant J, et al. 2017. Discovery of the irreversible covalent FGFR inhibitor 8-(3-(4-acryloylpiperazin-1-yl)propyl)-6-(2,6-dichloro-3,5-dimethoxyphenyl)-2-(methylamino)pyrido[2,3- d ]pyrimidin-7(8 H)-one (PRN1371) for the treatment of solid tumors. J Med Chem. 60(15):6516–6527. http://www.ncbi.nlm.nih.gov/pubmed/28665128.
- Caceres S, Peña L, de Andres PJ, Illera MJ, Lopez MS, Woodward WA, Reuben JM, Illera JC, Samant R. 2015. Establishment and characterization of a new cell line of canine inflammatory mammary cancer: IPC-366. PLoS One. 10(3):e0122277. http://dx.plos.org/10.1371/journal.pone.0122277.
- Chekhun VF, Kulik GI, Yurchenko OV, Tryndyak VP, Todor IN, Luniv LS, Tregubova NA, Pryzimirska TV, Montgomery B, Rusetskaya NV, Pogribny IP. 2006. Role of DNA hypomethylation in the development of the resistance to doxorubicin in human MCF-7 breast adenocarcinoma cells. Cancer Lett. 231(1):87–93. http://www.sciencedirect.com/science/article/pii/S0304383505001126.
- Chen Y-C, Ingram PN, Fouladdel S, McDermott SP, Azizi E, Wicha MS, Yoon E. 2016. High-throughput single-cell derived sphere formation for cancer stem-like cell identification and analysis. Sci Reports. 6(1):1–12. https://www.nature.com/articles/srep27301.
- Chhipa RR, Singh S, Surve S V, Vijayakumar MV, Bhat MK. 2005. Doxycycline potentiates antitumor effect of cyclophosphamide in mice. Toxicol Appl Pharmacol. 202(3):268–277. http://www.ncbi.nlm.nih.gov/pubmed/15667832.
- Clements DN, Carter SD, Innes JF, Ollier WER, Day PJR. 2006. Analysis of normal and osteoarthritic canine cartilage mRNA expression by quantitative polymerase chain reaction. Arthritis Res Ther. 8(6):R158. http://www.ncbi.nlm.nih.gov/pubmed/17032449.
- Cocola C, Anastasi P, Astigiano S, Piscitelli E, Pelucchi P, Vilardo L, Bertoli G, Beccaglia M, Veronesi MC, Sanzone S, et al. 2009. Isolation of canine mammary cells with stem cell properties and tumour-initiating potential. Reprod Domest Anim. 44(Suppl 2):214–217. http://www.ncbi.nlm.nih.gov/pubmed/19754572.
- Cullen JM, Matthew B. 2002. An overview of cancer pathogenesis, diagnosis and management. In: Meuten DJ, editor. Tumors in domestic animals. Blackwell Publishing Company, Ames, Iowa State Press; p. 3–45.
- Emmink BL, Verheem A, Van Houdt WJ, Steller EJA, Govaert KM, Pham TV, Piersma SR, Borel Rinkes IHM, Jimenez CR, Kranenburg O. 2013. The secretome of colon cancer stem cells contains drug-metabolizing enzymes. J Proteomics. 91:84–96. http://linkinghub.elsevier.com/retrieve/pii/S1874391913003734.
- Ferletta M, Grawé J, Hellmén E. 2011. Canine mammary tumors contain cancer stem-like cells and form spheroids with an embryonic stem cell signature. Int J Dev Biol. 55(7–9):791–799. http://www.ijdb.ehu.es/web/descarga/paper/113363mf.
- Ferraresso S, Bresolin S, Aricò A, Comazzi S, Gelain ME, Riondato F, Bargelloni L, Marconato L, Kronnie GT, Aresu L, Mills K. 2014. Epigenetic silencing of TFPI-2 in canine diffuse large B-cell lymphoma. PLoS One. 9(4):e92707. http://www.ncbi.nlm.nih.gov/pubmed/24695110.
- Fish EJ, Martinez-Romero EG, DeInnocentes P, Koehler JW, Prasad N, Smith AN, Bird RC. 2020. Circulating microRNA as biomarkers of canine mammary carcinoma in dogs. J Vet Intern Med. 34(3):1282–1290.
- Foong JN, Selvarajah GT, Rasedee A, Rahman HS, How CW, Beh CY, Teo GY, Ku CL. 2018. Zerumbone-loaded nanostructured lipid carrier induces apoptosis of canine mammary adenocarcinoma cells. Biomed Res Int. 2018:1–18.
- Gartzke D, Delzer J, Laplanche L, Uchida Y, Hoshi Y, Tachikawa M, Terasaki T, Sydor J, Fricker G. 2015. Genomic knockout of endogenous canine P-glycoprotein in wild-type, human P-glycoprotein and human BCRP transfected MDCKII cell lines by zinc finger nucleases. Pharm Res. 32(6):2060–2071. http://www.ncbi.nlm.nih.gov/pubmed/25522789.
- Goldschmidt M, Peña L, Rasotto R, Zappulli V. 2011. Classification and grading of canine mammary tumors. Vet Pathol. 48(1):117–131. http://www.ncbi.nlm.nih.gov/pubmed/21266722.
- Gorovetz M, Schwob O, Krimsky M, Yedgar S, Reich R. 2008. MMP production in human fibrosarcoma cells and their invasiveness are regulated by group IB secretory phospholipase A2 receptor-mediated activation of cytosolic phospholipase A2. Front Biosci. 13:1917–1925. http://www.ncbi.nlm.nih.gov/pubmed/17981679.
- Gottesman MM. 2002. Mechanisms of cancer drug resistance. Annu Rev Med. 53:615–627. http://www.annualreviews.org/doi/abs/10.1146/annurev.med.53.082901.103929?journalCode=med.
- Gottesman MM, Fojo T, Bates SE. 2002. Multidrug resistance in cancer: role of ATP-dependent transporters. Nat Rev Cancer. 2(1):48–58. doi:10.1038/nrc706.
- Hocker SE, Higginbotham ML, Schermerhorn T, Henningson J. 2017. Receptor tyrosine kinase expression and phosphorylation in canine nasal carcinoma. Res Vet Sci. 115:484–489. http://linkinghub.elsevier.com/retrieve/pii/S0034528817303880.
- Honscha KU, Schirmer A, Reischauer A, Schoon H-A, Einspanier A, Gäbel G. 2009. Expression of ABC-transport proteins in canine mammary cancer: consequences for chemotherapy. Reprod Domest Anim. 44(Suppl 2):218–223. http://www.ncbi.nlm.nih.gov/pubmed/19754573.
- Hou Y, Li W, Sheng Y, Li L, Huang Y, Zhang Z, Zhu T, Peace D, Quigley JG, Wu W, et al. 2015. The transcription factor Foxm1 is essential for the quiescence and maintenance of hematopoietic stem cells. Nat Immunol. 16(8):810–818. http://www.ncbi.nlm.nih.gov/pubmed/26147687.
- Huang X, Huang L, Shao M. 2017. Aquaporin 3 facilitates tumor growth in pancreatic cancer by modulating mTOR signaling. Biochem Biophys Res Commun. 486(4):1097–1102. https://linkinghub.elsevier.com/retrieve/pii/S0006291X17306551.
- Huang X, Le Q-T, Giaccia AJ. 2010. MiR-210 – micromanager of the hypoxia pathway. Trends Mol Med. 16(5):230–237. http://linkinghub.elsevier.com/retrieve/pii/S147149141000047X.
- Hurst NJ, Najy AJ, Ustach C V, Movilla L, Kim H-RC. 2012. Platelet-derived growth factor-C (PDGF-C) activation by serine proteases: implications for breast cancer progression. Biochem J. 441(3):909–918. http://www.ncbi.nlm.nih.gov/pubmed/22035541%5Cnhttp://www.pubmedcentral.nih.gov/articlerender.fcgi?artid=PMC3342761.
- Jansson MD, Lund AH. 2012. MicroRNA and cancer. Mol Oncol. 6(6):590–610. http://www.ncbi.nlm.nih.gov/pubmed/23102669.
- Jung E-J, Santarpia L, Kim J, Esteva FJ, Moretti E, Buzdar AU, Di Leo A, Le X-F, Bast RC, Park S-T, et al. 2012. Plasma microRNA 210 levels correlate with sensitivity to trastuzumab and tumor presence in breast cancer patients. Cancer. 118(10):2603–2614. doi:10.1002/cncr.26565.
- Kim B, Stephen SL, Hanby AM, Horgan K, Perry SL, Richardson J, Roundhill EA, Valleley EMA, Verghese ET, Williams BJ, et al. 2015. Chemotherapy induces Notch1-dependent MRP1 up-regulation, inhibition of which sensitizes breast cancer cells to chemotherapy. BMC Cancer. 15(1):634. http://www.biomedcentral.com/1471-2407/15/634.
- Kleylein-Sohn J, Westendorf J, Le Clech M, Habedanck R, Stierhof Y-D, Nigg EA. 2007. Plk4-induced centriole biogenesis in human cells. Dev Cell. 13(2):190–202. http://linkinghub.elsevier.com/retrieve/pii/S1534580707002638.
- Komarova NL, Wodarz D. 2005. Drug resistance in cancer: principles of emergence and prevention. Proc Natl Acad Sci U S A. 102(27):9714–9719. http://www.pnas.org/content/102/27/9714.full.
- Lee J-L, Chang C-J, Chueh L-L, Lin C-T. 2003. Expression of secreted frizzled-related protein 2 in a primary canine mammary tumor cell line: a candidate tumor marker for mammary tumor cells. In Vitro Cell Dev Biol Anim. 39(5–6):221–227. http://www.ncbi.nlm.nih.gov/pubmed/12866949.
- Lee J-L, Chang C-J, Chueh L-L, Lin C-T. 2006. Secreted frizzled related protein 2 (sFRP2) decreases susceptibility to UV-induced apoptosis in primary culture of canine mammary gland tumors by NF-κB activation or JNK suppression. Breast Cancer Res Treat. 100(1):49–58. http://www.ncbi.nlm.nih.gov/pubmed/16791480.
- Lehmann C, Jobs G, Thomas M, Burtscher H, Kubbies M. 2012. Established breast cancer stem cell markers do not correlate with in vivo tumorigenicity of tumor-initiating cells. Int J Oncol. 41(6):1932–1942.
- Li W, Chang J, Wang S, Liu X, Peng J, Huang D, Sun M, Chen Z, Zhang W, Guo W, Li J. 2015. miRNA-99b-5p suppresses liver metastasis of colorectal cancer by down-regulating mTOR. Oncotarget. 6(27):24448–24462. http://www.ncbi.nlm.nih.gov/pubmed/26259252.
- Lippert TH, Ruoff H-J, Volm M. 2008. Intrinsic and acquired drug resistance in malignant tumors. The main reason for therapeutic failure. Arzneimittelforschung. 58(6):261–264. http://www.ncbi.nlm.nih.gov/pubmed/18677966.
- Liu S, Patel SH, Ginestier C, Ibarra I, Martin-Trevino R, Bai S, McDermott SP, Shang L, Ke J, Ou SJ, et al. 2012. MicroRNA93 regulates proliferation and differentiation of normal and malignant breast stem cells. PLoS Genet. 8(6):e1002751. http://www.ncbi.nlm.nih.gov/pubmed/22685420.
- Liu Z, Gersbach E, Zhang X, Xu X, Dong R, Lee P, Liu J, Kong B, Shao C, Wei J-J. 2013. miR-106a represses the Rb tumor suppressor p130 to regulate cellular proliferation and differentiation in high-grade serous ovarian carcinoma. Mol Cancer Res. 11(11):1314–1325. http://www.ncbi.nlm.nih.gov/pubmed/24045973.
- Longley DB, Allen WL, Johnston PG. 2006. Drug resistance, predictive markers and pharmacogenomics in colorectal cancer. Biochim Biophys Acta – Rev Cancer. 1766(2):184–196.
- Marech I, Patruno R, Zizzo N, Gadaleta C, Introna M, Zito AF, Gadaleta CD, Ranieri G. 2014. Masitinib (AB1010), from canine tumor model to human clinical development: where we are? Crit Rev Oncol Hematol. 91(1):98–111. https://www.sciencedirect.com/science/article/pii/S1040842813002667?via%3Dihub.
- Martin HL, Smith L, Tomlinson DC. 2014. Multidrug-resistant breast cancer: current perspectives. Breast Cancer (Dove Med Press). 6:1–13. http://www.pubmedcentral.nih.gov/articlerender.fcgi?artid=3929252&tool=pmcentrez&rendertype=abstract.
- Mathias RA, Chen Y-S, Wang B, Ji H, Kapp EA, Moritz RL, Zhu H-J, Simpson RJ. 2010. Extracellular remodelling during oncogenic Ras-induced epithelial-mesenchymal transition facilitates MDCK cell migration. J Proteome Res. 9(2):1007–1019. http://www.ncbi.nlm.nih.gov/pubmed/19954229.
- Meier V, Guscetti F, Roos M, Ohlerth S, Pruschy M, Bley CR. 2016. Hypoxia-related marker glut-1, caix, proliferative index and microvessel density in canine oral malignant neoplasia. PLoS One. 11(2):e0149993. http://www.ncbi.nlm.nih.gov/pubmed/26906567.
- Michishita M, Akiyoshi R, Suemizu H, Nakagawa T, Sasaki N, Takemitsu H, Arai T, Takahashi K. 2012. Aldehyde dehydrogenase activity in cancer stem cells from canine mammary carcinoma cell lines. Vet J. 193(2):508–513.
- Mohammadi-Yeganeh S, Paryan M, Arefian E, Vasei M, Ghanbarian H, Mahdian R, Karimipoor M, Soleimani M. 2016. MicroRNA-340 inhibits the migration, invasion, and metastasis of breast cancer cells by targeting Wnt pathway. Tumour Biol. 37(7):8993–9000. http://www.ncbi.nlm.nih.gov/pubmed/26758430.
- Moitra K. 2015. Overcoming multidrug resistance in cancer stem cells. Biomed Res Int. 2015:1–8. http://www.pubmedcentral.nih.gov/articlerender.fcgi?artid=4663294&tool=pmcentrez&rendertype=abstract.
- Molina-Pinelo S, Carnero A, Rivera F, Estevez-Garcia P, Bozada JM, Limon ML, Benavent M, Gomez J, Pastor MD, Chaves M, et al. 2014. MiR-107 and miR-99a-3p predict chemotherapy response in patients with advanced colorectal cancer. BMC Cancer. 14:656. http://www.ncbi.nlm.nih.gov/pubmed/25197016.
- Morris JS. 2016. Genomic and proteomic profiling for cancer diagnosis in dogs. Vet J. 215:101–109. http://www.sciencedirect.com/science/article/pii/S1090023316000046.
- National Research Council. 2011. Guide for the care and use of laboratory animals. Washington, DC: National Academies Press. p. 267–268. http://www.ncbi.nlm.nih.gov/pubmed/21595115.
- Nerurkar VR, Chitale AR, Jalnapurkar BV, Naik SN, Lalitha VS. 1989. Comparative pathology of canine mammary tumours. J Comp Pathol. 101(4):389–397.
- Oliveros JC. 2016. Venny. An interactive tool for comparing lists with Venn’s diagrams. https://bioinfogp.cnb.csic.es/tools/venny/index.html.
- Oosterwijk E, Gillies RJ. 2014. Targeting ion transport in cancer. Philos Trans R Soc Lond B Biol Sci. 369(1638):20130107. http://www.ncbi.nlm.nih.gov/pubmed/24493755.
- Pang LY, Cervantes-Arias A, Else RW, Argyle DJ. 2011. Canine mammary cancer stem cells are radio- and chemo- resistant and exhibit an epithelial-mesenchymal transition phenotype. Cancers (Basel). 3(2):1744–1762.
- Pang LY, Gatenby EL, Kamida A, Whitelaw BA, Hupp TR, Argyle DJ. 2014. Global gene expression analysis of canine osteosarcoma stem cells reveals a novel role for COX-2 in tumour initiation. PLoS One. 9(1):e83144. http://www.pubmedcentral.nih.gov/articlerender.fcgi?artid=3885401&tool=pmcentrez&rendertype=abstract.
- Pastrana E, Silva-Vargas V, Doetsch F. 2011. Eyes wide open: a critical review of sphere-formation as an assay for stem cells. Cell Stem Cell. 8(5):486–498.
- Piva R, Spandidos DA, Gambari R. 2013. From microRNA functions to microRNA therapeutics: novel targets and novel drugs in breast cancer research and treatment. Int J Oncol. 43(4):985–994. http://www.pubmedcentral.nih.gov/articlerender.fcgi?artid=3829774&tool=pmcentrez&rendertype=abstract.
- Prasad V, Suomalainen M, Pennauer M, Yakimovich A, Andriasyan V, Hemmi S, Greber UF. 2014. Chemical induction of unfolded protein response enhances cancer cell killing through lytic virus infection. J Virol. 88(22):13086–13098. http://www.ncbi.nlm.nih.gov/pubmed/25187554.
- Qin W, Ren Q, Liu T, Huang Y, Wang J. 2013. MicroRNA-155 is a novel suppressor of ovarian cancer-initiating cells that targets CLDN1. FEBS Lett. 587(9):1434–1439. doi:10.1016/j.febslet.2013.03.023.
- Qiu T, Xiang X, Lei W, Hao C, Zhang L, Feng M, Yu F, Li J, Xiong J. 2015. Establishment and biological characterization of 5-fluorouracil-resistant human colon cancer HT-29/5-FU cell line. Chinese J Cell Mol Immunol. 31(3):328–332. http://www.ncbi.nlm.nih.gov/pubmed/25744837.
- Queiroga FL, Raposo T, Carvalho MI, Prada J, Pires I. 2011. Canine mammary tumours as a model to study human breast cancer: most recent findings. In Vivo. 25(3):455–465.
- Rahman MM, Lai Y-C, Husna AA, Chen H, Tanaka Y, Kawaguchi H, Miyoshi N, Nakagawa T, Fukushima R, Miura N. 2019. Micro RNA transcriptome profile in canine oral melanoma. Int J Mol Sci. 20(19):4832. https://www.mdpi.com/1422-0067/20/19/4832.
- Rai SS, Wolff J. 1996. Localization of the vinblastine-binding site on β-tubulin. J Biol Chem. 271(25):14707–14711. http://www.ncbi.nlm.nih.gov/pubmed/8663038.
- Rothschild SI. 2014. microRNA therapies in cancer. Mol Cell Ther. 2(1):7. http://www.molcelltherapies.com/content/2/1/7.
- Rybicka A, Eyileten C, Taciak B, Mucha J, Majchrzak K, Hellmen E, Krol M. 2016. Tumour-associated macrophages influence canine mammary cancer stem-like cells enhancing their pro-angiogenic properties. J Physiol Pharmacol. 67(4):491–500. http://www.ncbi.nlm.nih.gov/pubmed/27779470.
- Rybicka A, Mucha J, Majchrzak K, Taciak B, Hellmen E, Motyl T, Krol M. 2015. Analysis of microRNA expression in canine mammary cancer stem-like cells indicates epigenetic regulation of transforming growth factor-beta signaling. J Physiol Pharmacol. 66(1):29–37. http://www.ncbi.nlm.nih.gov/pubmed/25716962.
- Saijo N. 2012. Critical comments for roles of biomarkers in the diagnosis and treatment of cancer. Cancer Treat Rev. 38(1):63–67. http://www.ncbi.nlm.nih.gov/pubmed/21652149.
- Salgado BS, Nonogaki S, Soares LM, Akamatsu A, da Silva CRN, Anacleto TP, Malagó R, Rocha RM, Gärtner F, Rocha NS 2015. Expression of multidrug resistance ATP-binding cassette (ABC) transporters in canine mammary tumors. Adv Breast Cancer Res. 04(03):77–85. http://www.scirp.org/journal/PaperInformation.aspx?PaperID=58406&#abstract.
- Sanders AM, Stehle JR, Blanks MJ, Riedlinger G, Kim-Shapiro JW, Monjazeb AM, Adams JM, Willingham MC, Cui Z. 2010. Cancer resistance of SR/CR mice in the genetic knockout backgrounds of leukocyte effector mechanisms: determinations for functional requirements. BMC Cancer. 10(1):121. http://www.ncbi.nlm.nih.gov/pubmed/20356394.
- Santos A, Lopes C, Marques RM, Amorim I, Ribeiro J, Frias C, Vicente C, Gärtner F, de Matos A. 2011. Immunohistochemical analysis of urokinase plasminogen activator and its prognostic value in canine mammary tumours. Vet J. 189(1):43–48. http://linkinghub.elsevier.com/retrieve/pii/S1090023310001863.
- Schultz NA, Dehlendorff C, Jensen BV, Bjerregaard JK, Nielsen KR, Bojesen SE, Calatayud D, Nielsen SE, Yilmaz M, Holländer NH, et al. 2014. MicroRNA biomarkers in whole blood for detection of pancreatic cancer. JAMA. 311(4):392–404. http://www.ncbi.nlm.nih.gov/pubmed/24449318.
- Selvarajah GT. 2011. Comparative studies on prognostic markers and signaling pathways for canine and human osteosarcoma. http://dspace.library.uu.nl/handle/1874/202742.
- Selvarajah GT, Kirpensteijn J, van Wolferen ME, Rao NAS, Fieten H, Mol JA. 2009. Gene expression profiling of canine osteosarcoma reveals genes associated with short and long survival times. Mol Cancer. 8(72):1–18.
- Selvarajah GT, Verheije MH, Kik M, Slob A, Rottier PJM, Mol JA, Kirpensteijn J. 2012. Expression of epidermal growth factor receptor in canine osteosarcoma: association with clinicopathological parameters and prognosis. Vet J. 193(2012):412–419.
- Sharpe R, Pearson A, Herrera-Abreu MT, Johnson D, Mackay A, Welti JC, Natrajan R, Reynolds AR, Reis-Filho JS, Ashworth A, Turner NC. 2011. FGFR signaling promotes the growth of triple-negative and basal-like breast cancer cell lines both in vitro and in vivo. Clin Cancer Res. 17(16):5275–5286. http://www.pubmedcentral.nih.gov/articlerender.fcgi?artid=3432447&tool=pmcentrez&rendertype=abstract.
- Shen F, Chu S, Bence AK, Bailey B, Xue X, Erickson PA, Montrose MH, Beck WT, Erickson LC. 2008. Quantitation of doxorubicin uptake, efflux, and modulation of multidrug resistance (MDR) in MDR human cancer cells. J Pharmacol Exp Ther. 324(1):95–102. http://jpet.aspetjournals.org/cgi/doi/10.1124/jpet.107.127704.
- Sipila PEH, Wiebe VJ, Hubbard GB, Koester SK, Emshoff VD, Maenpaa JU, Wurz GT, Seymour RC, DeGregorio MW. 1993. Prolonged tamoxifen exposure selects a breast cancer cell clone that is stable in vitro and in vivo. Eur J Cancer. 29(15):2138–2144.
- Sulakhe SJ, Lautt WW. 1987. A characterization of gamma-glutamyltranspeptidase in normal, perinatal, premalignant and malignant rat liver. Int J Biochem. 19(1):23–32. http://www.ncbi.nlm.nih.gov/pubmed/2883036.
- Tanaka T, Iino M. 2014. Knockdown of Sec8 promotes cell-cycle arrest at G1/S phase by inducing p21 via control of FOXO proteins. FEBS J. 281(4):1068–1084. http://www.ncbi.nlm.nih.gov/pubmed/24299491.
- Tang R, Yang C, Ma X, Wang Y, Luo D, Huang C, Xu Z, Liu P, Yang L. 2016. MiR-let-7a inhibits cell proliferation, migration, and invasion by down-regulating PKM2 in gastric cancer. Oncotarget. 7(5):5972–5984. http://www.ncbi.nlm.nih.gov/pubmed/26745603.
- Tegze B, Szállási Z, Haltrich I, Pénzváltó Z, Tóth Z, Likó I, Gyorffy B. 2012. Parallel evolution under chemotherapy pressure in 29 breast cancer cell lines results in dissimilar mechanisms of resistance. PLoS One. 7(2):e30804.
- Tomiyasu H, Goto-koshino Y, Fujino Y, Ohno K, Tsujimoto H. 2014. Epigenetic regulation of the ABCB1 gene in drug-sensitive and drug-resistant lymphoid tumour cell lines obtained from canine patients. Vet J. 199:103–109.
- Tomiyasu H, Goto-Koshino Y, Takahashi M, Fujino Y, Ohno K, Tsujimoto H. 2010. Quantitative analysis of mRNA for 10 different drug resistance factors in dogs with lymphoma. J Vet Med Sci. 72(9):1165–1172.
- Volinia S, Calin GA, Liu C-G, Ambs S, Cimmino A, Petrocca F, Visone R, Iorio M, Roldo C, Ferracin M, et al. 2006. A microRNA expression signature of human solid tumors defines cancer gene targets. Proc Natl Acad Sci U S A. 103(7):2257–2261. http://www.ncbi.nlm.nih.gov/pubmed/16461460.
- Wang L, Chang L, Li Z, Gao Q, Cai D, Tian Y, Zeng L. 2014. miR-99a and -99b inhibit cervical cancer cell proliferation and invasion by targeting mTOR signaling pathway. Med Oncol. 31(5):934. http://www.ncbi.nlm.nih.gov/pubmed/24668416.
- Wu Q, Yang Z, Wang F, Hu S, Yang L, Shi Y, Fan D. 2013. MiR-19b/20a/92a regulates the self-renewal and proliferation of gastric cancer stem cells. J Cell Sci. 126(18):4220–4229. http://www.ncbi.nlm.nih.gov/pubmed/23868977.
- Yamauchi A, Kontani K, Kihara M, Nishi N, Yokomise H, Hirashima M. 2006. Galectin-9, a novel prognostic factor with antimetastatic potential in breast cancer. Breast J. 12(s2):S196–S200. http://www.ncbi.nlm.nih.gov/pubmed/16959001.
- Yang S, Zhang L, Purohit V, Shukla SK, Chen X, Yu F, Fu K, Chen Y, Solheim J, Singh PK, et al. 2015. Active YAP promotes pancreatic cancer cell motility, invasion and tumorigenesis in a mitotic phosphorylation-dependent manner through LPAR3. Oncotarget. 6(34):36019–36031. http://www.impactjournals.com/oncotarget/index.php?journal=oncotarget&page=article&op=view&path%5B%5D=5935&path%5B%5D=14241.
- Yang X. 2012. Clonogenic assay. Bio Protoc. 20(10):2–3. http://www.bio-protocol.org/e187.
- Zadran S, Remacle F, Levine RD. 2013. miRNA and mRNA cancer signatures determined by analysis of expression levels in large cohorts of patients. Proc Natl Acad Sci U S A. 110(47):19160–19165. http://www.pubmedcentral.nih.gov/articlerender.fcgi?artid=3839764&tool=pmcentrez&rendertype=abstract.
- Zhang B, Zhao R, He Y, Fu X, Fu L, Zhu Z, Fu L, Dong J-T. 2015. Micro RNA 100 sensitizes luminal A breast cancer cells to paclitaxel treatment in part by targeting mTOR. Oncotarget. 7(5):5702–5714. http://www.ncbi.nlm.nih.gov/pubmed/26744318.
- Zhou B, Jin Y, Zhang D, Lin D. 2018. 5-Fluorouracil may enrich cancer stem cells in canine mammary tumor cells in vitro. Oncol Lett. 15(5):7987–7992. http://www.spandidos-publications.com/10.3892/ol.2018.8267.
- Zhou B, Zhang D, Pei SM, Zhang H, Du HC, Jin YP, Lin DG. 2017. Establishment of 5-fluorouracil-resistant canine mammary tumor cell line. Pol J Vet Sci. 20(1):103–110. http://www.degruyter.com/view/j/pjvs.2017.20.issue-1/pjvs-2017-0014/pjvs-2017-0014.xml.
- Zhou X, Wang G, Sun Y. 2015. A reliable parameter to standardize the scoring of stem cell spheres. PLoS One. 10(5):e0127348. http://www.jxedu.gov.cn.
- Zhu B, Zhang P, Zeng P, Huang Z, Dong T-F, Gui Y-K, Zhang G-W. 2013. Tissue factor pathway inhibitor-2 silencing promotes hepatocellular carcinoma cell invasion In Vitro. Anat Rec. 296(11):1708–1716. http://www.ncbi.nlm.nih.gov/pubmed/24591127.