
ABSTRACT
The molecular events underlying the lactation curve of dairy animals have long been a biological conundrum for mammary biologists, and a cause of a considerable loss of income for dairy farmers. To better understand the regulatory mechanisms and developmental processes of the mammary gland during the lactation cycle, whole-genome transcriptome profiles of bovine mammary tissues at five different lactation stages were investigated using the RNA-Seq technique. The differentially expressed genes were identified by comparing different lactation stage combinations. Gene expression changes were validated using quantitative reverse-transcription polymerase chain reaction. Some differentially expressed genes were found to locate in the known quantitative trait loci regions that are associated with multiple milk production traits. Proteins of potentially important genes were confirmed to be expressed in the mammary epithelium of dairy cows. An integrated analysis of differential gene expression indicated that internal development regularities underlying the shape of the milk production curve. First, the mammary gland is enriched in similar activities during lactation onset and involution, but in opposite regulatory directions. Second, the lactation stages before and after the milk peak shared similar biological processes that were mainly involved in extracellular matrix remodelling. The discoveries of the study provide information necessary to improve milk production.
Introduction
It is well known that the milk yield of dairy cows undergoes marked changes throughout the lactation cycle. Milk yield continuously increases from lactation onset until peak lactation which generally occurs between days 40 and 70 after parturition. Thereafter milk yield decreases until the end of lactation. The decline in milk yield after peak lactation in dairy animals has long been a biological conundrum for the mammary biologist (Stefanon et al. Citation2002), as well as a cause of considerable lost income for the dairy farmer. Selective breeding has produced dramatic milk yield gains by increasing peak lactation (Capuco et al. Citation2001). However, further gains could be achieved by improving the persistency of lactation. Knowledge of the molecular events driving lactogenesis and lactation persistency in dairy cows (Cole and Null Citation2009; Do et al. Citation2017; Nayeri et al. Citation2017) would contribute not only to the understanding of mammary gland development but also to improving the milk production of dairy cattle.
Milk yield and the shape of the lactation curve are determined by the number of mammary secretory cells and the secretory activities per cell (Capuco et al. Citation2001). It was shown in dairy cows that milk secretion increases to peak due to the continued differentiation of mammary secretory cells and increased secretory activity per cell, rather than an increase in a number of secretory cells (in the absence of net mammary growth) (Capuco et al. Citation2001). After peak milk, evidence indicate that milk production is driven by a loss of mammary cells resulting from an imbalance between cell proliferation and cell removal (Stefanon et al. Citation2002). However, these responses can be altered by hormonal changes, including those driven by the normal establishment of pregnancy during lactation.
The mammary gland undergoes dramatic metabolic and functional changes during the transition from late pregnancy to lactation (lactation onset) and/or from lactation to dry status (mammary involution) (Finucane et al. Citation2008). The lactation onset, also called lactogenesis, is the initiation of milk synthesis and secretion, including two stages (Neville et al. Citation2002). Stage I starts a few weeks before the parturition, characterized by mammary differentiation and progressive expression of milk proteins (caseins, lactalbumins etc.) as well as the secretion of pre-colostrum. Stage II starts around parturition and extends for several days after parturition, characterized by the closure of tight junctions between alveolar cells and starts to secrete the colostrums and/or milk (Finucane et al. Citation2008). During stage II, the metabolic and nutrient transport activities within the mammary increase predominately to support high levels of milk production, compared to the very limited secretory status in the non-lactating stage. Thus, the mammary gland at stage II in early lactation, not stage I, is the true status of the mammary gland that is ready for the upcoming increased milk yield. On the other hand, as for the dry period, the ending of the lactation period, the length of the dry period has been proven to be essential for the mammary health and milk yield of the next lactation cycle (Coppock et al. Citation1974; Sørensen and Enevoldsen Citation1991; Madsen et al. Citation2008). The mammary glands of lactating cows are generally dried off simply by stopping the milking process approximately 2 months before parturition. The mammary gland then undergoes an involution process, marked by the cessation of secretory activity and the re-absorption of milk residue, entering into a relatively static period (Gao et al. Citation2013). It was suggested that bovine mammary glands underwent three functional states during the dry period (Smith and Hogan Citation1982), usually being given 60 days: stage I, a period of active involution, which begins with the cessation of milking and lasts for around 30 days, being associated with the decreased synthesis of milk constituents and regression of synthetic tissue; stage II, lasting for around 2 weeks, a period of steady-state involution during which the mammary gland is fully involuted and is in a non-secretory state; and stage III, starting from 2 weeks before parturition, a period of lactogenesis during which synthetic tissue is regenerated and differentiation and colostrogenesis is initiated. Thus, the mammary gland at involution stage II will be a static involution status. The objective of the study was to explore the patterns of gene expression that drive mammary development and variation of milk yield during the lactation cycle.
Materials and methods
Ethics approval
We obtained written informed consent to use the animals from the Holstein Cattle Association Farm (Shandong, China). All sample collection procedures were carried out in strict accordance with the Regulations for the Administration of Affairs Concerning Experimental Animals published by the Ministry of Science and Technology (China, 2004) and approved by the Animal Care and Use Committee of Shandong Agricultural University (approval number, SDAUA-2016-035).
Animals and mammary gland tissue collection
Mammary gland tissues from fifteen healthy Holstein cows, with an average weight of 602 ± 19.2 kg and parity of 2.20 ± 0.68, were collected at the Holstein Cattle Association Farm in Shandong Province (Shandong, China). The animals were housed in a free-stall barn with constant access to water and feed. Diets were formulated to meet all NRC (2001) recommendations for lactation or dry cows using the Cornell-Penn-Miner System (CPM-Dairy, version 3.0.7). The feed was provided ad libitum, and the cows were milked three times daily. All of the cows (supplementary Table S1) used for mammary gland tissues biopsy were non-pregnant. Biopsies were collected during early lactation (4.6 ± 1.5 DIM, n = 3; LAC1), near peak milk (55 ± 4.3 DIM, n = 3; LAC2), during mid-lactation when milk yield was declining (163 ± 6.24 DIM, n = 3; LAC3), during late-lactation (312 ± 24.6 DIM, n = 3; LAC4) and during the dry period (33 ± 3.7 days after milking cessation, n = 3; LAC5). Equal proportional RNA extracted from mammary tissues in the same lactation stage was pooled for further transcriptome analysis. Biopsy techniques and postoperative care were carried out as previously described (Li et al. Citation2017). Mammary tissue samples were immediately snap-frozen in liquid nitrogen and stored at −80°C for later analysis.
RNA isolation, quantification and qualification assessment
Total RNA was extracted from stored samples using TRIzol reagent (Invitrogen, Carlsbad, CA) according to the manufacturer’s protocol, followed by treatment with DNase I (Ambion, Austin, Texas, USA) to remove possible DNA contamination. The extracted total RNA was assessed by 1% agarose gel electrophoresis for degradation and contamination monitoring. RNA purity was double-checked using the Nano Photometer® spectrophotometer (IMPLEN, CA, USA). A Qubit® RNA Assay Kit and a Qubit® 2.0 Fluorometer (Life Technologies, CA, USA) were used to determine RNA concentrations. RNA integrity was finally assessed using the RNA Nano 6000 Assay Kit and the Bioanalyser 2100 system (Agilent Technologies, CA, USA). The RNA sample with an RNA integrity number (RIN) larger than 8.0 will be processed further (supplementary Fig. S1). The RNA integrity assessment results for all 15 RNA samples were listed in supplementary Table S2.
Total RNA samples were pooled by lactation stage across cows in equal proportions, and 3 μg subsamples were used as input material for the transcriptome sequencing preparation. Sequencing libraries were generated using the NEB Next® Ultra™ RNA Library Prep Kit from Illumina® (NEB, USA) following the manufacturer’s recommendations and index codes were added to attribute sequences to each stage of lactation.
Transcriptome clustering and sequencing
The clustering of the index-coded samples was performed on a cBot Cluster Generation System using the TruSeq PE Cluster Kit v3-cBot-HS (Illumina, San Diego, USA) according to the manufacturer’s instructions. After cluster generation, the library preparations were sequenced on an Illumina Hiseq 2000 platform and 100 bp paired-end reads were generated.
Quality control
Raw reads of fastq format were initially processed using in-house Perl scripts (He et al. Citation2015) to obtain clean reads by removing reads containing the adapter sequence, reads containing poly-N and short reads from raw data. After the initial processing, Q20 (the proportion of bases with a Phred base quality score greater than 20; i.e. the proportion of read bases whose error rate is less than 1%), Q30 (the proportion of bases with a Phred base quality score greater than 30; i.e. the proportion of read bases whose error rate is less than 0.1%) and the GC content of the clean data were calculated (Cui et al. Citation2014). All the downstream analyses were based on clean data.
Reads mapping to the reference genome
The reference genome (bovine genome UMD3.1.66) and its gene model annotation files were downloaded from the genome website directly. An index of the reference genome was built using Bowtie v2.0.6 (Langmead and Salzberg Citation2012) and paired-end clean reads were aligned to the reference genome using TopHat v2.0.9 (Kim et al. Citation2013). We selected the TopHat as the mapping tool as it can generate a database of splice junctions based on the gene model annotation file and thus a better mapping result than other non-splice mapping tools.
Quantification of gene expression
The software HTSeq v0.6.1 (Trapnell et al. Citation2012) was used to count the number of reads mapped to each gene followed by an estimation of the RPKM of each gene. This is the most commonly used method for estimating gene expression levels, and it was calculated based on the length of the gene and the reads count mapped to this gene.
Differential expression analysis
Prior to differential gene expression analysis, the read counts were adjusted by the edgeR program package (Robinson et al. Citation2010) using one scaling normalized factor. Differential expression between two lactation stages was performed using the DEGSeq R package (1.12.0) (Love et al. Citation2014). The P-values were adjusted using Benjamini & Hochberg’s method (Huang and Boutros Citation2016) for controlling the false discovery rate (FDR). Genes in the threshold of |log 2 (Fold Change) |> 1, q-value < 0.005 were assigned as significantly differential expressed genes, by using DEGSeq 2 (v1.16.1) (Love et al. Citation2014).
Gene ontology (GO) and Kyoto encyclopedia of genes and genomes (KEGG) enrichment analysis of differentially expressed genes
GO enrichment analysis of differentially expressed genes was implemented by the GOseq R package (Tarazona et al. Citation2011), in which gene length bias was corrected. GO terms with corrected P-value less than 0.05 were considered significantly enriched by differential expressed genes. Further, KOBAS software (Mao et al. Citation2005) was used for KEGG analysis to identify the statistical enrichment of differential expression genes in the KEGG pathways based on the molecular-level information, especially large-scale molecular datasets generated by genome sequencing and other high-throughput experimental technologies at http://www.genome.jp/kegg/. KEGG pathways with corrected P-value less than 0.05 were considered significantly enriched by differential expressed genes.
Candidate genes in known QTL regions
In order to investigate whether the differentially expressed genes were candidate genes for the milk production traits of dairy cattle, a search of the QTL database at http://www.cn.animalgenome.org//cgi-bin/QTLdb/BT/index and http://cowry.agri.huji.ac.il/QTLMAP/qtlmap.htm, respectively, was conducted using the top 40 significantly differentially expressed genes (supplementary Tables S4 and S5) identified from the comparison of LAC1 vs LAC5 and LAC5 vs LAC4. These genes were searched one-by-one in the two databases.
Protein–protein interaction (PPI) analysis of differentially expressed genes
Further information on the possible function of differentially expressed genes was predicted using Cytoscape software (Kohl et al. Citation2011) to identify potential PPIs. A Blastx comparison to the STRING database (Szklarczyk et al. Citation2019) using Blastx v2.2.28 (Camacho et al. Citation2009) was conducted to identify interactions of differentially expressed genes, and then interaction data was imported into Cytoscape software for visualization.
Quantitative reverse-transcription polymerase chain reaction (qRT-PCR)
To validate the reproducibility of RNA-seq data, 18 differentially expressed genes were randomly selected for analysis by qRT-PCR. The same RNAs extracted from the mammary gland tissues at each lactation stage were used for qRT-PCR validation. The primer pairs were synthesized by Sangon Biotech (supplementary Table S9). qRT-PCR was carried out according to the TaKaRa manufacturer specifications for reference to SYBR® Premix Ex TaqTM (Tli RNaseH Plus). SYBR Green PCR cycling was denatured using a programme of 95°C for 10 s, and 40 cycles of 95°C for 5 s and 60°C for 40 s, and performed on an ABI 7500 instrument (Applied Biosystems, CA, USA). The specificity of each PCR product was confirmed by melting curve analysis. All qRT-PCR assays were performed in triplicate reactions. The housekeeping genes β-actin and GAPDH were used as the internal control genes. The expression levels of target mRNAs were obtained based on three individual RNAs extracted from the three cows and were shown to be normalized to β-actin.
Immunohistochemistry staining and its quantification
Tissues dissected from the mammary glands of cows were fixed in 4% paraformaldehyde and embedded in paraffin. Sections (5 mm thickness) of the tissues were then subjected to standard immunohistochemistry staining. The primary antibodies against FABP3 (bs-11283R, Bioss-antibodies, Beijing, China), SPP1 (bs-0019R, Bioss-antibodies, Beijing, China), PIGR (bs-6061R, Bioss-antibodies, Beijing, China) and CYBB (bs-3889R, Bioss-antibodies, Beijing, China) were used at a 1:200 dilution by incubating the slides at 37°C for 2 h. After the slides were washed, they were treated with HRP-conjugated goat anti-rabbit IgG (1:50, Beyotime, Nanjing, China) for 1 h at 37°C.
Tissue slices were scanned and the images were exported using the software Pannoramic MIDI (3D HISTECH). The images were captured and observed using the Pannoramic viewer software, a program of Quant centre was used for density quantification of the positive staining by automatically identifying the dark brown for strong positive, brown for moderate positive and light yellow for weak positive, and blue nuclei staining for negative staining. The cumulative area of each staining density category of each slice was determined and converted to percentages. T percentages were used to calculate a weighted average parameter H-score (histochemical score) which was used for the target protein expression comparison, according to the formula: H-score = (% weak staining ×1) + (% moderate staining ×2) + (% strong staining ×3). The expression level of target proteins at each lactation stage was evaluated by scanning six slices from each of the two animals, except for the dry period with three slices from one animal.
Results
Sequencing and mapping of the bovine mammary gland transcriptome
cDNA libraries of mammary tissue samples collected from non-pregnant Holstein cows (supplementary Table S1) at five different lactation stages early lactation (4.6 ± 1.5 days in milk (DIM), LAC1; peak lactation (55 ± 4.3 DIM), LAC2; mid-lactation (163 ± 6.24 DIM), LAC3; late-lactation stage (312 ± 24.6 DIM), LAC4; and during the dry off period [(33 ± 3.7 days after cessation of milk removal), LAC5)] were established and sequenced. In total, we acquired 59,110,796-63,151,148 pair-ended reads of 100 bp in length per sample. As a result, the total read length was 37.98 gigabytes (Gb) for the five samples. Alignment of the sequence reads against the bovine genome UMD3.1.66 yielded 86.34%–88.24% uniquely aligned reads across the five samples, of which 70.6%–80.9% fell in the annotated exons, 4.4%–10.7% were located in introns, and the remaining 14.3%–19.7% was assigned to intergenic regions (supplementary Table S3). Unmapped reads and/or matched reads at multiple positions accounting for 11.76%–13.66% of the reads, were excluded from further analyses. The correlation coefficient (R2) of gene expression among samples was calculated and shown to be ≥0.92 based on the reads per kilobases per million reads (RPKM) (supplementary Fig. S2), indicating the reliability of our data and the rationality of samplings.
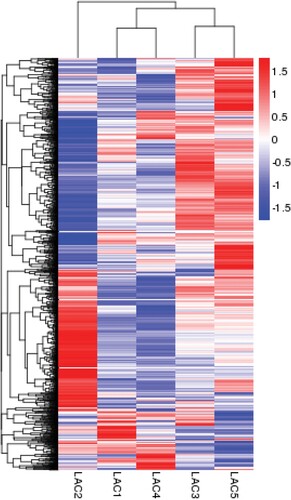
From the heat map of the transcriptome profiles of five different lactation stages, the gene expression pattern at the peak milk stage (LAC2) is very different than the other four lactation stages (). Gene expression at lactation onset (LAC1) showed similar patterns as of late lactation (LAC4). Expressions at the mid-lactation stage (LAC3) and during the dry period (LAC5) were also similar.
Figure 1. Heat map of whole-genome expression indicating differences and similarities of gene expression patterns of the mammary gland at different lactation stages. Red represents genes with high expression levels; blue represents genes with low expression levels. LAC1 samples were from the period of lactation onset (4.6 ± 1.5 days in milk (DIM), n = 3), LAC2 samples were from the period of peak milk production (55 ± 4.3 DIM, n = 3), LAC3 samples were from the period of mid-lactation (163 ± 6.24 DIM, n = 3), LAC4 samples were from late lactation (312 ± 24.6 DIM, n = 3), and LAC5 samples were from the dry period (33 ± 3.7 days after cessation of milk removal, n = 3). The gene expression patterns at peak milk were quite different than for other lactation stages. Patterns during lactation onset (LAC1) and the late lactation (LAC4) showed similar gene expression patterns, and gene expression patterns during the mid-lactation (LAC3) and dry period (LAC5) were also similar.
Mammary tissues during lactation onset and involution exhibited reversed gene expression patterns, and therefore inversion of similar molecular functions
To gain insights into the process of lactation onset and lactation involution, we compared LAC1 vs LAC5 and LAC5 vs LAC4 to obtain the differentially expressed genes. For LAC1 vs LAC5, 342 differentially expressed genes were detected using the criteria of a log 2 change in expression (DEseq, |log 2 (difference)|> 1, q-value < 0.005), among which 158 genes were up-regulated and the other 184 genes were down-regulated at LAC1, compared with LAC5. For LAC5 vs LAC4, 439 differentially expressed genes were identified using the same criteria, among which 263 genes were up-regulated and 176 genes were down-regulated at LAC5 compared with LAC4.
The top 40 differentially expressed genes identified by LAC1 vs LAC5 and LAC5 vs LAC4 are listed in supplementary Tables S4 and S5, respectively. These differentially expressed genes include genes likely playing an important regulatory role during lactation onset and involution. Interestingly, 21 of the 40 regulated genes during lactation onset were simultaneously regulated in an opposite direction during lactation involution. That is, genes up-regulated during lactation onset were simultaneously down-regulated in lactation involution.
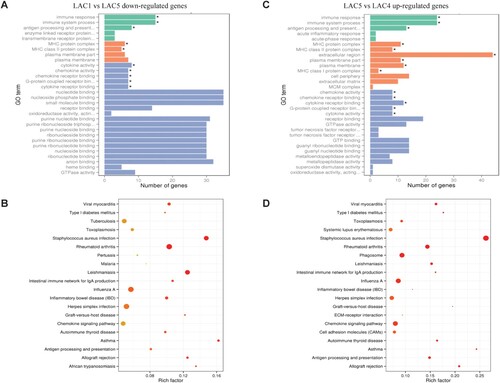
To further investigate the functional association of these differentially expressed genes, we performed an analysis of GO and KEGG. The down-regulated genes from LAC1 vs LAC5 (in early lactation) were significantly associated with immune responses ((A)), including cytokine activity, G-protein coupled receptor binding, antigen processing and presentation, regulation of organelle organization and plasma membrane component. Further KEGG analysis of the down-regulated genes revealed a significant association with immune response pathways ((B)), previously found to be elicited by Staphylococcus aureus infection, Leishmaniosis, rheumatoid arthritis, viral myocarditis, auto-immune thyroid disease, influenza A, graft-versus-host disease, cell adhesion molecules (CAMs) and chemokine signalling pathways. Interestingly, the up-regulated genes identified from LAC5 vs LAC4 showed almost the same functional enrichment as the down-regulated genes identified from LAC1 vs LAC5 including the immune responses ((C)) and influenza A/chemokine signalling pathways ((D)).
Figure 2. The down-regulated genes during lactation onset and up-regulated genes during lactation involution were enriched in similar GO terms, as were the KEGG pathways. The GO terms of up-regulated genes at LAC1 compared with LAC5 (A) and down-regulated genes at LAC5 compared with LAC4 (C) were both enriched in bioprocesses of immune response and molecular binding activities. The y-axis shows the names of enriched GO terms, and the x-axis shows the number of differentially expressed genes in certain GO terms. ‘*’ shows significantly enriched GO terms. The colours green, yellow and blue indicate the three GO categories, biological process, cellular component and molecular function, respectively. And, the KEGG pathways of up-regulated genes at LAC1 compared with LAC5 (B) and down-regulated genes at LAC5 compared with LAC4 (D) were both mainly enriched in immune response-associated pathways such as rheumatoid arthritis and influenza A. The x-axis displays the relative degree of rich factors. The size of dots indicates the number of differentially expressed genes enriched in the certain pathways. The colour of dots represents their statistical significance, the gradient colour from red to blue corresponds to increasing q-values. LAC1 represents the lactation onset stage on 4.6 ± 1.5 days in milk (DIM), LAC4 represents the late lactation stage on 312 ± 24.6 DIM, and LAC5 represents the dry period stage on 33 ± 3.7 days after cessation of milk removal.
Up-regulated genes from LAC1 vs LAC5 (early lactation) were linked to metabolic and transport processes through GO enrichment analysis (supplementary Fig. S3A), including organic acid metabolic process, glutathione metabolic process, cellular amino acid metabolic process, transporter activity, oxidation–reduction processes and small molecule biosynthetic processes. Further KEGG analysis of these up-regulated genes indicated they were mainly involved in pathways associated with metabolism (supplementary Fig. S3B), including galactose metabolism, amino sugar and nucleotide sugar metabolism, phenylalanine, tyrosine and tryptophan biosynthesis, propanoate metabolism, glycerolipid metabolism, the PPAR signalling pathway, and the AMPK signalling pathway. Again, the down-regulated identified genes from LAC5 vs LAC4 showed almost the same functional enrichments as the up-regulated genes identified from LAC1 vs LAC5 including metabolic processes (supplementary Fig. S3C) and pathways associated with biosynthesis and metabolisms (supplementary Fig. S3D).
These discoveries suggested that the mammary epithelium experienced a reversal of internal mechanism changes during the transition from lactation status to involution, compared to the transition from the dry period to lactation status. This internal developmental principle was also indicated by the results of cluster analysis (), showing the expression patterns of LAC1 and LAC4 were very similar. This suggests that mammary epithelium transiting involution and lactation onset utilize common internal mechanisms.
Differentially expressed genes during lactation onset and involution overlapped with known milk production-associated quantitative trait loci (QTLs)
We found that 13 of the differentially expressed genes were candidate genes for multiple milk production traits (seven milk production traits in total, ). For example, SPP1 was closely related to fat percentage (FP), fat yield (FY) and protein percentage (PP). Eight of the 13 genes were identified in both comparisons of LAC1 vs LAC5 and LAC5 vs LAC4. Moreover, 10 genes were located in chromosomal regions containing QTLs that are known to be associated with milk production traits ().
Differentially expressed genes identified in the lactation periods before and after peak milk were involved in similar biological pathways with similar molecular functions
To gain insights into molecular events underlying increased milk production prior to peak and decreased production thereafter, we compared gene expression from LAC2 and LAC1, and from LAC3 and LAC2. During the period when milk yield was increasing (LAC2 vs LAC1), 695 genes were differentially expressed, with 462 genes up-regulated and the other 233 genes down-regulated (supplementary Fig. S4A). Further, during the period following the peak when milk yield was decreasing (LAC3 vs LAC2), 884 genes were differentially expressed, with 456 genes up-regulated and 428 genes down-regulated (supplementary Fig. S4B). GO analysis of these differentially expressed genes (LAC2 vs LAC1 and LAC3 vs LAC2) indicated that extracellular matrix (ECM) remodelling processes were significantly involved in both periods, with similar molecular functions in extracellular region (supplementary Table S6). These genes include those involved production of collagen, calcium ion binding, regulation of peptidase activity, proteolysis etc. Moreover, these differentially expressed genes in both periods were shown to share similar biological pathways/processes via KEGG analysis, such as lysosome, phagosome, ECM-receptor interaction, cell adhesion molecules (CAMs), protein digestion and absorption, focal adhesion and so on (detailed in ). The PI3K-Akt signalling pathway was also significantly enriched, indicating a potential regulatory role in controlling milk production (supplementary Table S5).
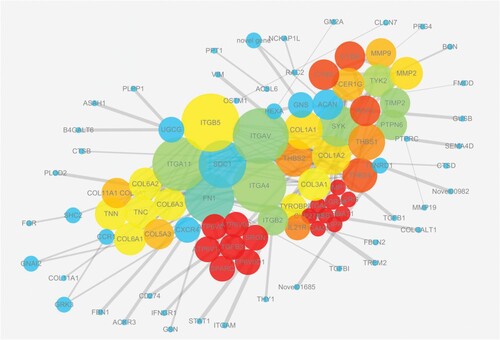
A majority of the differentially expressed genes identified from the two comparisons (302/462 and 302/428, supplementary Fig. S5) were shown to take part in these biological processes during both increasing and decreasing milk yield periods. This suggested mammary glands go through similar biological processes, but with opposite regulatory directions during the lactation period before and after peak milk. ECM remodelling processes were up-regulated as lactation increased, down-regulated when milk yield was declining post-peak. Additionally, the 302 common genes, with a reliable STRING score (> 700), were shown to be involved in a PPI network based on the STRING database (), indicating they interacted with each other and played a role in regulating milk production. Thirty genes lying at the key nodes of the PPI network showed opposite differential expression before and after peak milk (supplementary Table S7), consistent with the lactation curve of a dairy cow. They were mainly involved in the phagosome (supplementary Fig. S5) and ECM-receptor interaction pathways (supplementary Fig. S6), suggesting an important role in determining changes in milk yield as lactation progresses.
Figure 3. PPI network of the identified differentially expressed genes. These genes showed consistent changes in gene expression with the shape of the lactation curve. The size of the node/gene in the network represents its importance degree, in other words, the more edges connected to the node, the greater are the nodes. The colour of the node is related to the clustering coefficient of the node, the colour gradient from blue to yellow to red corresponds to the value of the clustering coefficient from low to high; the clustering coefficient represents the connectivity between the adjacent nodes. A higher value indicates the better connectivity. The width of the edge indicates the interaction degree of the two nodes connected, the stronger the interaction, the wider the edges. The genes located at key nodes were also listed in supplementary Table S7.
Differentially expressed genes identified by RNA-seq positively correlated with qRT-PCR results
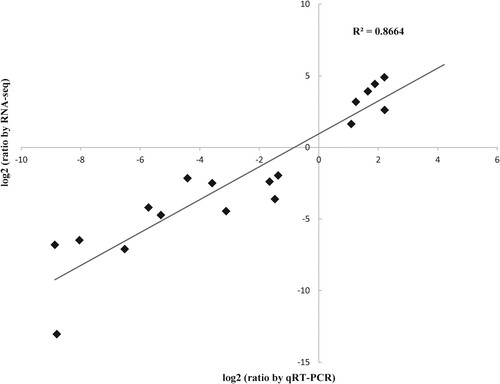
To assess the accuracy and the reliability of differential expression genes identified by RNA-seq, 18 differentially expressed genes from different comparisons were randomly selected to perform qRT-PCR tests. The expression results for all genes assessed using qRT-PCR and RNA-seq are shown in supplementary Fig. S7. As can be observed, the expression patterns of 18 genes showed a general agreement between the two technologies. The correlation coefficient (R2) of their mRNA expression levels was 0.866, indicating the high consistency between the RNA-seq data and qRT-PCR data ().
Figure 4. The expression change of genes identified by RNA-seq showed the high correlation with the expression level obtained from qRT-PCR. Twenty differentially expressed genes (as shown in rectangle dots) identified from different comparisons were randomly selected for their expression validation by quantitative RT-PCR (qRT-PCR). The x-axis shows the log 2 (fold change of mRNA levels) measured by qRT-PCR. The qRT-PCR data are shown as relative expression levels normalized to the internal control β-actin (ACTB). The y-axis shows the log 2 (fold change of RPKM values) by RNA-seq. The detailed validation results for each gene are also shown in supplementary Fig. S7.
Immunohistochemistry staining the target encoded proteins differentially expressed in the mammary epithelium of dairy cows at different lactation stages
To further evaluate the expression levels and locations of these potential candidate genes in the mammary gland of dairy cows, the four following genes were chosen to perform the immunohistochemistry staining using specific antibodies: SPP1 (secreted phosphoprotein 1, ), FABP3 (fatty acid-binding protein 3, ) and PIGR (poly-immunoglobulin receptors, ) that were identified in lactation involution and the onset of lactation or for their significantly decreased expressions in the dry period (LAC5; supplementary Tables S4 and S5); and CYBB (Cytochrome b245) that had significantly increased expression of peak production (LAC2; supplementary Table S7). The results showed that the corresponding proteins were abundantly expressed in the cytoplasm of mammary epithelium cells ((A)). Further, the weighted average quantifications of positive staining in different lactation stages indicated consistent protein expression trends with their RNAs ((B,C)), supporting the possible regulatory role in mammary tissues during milk production.
Figure 5. Immunostaining of different stage lactation mammary gland tissues of Holstein cows confirmed FABP3/SPP1/PIGR/CYBB expressed at different levels. Mammary gland sections from cows at LAC2 (+57 and +58 days in milk, DIM), LAC3 (+156 and +165 DIM), LAC4 (+310 and +338 DIM) and LAC5 (dry period) were assessed for FABP3, SPP1, PIGR and CYBB expression by immunohistochemistry staining with their corresponding specific antibodies. Normal rabbit IgG was used as a negative control. Representative results are shown in (A). The right panel is a high-powered magnification of the black dashed area in the left panel, with a magnification of × 100 (bar = 200 µm) and × 510 (bar = 50 µm), respectively. Brown indicates positive staining. (B) Quantification of the normalized percentages of FABP3-, SPP1- and PIGR-expressed epithelial cells at LAC4 and LAC5 in all microscopic views of tissue slices. The weighted average method (H-score, histochemical score) was used for the quantification, according to the formula: H-score = (% weak staining × 1) + (% moderate staining × 2) + (% strong staining × 3). Dark brown for strong positive, brown for moderate positive and light yellow for weak positive, blue nuclei for negative staining and/or nucleus staining. The expression level of the target protein at a certain lactation stage was evaluated by counting three slices from each animal. (C) Quantification of the normalized percentages of CYBB-expressed epithelial cells in all microscopic views of mammary slices at the lactation stage of LAC2 and LAC3. The same weighted average method as for B was applied.
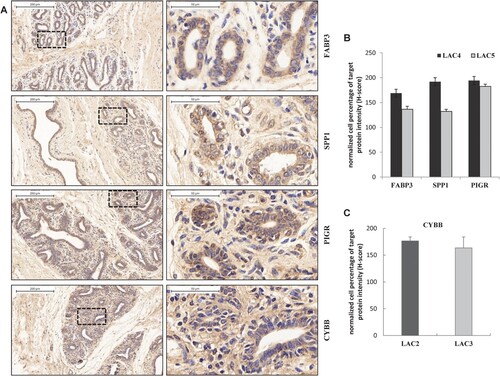
Table 1. Thirteen differential expressed genes were found as candidate genes for milk production traits in the cattle QTL database.Table Footnotea
Table 2. The 10 candidate genes associated with milk production traits overlap with the known QTL regions.Table Footnotea
Discussion
The transcriptome profile of bovine mammary tissues was investigated at different stages of the lactation cycle, so as to reveal gene expression patterns that may regulate mammary function related to milk production.
Similar, but opposite internal biological regulation occurred during the lactation onset and mammary involution
During the onset of lactation, mammary requirements for amino acids, glucose, and other nutrients required for milk synthesis surges dramatically (Finucane et al. Citation2008). Mammary uptakes of glucose, amino acid and fatty acids in high production cows are more than 1.8, 1.4 and 1.2 kg per day, respectively (Bell Citation1995; Hu et al. Citation2015; Jiang et al. Citation2018). Thus, it is not surprising to see so many up-regulated genes during the lactation onset (LAC1) that are associated with metabolism and transport processes (supplementary Figs. S3A and S3B, supplementary Table S4), in support of the synthesis of milk lactose, protein and fat. For example, alpha-lactalbumin (LALBA) mRNA increased more than 8,000-fold (log2 fold change = 13.04) at the onset of lactation (supplementary Table S8), as did alpha-s1 casein (CSN1S1), alpha-s2 casein (CSN1S2), beta-casein (CSN2), kappa casein (CSN3) and the lipogenic genes required for milk fat synthesis (supplementary Table S8). The later included cluster of differentiation 36 (CD36, also known as fatty acid translocase) which transports fatty acid from blood, fatty acid-binding protein 3 (FABP3) which participates in the transport of long and short-chain fatty acids, acetyl-CoA carboxylase alpha (ACACA) which regulates de novo fatty acid synthesis, stearoyl-CoA desaturase (SCD) which participates in fatty acid desaturation, glycerol-3-phosphate acyltransferase which provides glycerol-3-phosphate for acylation of fatty acids, glycerol-3-phosphate acyltransferase mitochondrial (GPAM) which participates in the synthesis of the triacylglycerol, butyrophilin subfamily 2 member A1 (BTN2A1) that is involved in lipid droplet formation, 3-hydroxybutyrate dehydrogenase 1 (BDH1) which participates in ketone body utilization, insulin-induced gene 1 (INSIG1) which participates in transcription regulation, and also sterol regulatory element-binding transcription factor 1 (SREBF1) which is considered to be a master regulator gene for milk fat synthesis.
The genes down-regulated during mammary involution (LAC5 vs LAC4) also mainly included those involved in metabolism and transport activities (Figs. S3C and S3D, supplementary Table S5). Secreted phosphoprotein 1 (SPP1), also known as osteopontin (OPN), is a glycoprotein mediating cell-matrix interaction and signal transduction by binding to integrin and CD44 receptors, and it had the greatest differential expression during lactation involution. The expression of SPP1 in the murine mammary glands was also found to be associated with tissue development (Rittling and Novick Citation1997). Targeted expression of SPP1 antisense RNA in the mammary epithelia of transgenic mice resulted in a lack of mammary alveolar structures, a drastic reduction in the synthesis of β-casein and whey acidic milk protein, and lactation deficiency (Nemir et al. Citation2000), indicating that SPP1 is required for the normal tissue development and lactogenesis in murine mammary glands. Actually, SPP1 (OPN) was also identified as a candidate gene for the regulation of milk fat percentage, milk protein content and milk fat yield () (Cohen-Zinder et al. Citation2005; Schnabel et al. Citation2005; Capomaccio et al. Citation2015). Our immunohistochemistry results () showed that SPP1 was expressed in the cytoplasm of mammary epithelial cells, and SPP1 protein expression was positively correlated with its mRNA expression. Thus, these results indicate that the selected genes that were differentially expressed, i.e. FABP3 and PIGR, during lactation onset and mammary involution are potentially related to milk production, and provide a reference database for new discoveries of milk production associated genes.
During lactation onset and involution, opposing changes in the expression of genes associated with immune responses were observed. In early lactation, the down-regulated genes were enriched in biological processes associated with an immune response ((A)), and the up-regulated genes during mammary involution were similarly enriched ((B)). Regulation of immune response during early lactation may reflect a recovery from the immunological stress of calving (Yan et al. Citation2019; Shi et al. Citation2020; Shi et al. Citation2020). While, for the involuting glands, it may reflect the need for increased activity as the integrity of the tissue is compromised during the remodelling (Macciotta et al. Citation2008). There is an increased risk of disease and inflammation during involution (i.e. udder infection) as compared with other lactation stages (Hurley Citation1989, 51-53) (Sordillo et al. Citation1997; Sordillo and Streicher Citation2002), thus providing a potential advantage to animals expressing an enhanced immune function as a defence against udder infections (Gao et al. Citation2013). An example is provided by the signal transducer and activator of transcription 1 (STAT1) which plays an important role in host defence against viral pathogens (Isaacs and Lindenmann Citation1957; Samuel Citation2001) through the interferon (IFN) system. STAT1 gene expression was up-regulated at drying-off compared with LAC1 and/or LAC4 (supplementary Tables S4 and S5), suggesting a potential immunological function in mammary glands. Interestingly, STAT1 was also identified as a candidate gene for milk protein percentage (PP) and milk protein yield (PY) traits (), indicating potential connections between immune response and milk production in mammary glands during the drying-off period.
Common, but opposite biological responses occurred before and after peak milk lactation in mammary tissue
Genes that were differentially expressed as cows approached peak lactation (LAC2 vs LAC1) were largely overlapped with genes that were differentially expressed after peak lactation (LAC3 vs LAC2). GO enrichment analyses revealed these genes were involved in ECM remodelling (supplementary Table S6). Remodelling of ECM occurs as mammary epithelial cells proliferate and differentiate, undergo apoptosis and cell renewal, and are invaded by migrating endothelial cells (Connor et al. Citation2008). The differential expression of these genes thus suggests that ECM remodelling () may be a key component of the internal regulatory mechanism controlling variation in milk yield before and after peak lactation.
Table 3. The 10 most significantly enriched KEGG pathways from the differentially expressed genes were identified by comparisons of LAC2 vs LAC1 and LAC3 vs LAC2, respectively.
It has previously been hypothesized that such regulation is affected by the influence of the ECM on hormonal action, and by the regulation of intracellular activity via cell binding to the matrix (Horacek et al. Citation1993; Postel-Vinay MC et al. Citation1995). Studies have focused on the endocrine regulation component and demonstrated hormone secretion and function acted through ECM-dependent signalling (Postel-Vinay MC et al. Citation1995; Stupack and Cheresh Citation2003; Huang and Yuan Citation2011; Shi et al. Citation2017; Yang et al. Citation2018).
Other work has demonstrated that ECM is critical in regulating neovascularization and endothelial cell survival (Stupack and Cheresh Citation2003; Davis and Senger Citation2005), and that proteolysis and remodelling of the ECM are necessary to allow for the invasion of new blood vessels (Stupack and Cheresh Citation2002). The KEGG analysis demonstrated that differentially expressed genes were enriched in the platelet activation pathway () before peak milk and the hematopoietic cell lineage pathway () post-peak.
Beyond the neovascularization effects, epithelial cell binding to the ECM has been demonstrated to be required to maintain milk production and plays an important role in mammary growth and function (Williams et al. Citation2008; Chowdhury et al. Citation2010; Li et al. Citation2011). Secretion of beta-casein does not occur in the absence of interactions between cells and specific basement membrane components (Gibson et al. Citation1991). However, it is difficult to separate neovascularization and changes in cell metabolism (Capuco et al. Citation2001; Connor et al. Citation2008) as the former contributes to changes in metabolite supply (McManaman and Neville Citation2003; Bauman et al. Citation2006; Baldi et al. Citation2008; Connor et al. Citation2008) which may drive changes in cell metabolism, and the latter can affect neovascularization (Stupack and Cheresh Citation2002; McManaman and Neville Citation2003).
After peak lactation, the decline in milk production has been attributed to the loss in a number of secretory cells (Capuco et al. Citation2003; Chen et al. Citation2018). It was reported that the number of mammary epithelial cells in ruminants was reduced by about 50%, caused by the imbalance between cell proliferation and cell removal, which would be a principal cause of declining production (Stefanon et al. Citation2002). Our KEGG analysis had also shown differentially expressed genes during the lactation period after peak milk were enriched in the focal adhesion pathway, phagosome pathway (Supplementary Fig. S5) and ECM-receptor interaction pathway (Supplementary Fig. S6). These pathways play essential roles in cell proliferation and/or cell survival (Shi et al. Citation2017). For example, the focal adhesion pathway regulates cell motility, cell proliferation and cell survival. Specific ECM components provide a scaffold for cell adhesiveness and are involved in bidirectional signal transduction across the basement membrane. The differentially regulated ECM genes include fibronectin 1 (FN1), collagen alpha-1(I) chain (COL1A1), collagen alpha-2 (I) chain (COL1A2), collagen alpha-1(III) chain precursor (COL3A1), collagen type VI alpha 1 chain (COL6A1), collagen type VI alpha 2 chain (COL6A2), collagen type VI alpha 3 chain (COL6A3) and the secreted protein SPARC which exhibits a variety of biological activities through the interaction with ECM (supplementary Table S7). These ECM interactions determine the cell fate (Guilak et al. Citation2009; Li et al. Citation2016; Shi et al. Citation2017). In short, the similar processes but oppositely directed regulation in the mammary glands on ECM remodelling could account for the increase and/or decrease in milk production until peak lactation. These genes could potentially be the important candidate genes controlling the variation of milk yield before and after peak milk.
Advantages and limitations of the study
In this study, tissue for the analyses was obtained from non-pregnant dairy cows, allowing us to accurately follow the internal regulatory mechanisms throughout the whole lactation cycle. The mammary tissues from non-pregnant cows enabled us to avoid the following concerns: (1) to avoid overlapping of mammary status before and after parturition. The gland of pregnant cows usually starts lactogenesis in the last few weeks or days of pregnancy before calving (Akers Citation2017). The mammary gland of non-pregnant cows was considerably different from that of pregnant cows; (2) to avoid inextricable physiological changes around parturition driven by large changes in hormonal secretion including a dramatic reduction in progesterone and a pulse of prolactin secretion at parturition; and (3) to avoid complications associated with becoming pregnant during lactation and the dry period. Especially, the dry gland of the non-pregnant cow will undergo extensive involution, which is considerably different from that of the pregnant cow (with reduced involution).
An equal proportionally pooling method was used in the study to obtain the transcriptome profile of each lactation stage. The pooling method failed to account for animal variation in the growth/development of mammary glands. The ideal way to reveal the internal regulatory mechanisms of mammary glands is to follow up on an individual cows’ milking track, and biopsy its mammary glands at each lactation stage. However, this method still cannot accurately follow the development and growth of the mammary gland, because the multiple biopsies of the mammary gland will definitely make a bad effect on the normal development process of the mammary gland and also bring down the milk yield.
Admittedly, the study is limited by the lack of biological replication. However, the pooling method still had its advantages to reveal the common internal regulatory mechanisms inside mammary glands. First, the differences between individual cows might be brought by different lactation numbers (parity numbers), feeding intake or genetic background. This pooling method made the differences among individual cows balanced out, allowing us to make comparisons at an approximately equal background. Secondly, as we know, altered mammary gene expressions were caused mainly due to the differences in parity, age, and genetics among cows. The pooling method yielded averaged expression levels of target genes, still being a suitable way to study the transcriptome profiles of the mammary glands (Gao et al. Citation2013). This would make up for the lack of biological replications. Moreover, the pooling method effectively balanced the genetic and physiological differences among mammary samples, especially avoiding the special impact or outside factors on the mammary glands, such as parity number. As we know, the mammary glands during the first parity considerably differ in mammary growth and development from that of multiparous cows.
Evidence in the three following aspects suggested the data obtained in the study were reliable. First, a subset of the expression results was verified using qRT-PCR. The relatively high correlation coefficient () suggests that the RNA-seq data were reliable and accurate (Marioni et al. Citation2008). Secondly, the PI3K/Akt signalling pathway was found to be significantly impacted during the lactation period before and after peak milk, 30 and 45 genes involved in the pathway were shown to be differential expressing before and after the peak milk stage, respectively (). The PI3K/Akt are upstream regulators of the mTOR pathway in all mammalian tissues, regulating the milk protein synthesis, particularly translation (Bionaz and Loor Citation2011). Studies found that activation of the PI3K/Akt pathway by IGF-1 stimulated global protein synthesis in bovine mammary epithelial cells through changes in the phosphorylation and association state of components of the mTORC1 signalling pathway (Burgos and Cant Citation2010; Li et al. Citation2017; Cao et al. Citation2019). Furthermore, the PI3K/Akt pathway was found to interact with other signalling pathways that are important for milk protein synthesis, such as the JAK/STAT and MAPK signalling pathways (Bionaz and Loor Citation2011). Thirdly, certain differentially expressed genes obtained in the study during lactation onset and involution were confirmed to overlap with known milk production-associated QTLs in dairy cattle ( and ).
Conclusion
In summary, mammary glands of dairies undergo a gradient of developmental changes including lactation onset, the rise to peak lactation, peak lactation, declining lactation after peak, after milking cessation and gland involution. Therefore, mammary glands will experience a series of gene expression regulations on the developmental changes. Transcriptome analysis of mammary gland tissue of dairy cattle indicates the gene expression regulation during the lactational onset is nearly opposite to that during tissue involution after cessation of milking. The onset of lactation is supported by significantly increased gene expression enriched in transporter and metabolism activities and coupled with significantly decreased immune response gene expression, and the reverse during mammary involution. While the lactation period of milk yield rising to a peak and declining after peak was likely due to gene expression change involved in the common leading biological process of ECM remodelling, thereby contributing to the secretory capacity and/or the number of mammary epithelial cells. Thus, an integrated analysis of differential gene expression indicated that internal development regularities underlying the shape of the milk production curve, providing insights to understand the bovine lactation cycle. Moreover, potential important regulatory genes associated with milk production traits were identified in the study. The discovery in the study should bring inspiration to well understand the mammary biology of dairies, benefiting lactation performance improvement and possible mammary gland disease treatment.
TAAR_2064865_SupplementaryMaterial
Download Zip (2.6 MB)Disclosure statement
No potential conflict of interest was reported by the author(s).
Additional information
Funding
Related Research Data
References
- Akers R. M. 2017. Mammary development and lactation. J Dairy Sci. 100(12):10332–10352.
- Alim MA, Wang P, Wu XP, Li C, Cui XG, Zhang SL, Zhang Q, Zhang Y, Sun D. 2014. Effect of FASN gene on milk yield and milk composition in the Chinese Holstein dairy population. Anim Genet. 45(1):111–113.
- Baldi A, Cheli F, Pinotti L, Pecorini C. 2008. Nutrition in mammary gland health and lactation: advances over eight biology of lactation in farm animals meetings. J Anim Sci. 86:3–9.
- Bauman DE, Mather IH, Wall RJ, Lock AL. 2006. Major advances associated with the biosynthesis of milk. J Dairy Sci. 89:1235–1243.
- Bell AW. 1995. Regulation of organic nutrient metabolism during transition from late pregnancy to early lactation. J Anim Sci. 73:2804–2819.
- Bennewitz J, Reinsch N, Grohs C, Levéziel H, Malafosse A, Thomsen H, Xu N, Looft C, Kühn C, Kalm E. 2003. Combined analysis of data from two granddaughter designs: a simple strategy for QTL confirmation and increasing experimental power in dairy cattle. Genet Sel Evol. 35(3):319–338.
- Bionaz M, Loor JJ. 2011. Gene networks driving bovine mammary protein synthesis during the lactation cycle. Bioinf Biol Insights. 5:83–98.
- Bovenhuis H, Weller JI. 1994. Mapping and analysis of dairy cattle quantitative trait loci by maximum likelihood methodology using milk protein genes as genetic markers. Genetics. 137(1):267–280.
- Burgos SA, Cant JP. 2010. IGF-1 stimulates protein synthesis by enhanced signaling through mTORC1 in bovine mammary epithelial cells. Domest Anim Endocrinol. 38:211–221.
- Camacho C, Coulouris G, Avagyan V, Ma N, Papadopoulos J, Bealer K, Madden TL. 2009. BLAST+: architecture and applications. BMC Bioinform. 10:421.
- Cao QQ, Li HH, Liu X, Yan ZG, Zhao M, Xu ZJ, Wang ZH, Shi KR. 2019. MiR-24-3p regulates cell proliferation and milk protein synthesis of mammary epithelial cells through menin in dairy cows. J Cell Physiol. 234(2):1522–1533.
- Capomaccio S, Milanesi M, Bomba L, Cappelli K, Nicolazzi EL, Williams JL, Ajmone-Marsan P, Stefanon B. 2015. Searching new signals for production traits through gene-based association analysis in three Italian cattle breeds. Anim Genet. 46:361–370.
- Capuco AV, Ellis SE, Hale SA, Long E, Erdman RA, Zhao X, Paape MJ. 2003. Lactation persistency: insights from mammary cell proliferation studies. J Anim Sci. 81:18–31.
- Capuco AV, Wood DL, Baldwin R, McLeod K, Paape MJ. 2001. Mammary cell number, proliferation, and apoptosis during a bovine lactation: relation to milk production and effect of bST. J Dairy Sci. 84:2177–2187.
- Chen D, Zhao X, Li XY, Wang JM, Wang CF. 2018. Milk compositional changes of Laoshan goat milk from partum up to 261 days postpartum. Anim Sci J. 89(9):1355–1363.
- Chowdhury F, Na S, Li D, Poh YC, Tanaka TS, Wang F, Wang N. 2010. Material properties of the cell dictate stress-induced spreading and differentiation in embryonic stem cells. Nat Mater. 9:82–88.
- Cobanoglu O, Zaitoun I, Chang YM, Shook GE, Khatib H. 2006. Effects of the signal transducer and activator of transcription 1 (STAT1) gene on milk production traits in Holstein dairy cattle. J Dairy Sci. 89(11):4433–4437.
- Cohen-Zinder M, Seroussi E, Larkin DM, Loor JJ, van der Wind AE, Lee JH, Band MR, Hernanzdez AG, Lewin HA, Weller J,I, Ron M. 2005. Identification of a missense mutation in the bovine ABCG2 gene with a major effect on the QTL on chromosome 6 affecting milk yield and composition in Holstein cattle. Genome Res. 15:936–944.
- Cole JB, Null DJ. 2009. Genetic evaluation of lactation persistency for five breeds of dairy cattle. J Dairy Sci. 92(5):2248–2258.
- Cole JB, Wiggans GR, Sonstegard TS, Lawlor TJ, Crooker BA, Van Tassell CP, Yang J, Wang SW, Matukumalli LK, Yang D. 2011. Genome-wide association analysis of thirty one production, health, reproduction and body conformation traits in contemporary U.S. Holstein cows. BMC Genomics. 12:408.
- Connor EE, Siferd S, Elsasser TH, Evock-Clover CM, Van Tassell CP, Sonstegard TS, Fernandes VM, Capuco AV. 2008. Effects of increased milking frequency on gene expression in the bovine mammary gland. BMC Genomics. 9:362.
- Coppock CE, Everett RW, Natzke RP, Ainslie HR. 1974. Effect of dry period length on Holstein milk production and selected disorders at parturition. J Dairy Sci. 57:712–718.
- Cui X, Hou Y, Yang S, Xie Y, Zhang S, Zhang Y, Zhang Q, Lu X, Liu G, Sun D. 2014. Transcriptional profiling of mammary gland in Holstein cows with extremely different milk protein and fat percentage using RNA sequencing. BMC Genom. 15:226.
- Davis GE, Senger DR. 2005. Endothelial extracellular matrix: biosynthesis, remodeling, and functions during vascular morphogenesis and neovessel stabilization. Circ Res. 97(11):1093–1107.
- Do DN, Bissonnette N, Lacasse P, Miglior F, Sargolzaei M, Zhao X, Ibeagha-Awemu EM. 2017. Genome-wide association analysis and pathways enrichment for lactation persistency in Canadian Holstein cattle. J Dairy Sci. 100(3):1955–1970.
- Finucane KA, McFadden TB, Bond JP, Kennelly JJ, Zhao FQ. 2008. Onset of lactation in the bovine mammary gland: gene expression profiling indicates a strong inhibition of gene expression in cell proliferation. Funct Integr Genom. 8:251–264.
- Fontanesi L, Buttazzoni L, Scotti E, Russo V. 2012. Confirmation of the association between a single nucleotide polymorphism in the porcine LDHA gene and average daily gain and correlated traits in Italian large white pigs. Anim Genet. 43(5):649–650.
- Gao Y, Lin X, Shi K, Yan Z, Wang Z. 2013. Bovine mammary gene expression profiling during the onset of lactation. PLoS One. 8:e70393.
- Gibson CA, Vega JR, Baumrucker CR, Oakley CS, Welsch CW. 1991. Establishment and characterization of bovine mammary epithelial cell lines. In Vitro Cell Dev Biol Anim. 27A:585–594.
- Guilak F, Cohen DM, Estes BT, Gimble JM, Liedtke W, Chen CS. 2009. Control of stem cell fate by physical interactions with the extracellular matrix. Cell Stem Cell. 5:17–26.
- He L, Pei Y, Jiang Y, Li Y, Liao L, Zhu Z, Wang Y. 2015. Global gene expression patterns of grass carp following compensatory growth. BMC Genomics. 16:184.
- Heck JM, Schennink A, van Valenberg HJF, Bovenhuis H, Visker MHPW, van Arendonk JAM, van Hooijdonk ACM. 2009. Effects of milk protein variants on the protein composition of bovine milk. J Dairy Sci. 92(3):1192–1202.
- Horacek MJ, Thompson JC, Dada MO, Terracio L. 1993. The extracellular matrix components laminin, fibronectin, and collagen IV are present among the epithelial cells forming Rathke's pouch. Acta Anatoica. 147:69–74.
- Hu ZY, Yin ZY, Lin XY, Yan ZG, Wang ZH. 2015. Effects of feeding fatty acid calcium and the interaction of forage quality on production performance and biochemical indexes in early lactation cow. J Anim Physiol Anim Nutr. 99:899–904.
- Huang BF, Boutros PC. 2016. The parameter sensitivity of random forests. BMC Bioinform. 17:331.
- Huang LB, Yuan XJ. 2011. Expression of androgen receptor and estrogen receptor-alpha in the developing pituitary gland of male sheep lamb. Anim Reprod Sci. 127(3–4):164–168.
- Huang W, Peñagaricano F, Ahmad KR, Lucey JA, Weigel KA, Khatib H. 2012. Association between milk protein gene variants and protein composition traits in dairy cattle. J Dairy Sci. 95(1):440–449.
- Hurley WL. 1989. Mammary gland function during involution. J Dairy Sci. 72(6):1637–1646.
- Isaacs A, Lindenmann J. 1957. Virus interference. I. The interferon. Proce R Soc London. 147:258.
- Jiang F, Lin XY, Yan ZG, Hu ZY, Wang Y, Wang ZH. 2018. Effects of forage source and particle size on feed sorting, milk production and nutrient digestibility in lactating dairy cows. J Anim Physiol Anim Nutr. 102(6):1472–1481.
- Kim D, Pertea G, Trapnell C, Pimentel H, Kelley R, Salzberg SL. 2013. Tophat2: accurate alignment of transcriptomes in the presence of insertions, deletions and gene fusions. Genome Biol. 14:R36.
- Kohl M, Wiese S, Warscheid B. 2011. Cytoscape: software for visualization and analysis of biological networks. Methods Mol Biol. 696:291–303.
- Langmead B, Salzberg S. 2012. Fast gapped-read alignment with Bowtie 2. Nat Methods. 9:357–359.
- Li C, Zhen G, Chai Y, Xie L, Crane JL, Farber E, Farber CR, Luo X, Gao P, Cao X, et al. 2016. Rhoa determines lineage fate of mesenchymal stem cells by modulating CTGF-VEGF complex in extracellular matrix. Nat Commun. 7:11455.
- Li D, Zhou J, Chowdhury F, Cheng J, Wang N, Wang F. 2011. Role of mechanical factors in fate decisions of stem cells. Regen Med. 6:229–240.
- Li HH, Liu X, Wang ZH, Lin XY, Yan ZG, Cao QQ, Zhao M, Shi KR. 2017. MEN1/menin regulates milk protein synthesis through mTOR signaling in mammary epithelial cells. Sci Rep. 7:5479.
- Love MI, Huber W, Anders S. 2014. Moderated estimation of fold change and dispersion for RNA-seq data with DESeq2. Genome Biol. 15(12):1–21.
- Lv Y, Wei C, Zhang L, Lu G, Liu K, Du L. 2011. Association between polymorphisms in the SLC27A1 gene and milk production traits in Chinese Holstein cattle. Anim Biotechnol. 22(1):1–6.
- Macciotta NP, Mele M, Conte G, Serra A, Cassandro M, Dal Zotto R, Cappio Borlino A, Pagnacco G, Secchiari P. 2008. Association between a polymorphism at the stearoyl CoA desaturase locus and milk production traits in Italian Holsteins. J Dairy Sci. 91(8):3184–3189.
- Madsen TG, Nielsen MO, Andersen JB, Ingvartsen KL. 2008. Continuous lactation in dairy cows: effect on milk production and mammary nutrient supply and extraction. J Dairy Sci. 91:1791–1801.
- Mao X, Cai T, Olyarchuk JG, Wei L. 2005. Automated genome annotation and pathway identification using the KEGG orthology (KO) as a controlled vocabulary. Bioinformatics. 21(19):3787–3793.
- Marioni JC, Mason CE, Mane SM, Stephens M, Gilad Y. 2008. RNA-seq: an assessment of technical reproducibility and comparison with gene expression arrays. Genome Res. 18:1509–1517.
- McManaman JL, Neville MC. 2003. Mammary physiology and milk secretion. Adv Drug Deliv Rev. 55:629–641.
- Nayeri S, Sargolzaei M, Abo-Ismail MK, Miller S, Schenkel F, Moore SS, Stothard P. 2017. Genome-wide association study for lactation persistency, female fertility, longevity, and lifetime profit index traits in Holstein dairy cattle. J Dairy Sci. 100(2):1246–1258.
- Nemir M, Bhattacharyya D, Li X, Singh K, Mukherjee AB, Mukherjee BB. 2000. Targeted inhibition of osteopontin expression in the mammary gland causes abnormal morphogenesis and lactation deficiency. J Biol Chem. 275:969–976.
- Neville MC, Mcfadden TB, Forsyth I. 2002. Hormonal regulation of mammary differentiation and milk secretion. J Mammary Gland Biol Neoplasia. 7:49–66.
- Postel-Vinay MC, Finidori J, Sotiropoulos A, Dinerstein H, Martini JF, Kelly PA. 1995. Growth hormone receptor, structure and signal transduction. Annu Endocrinolo. 56(3):209–212.
- Prinzenberg EM, Weimann C, Brandt H, Bennewitz J, Kalm E, Schwerin M, Erhardt G. 2003. Polymorphism of the bovine CSN1S1 promoter: linkage mapping, intragenic haplotypes, and effects on milk production traits. J Dairy Sci. 86(8):2696–2705.
- Raven LA, Cocks BG, Hayes BJ. 2014. Multibreed genome wide association can improve precision of mapping causative variants underlying milk production in dairy cattle. BMC Genomics. 15:62.
- Rittling SR, Novick KE. 1997. Osteopontin expression in mammary gland development and tumorigenesis. Cell Growth Differ Mol Biol J Am Assoc Cancer Res. 8:1061–1069.
- Robinson MD, McCarthy DJ, Smyth GK. 2010. Edger: a bioconductor package for differential expression analysis of digital gene expression data. Bioinformatics. 26:139–140.
- Samuel CE. 2001. Antiviral actions of interferons. Clin Microbiol Rev. 14:778–809.
- Schnabel RD, Kim JJ, Ashwell MS, Sonstegard TS, Van Tassell CP, Connor EE, Taylor JF. 2005. Fine-mapping milk production quantitative trait loci on BTA6: analysis of the bovine osteopontin gene. Proc Natl Acad Sci USA. 102:6896–6901.
- Shi KR, Li RR, Xu ZJ, Zhang Q. 2020. Identification of crucial genetic factors, such as PPARγ, that regulate the pathogenesis of fatty liver disease in dairy cows is imperative for the sustainable development of dairy industry. Animals. 10:639.
- Shi KR, Liu X, Li HH, Lin XY, Yan ZG, Cao QQ, Zhao M, Xu ZJ, Wang ZH. 2017. Menin modulates mammary epithelial cell numbers in bovine mammary glands through cyclin D1. J Mammary Gland Biol Neoplasia. 22(4):221–233.
- Shi KR, Niu FG, Zhang Q, Ning C, Yue SJ, Hu CZ, Xu ZJ, Wang SX, Li RR, Hou QL, Wang ZH. 2020. Identification of whole-genome significant single nucleotide polymorphisms in candidate genes associated with serum biochemical traits in Chinese Holstein cattle. Front Genet. 11:163.
- Smith KL, Todhunter DA. 1982. The physiology of mammary glands during the dry period and the relationship to infection. 87.
- Sordillo LM, Shaferweaver K, Derosa D. 1997. Immunobiology of the mammary gland. J Dairy Sci. 80(8):1851.
- Sordillo LM, Streicher KL. 2002. Mammary gland immunity and mastitis susceptibility. J Mammary Gland Biol Neoplasia. 7(2):135–146.
- Sørensen JT, Enevoldsen C. 1991. Effect of dry period length on milk production in subsequent lactation. J Dairy Sci. 74:1277–1283.
- Stefanon B, Colitti M, Gabai G, Knight CH, Wilde CJ. 2002. Mammary apoptosis and lactation persistency in dairy animals. J Dairy Res. 69(1):37–52.
- Stupack DG, Cheresh DA. 2002. ECM remodeling regulates angiogenesis: endothelial integrins look for new ligands. Sci STKE. 119:pe7.
- Stupack DG, Cheresh DA. 2003. Apoptotic cues from the extracellular matrix: regulators of angiogenesis. Oncogene. 22(56):9022–9029.
- Szklarczyk D, Gable AL, Lyon D, Junge A, Wyder S, Huerta-Cepas J, Simonovic M, Doncheva NT, Morris JH, Bork P, et al. 2019. STRING v11: protein-protein association networks with increased coverage, supporting functional discovery in genome-wide experimental datasets. Nucleic Acids Res. 47:D607–D613.
- Tarazona S, García-Alcalde F, Dopazo J, Ferrer A, Conesa A. 2011. Differential expression in RNA-seq: a matter of depth. Genome Res. 21(12):2213–2223.
- Trapnell C, Roberts A, Goff L, Pertea G, Kim D, Kelley DR, Pimentel H, Salzberg SL, Rinn JL, Pachter L. 2012. Differential gene and transcript expression analysis of RNA-seq experiments with TopHat and cufflinks. Nat Protoc. 7(3):562–578.
- Wang HL, Li ZX, Wang LJ, He H, Yang J, Chen L, Niu FB, Liu Y, Guo JZ, Liu XL. 2013. Polymorphism in PGLYRP-1 gene by PCR-RFLP and its association with somatic cell score in Chinese Holstein. Res Vet Sci. 95(2):508–514.
- Williams CM, Engler AJ, Slone RD, Galante LL, Schwarzbauer JE. 2008. Fibronectin expression modulates mammary epithelial cell proliferation during acinar differentiation. Cancer Res. 68:3185–3192.
- Yan ZG, Wang Z, Zhang HQ, Yue SJ, Yin B, Jiang YL, Shi KR. 2019. Identification of whole-genome significant single nucleotide polymorphisms in candidate genes associated with body conformation traits in Chinese Holstein cattle. Anim Genet. 10:12865.
- Yang LJ, Zhou M, Huang LB, Yang WR, Yang ZB, Jiang SZ, Ge JS. 2018. Zearalenone promotes follicle growth through modulation of Wnt-1/β-catenin signaling pathway and expression of estrogen receptor genes in ovaries of post-weaning piglets. J Agric Food Chem. 66(30):7899–7906.