
ABSTRACT
Feathers are important economic products. Anser cygnoide (AC) is superior in reproduction, growth and feather quality, while Anser anser (AA) has an advantage in feather yield. Understanding the development of feather follicles facilitates deliberate crossbreeding. Here, we compared feather follicles morphogenesis between AC and AA. Feathers and dorsal skin were sampled at multiple embryonic days to investigate feather phenotypes, feather follicle morphology and the expression of hub molecules (FZD4, β-catenin, LEF1, TCF4 and c-Myc) in the Wnt signalling pathway. We found a marked difference in plumage colour between the two breeds. Feather colour in AA has undergone a ‘black dorsum’ stage and cavity formation in AC was earlier. Furthermore, different trends in molecular hub expression helped explain the phenotypical and morphological differences: the upregulated Wnt signals in AC at E12 and/or E15, as well as in AA at E18, were associated with early epidermal placode formation and cavity formation in AC, also, related to the development of the secondary feather follicles and ‘black dorsum’ in AA. Summarily, breed-specific expression patterns of Wnt signalling pathway between AC and AA might participate in the shaping of breed-specific feather follicles morphogenesis and feather phenotypes. This work provides references for feather follicles development in geese.
Introduction
Many excellent breeds of geese are bred to meet human demands during long-term domestication (Li et al. Citation2011). ‘Huoyan goose’ (ancestor: Anser cygnoides (AC) (Shi et al. Citation2006; Luan et al. Citation2013)) has superior reproduction performance among the small body-type geese (Luan et al. Citation2013) additionally with innate advantages in environmental adaptability, disease resistance and feather quality (Li et al. Citation2011; Sello et al. Citation2019; Yao et al. Citation2019), which implies that AC is a strong candidate for crossbreeding. However, AC is classified as a small body-type goose, which also determines their limited feather yield. ‘Carlos goose’ (ancestor: Anser anser (AA)), a Europe large body-type goose breed, is accepted as an excellent down producer around the world (Zhu et al. Citation2019) due to their outstanding yield and quality of feathers.
Feather is one of the most important economic productions in the goose industry. Crossbreeding is a common breeding method to integrate goodtraits between breeds. Breeding strategies are a potential way to develop breeds for promoting feather quality and yield. Previous studies have shown that there emerged heterosis in the offspring of AA × AC (Li et al. Citation2011; Zhang et al. Citation2019). Therefore, a better understanding of the differences between AA and AC, including feather follicle development and molecular mechanisms, is needed for serving possible crossbreeding in the future.
Feather follicle is considered as a micro-organ formatted by the interactions between ectoderm and mesoderm (Rishikaysh et al. Citation2014; Chen et al. Citation2015; Ng and Li Citation2018). During the feather follicle morphogenesis, the Wnt signals are the initial signalling morphogens for feather follicle development and participate in multiple stages of feather follicle morphogenesis (Rishikaysh et al. Citation2014; Chen et al. Citation2015; He et al. Citation2018). Thus, in this study, we investigated the feather follicle developmental morphology and the Wnt signals during embryogenesis between AC and AA.
Materials and methods
Experimental animals
Breeder eggs of Huoyan goose and Carlos goose were obtained from Jilin Agricultural University in Jilin Province, Northeast of China, and incubated in an incubator according to the routine procedure. Animal experiment was approved by Animal Health Care Committee of Animal Science and Technology College of Jilin Agricultural University (Approval No. GR (J) 18-003).
Experimental design
A total of 300 eggs of each breed were incubated in a fully automatic incubator with intermittent rotation. Candling was conducted at the embryonic age (E) of 6 days to identify and remove the unfertilized eggs and the dead eembryos. The results showed that the fertilization rate in AC eggs was higher than that in AA eggs (Figure S1a, in file: Supplemental data 1), while the egg weight of AA was significantly (P < 0.01) higher than that of AC (Figure S1b, in file: Supplemental data 1). To ensure morphological integrity and sample adequacy, one embryo was sampled only for each kind of assay. At each embryonic day (E12, 15, 18, 21, 24 and 27), a total of 6 embryos of each breed were randomly selected for feather follicle morphology observations; a total of 3 embryos of each breed were randomly selected for molecular biology assays and a total of 6 embryos of each breed were randomly selected for phenotypical observations and measurement of feather length.
Sampling and data collection
Egg weight was recorded before incubating. Feather phenotypes were observed and photographed before sampling. Feathers from the cross region (about 1.5 cm2) of the midline of dorsum at each embryonic day were cut and measured by a cursor caliper (n = 120 feathers averagely from 6 embryos). The cross region (about 1.5 cm2) of the midline of dorsal skin tissues at E12, 15, 18, 21, 24 and 27 were sampled and stored at −80°C for further qPCR and western blotting assays or fixed in 4% paraformaldehyde for 24 h for further histological processing.
RNA extraction and qPCR
The FZD4, CTNNB1 (encoding β-catenin), LEF1, TCF4 and c-Myc genes expression in dorsal skin tissues were determined by qPCR. The primers are listed in Table S1 (in file: Supplemental data 1). The dorsal skin tissue total RNA of each sample was extracted using an RNAiso Plus Kit (TaKaRa Bio Inc., Shiga, Japan). The quantity and quality of the harvested RNAs were measured using the Micro Drop Ultra-micro spectrophotometer (BIO-DL, Shanghai, China) and the 1.0% agarose gel electrophoresis, respectively. The total RNA of each sample was considered to be valid in the range of 1.9 < OD260/OD280 < 2.0 and 1.8 < 28S/18S ribosomal RNA < 2.0 simultaneously. The cDNA was synthesized for qPCR using a PrimeScript RT Reagent Kit with gDNA Eraser (Morey Biosciences, Shanghai, China). qPCR was performed with an SYBR Green Reagent (Morey Biosciences, Shanghai, China) in a CFX Connect Real-Time PCR Detection System (Bio-Rad, Hercules, CA, USA). The total volume of qPCR reactions was 20 μL comprising 2 μL of cDNA, 0.6 μL of both forward and reverse primers, 6.8 μL of RNase-free H2O and10 μL of SYBR Green Reagent. Amplification conditions were as follows: pre-denaturation at 95°C for 5 min, then 40 cycles of amplification (95°C for 15 s and 59°C for 60 s). Data were calculated by the 2–ΔΔCt method. The β-actin gene was chosen as the control gene to normalize the mRNA expression levels.
Feather follicle morphological observations
The fixed dorsal skin tissues were dehydrated in different concentrations of ethanol and then cleared in xylene. Tissues were embedded in paraffin according to conventional methods. Then, 5-μm thick sections were cut onto gelatinized slides. The sections were stained using haematoxylin and eosin (H&E) and were photographed using a microscope system (Olympus, Tokyo, Japan).
The distribution of feather follicles was observed and photographed from the longitudinal skin sections to measure feather follicles diameters. The number of 60 feather follicles from 6 biological samples of each group was measured using the microscope software. As the distance of the outermost layer is the maximum in feather follicle, that was measured to investigate feather follicle diameter. A total of 10 regions of each transverse skin section were photographed to calculate the number of primary feather follicles (Pfs) and secondary feather follicles (Sfs), which were used to calculate the Pfs density, Sfs density and Sfs/ Pfs ratio.
Immunohistochemical observations
The slides were then succumbed to antigen retrieval by boiling in sodium citrate buffer (pH 6.0) for 20 min after deparaffinization and hydration, and were rinsed with PBS for 5 min of 3 times at the end of each step. Following the steps of deparaffinization, rehydration, and antigen retrieval, sections were blocked with 3% hydrogen peroxide at RT for 20 min and with 3% normal goat serum at RT for 20 min. Sections were incubated overnight at 4°C with 50 μL of rabbit anti-β-catenin antibody (Cat# bs-23663R, bioss, Beijing, China) at 1:100 diluent. Then, slides were incubated respectively with a secondary antibody linked with biotin and an HRP linked streptomycin according to UltraSensitiveTM SP Rabbit IHC Kit (MXB, Fuzhou, Fujian, China) instructions. DAB and haematoxylin were used for chromogen/substrate and nuclear staining, respectively. Finally, the slides were observed and photographed using a microscope system after coverslipping.
Western blotting analysis
The total protein samples for electrophoresis were extracted using radioimmunoprecipitation assay lysis buffer. The total protein concentration was determined by a BCA protein concentration detection kit (Beyotime, Shanghai, China). For each sample, the volume containing 10 μg total protein was pipetted onto a 10% SDS-PAGE. The proteins were transferred to the surface of the PVDF membrane. The membranes were blocked with 5% skim milk and then incubated with primary antibodies at 4°C overnight. The antibodies identifiers and dilutions were as follows: an rabbit anti-β-catenin antibody (Cat# bs-23663R, bioss, Beijing, China), 1:2000; an rabbit anti-c-Myc antibody (Cat# bs-4963R, bioss), 1:2000; an rabbit anti-TCF4 antibody (Cat# bs-1280R, bioss), 1:2000; an rabbit anti-LEF1 antibody (Cat# bs-1843R, bioss), 1:1500; an rabbit anti-FZD4 antibody (Cat# bs-13217R, bioss), 1:2000; an ACTB rabbit monoclonal antibody (Cat# AC026, abclonal, Wuhan, China), 1:50,000.In the end, the membranes were incubated with a goat anti-rabbit IgG (H+L)/HRP antibody secondary antibody (Biosynthesis Biotechnology, Beijing, China) for 1h at RT. Finally, the membranes were visualized with an ECL Test Kit (Millipore, Darmstadt, Germany) under a Bio-Rad imaging system (Bio-Rad, Hercules, CA, USA). Notably, the molecular weights between some proteins are nearby, stripping thereby was used to avoid errors cross gels. A stripping buffer (Solarbio, Beijing, China) was used for 12 min to strip the antibodies bound on membranes, then blocking and antibody incubating were conducted as described above. The chemiluminescence of each protein blotting was quantified using the ImageJ software (NIH, Bethesda, MD, USA). Protein levels were normalized by β-actin as an internal control.
Statistical analyses
Statistical tests were performed with SPSS 23.0 software (IBM, Armonk, NY, USA). The data was visualized using the GraphPad Prism 8 software (GraphPad, San Diego, CA, USA). Statistical significance was determined using Student’s t-test. The significant difference in the data was considered as P < 0.05 and P < 0.01. The results were expressed as mean + SEM in the figures.
Results
Feather phenotype observations during embryogenesis between AC and AA
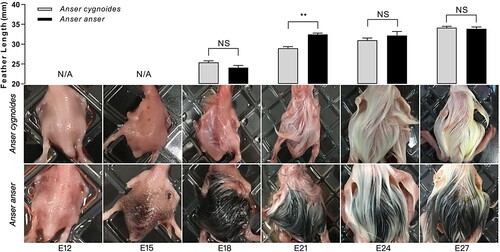
The feather colours have undergone a series of changes between AC and AA during embryogenesis. Differentially, the feather colour in AA experienced a unique black stage. As the phenotypical results show (), at E12, feather buds on the dorsal skin began to protrude clearly in both AC and AA, feather primordium was evenly distributed. At E15, a small part of translucent feathers had appeared on the AC dorsum, while black feathers began to appear on the AA dorsum. By E18, the AC dorsum was covered by obvious translucent feathers, and part of the feathers was coloured white. While the AA dorsum had largely covered by black feathers. By E21, most of the translucent feathers of AC has transformed into white, whilst, the AA dorsum was still covered by black feathers and only a small part of feathers was fading to white. By E24, a few feathers of AC were coloured pale yellow from white. Feathers of AA kept fading to white, while the tip of a small part of the white feather was coloured yellow. Moreover, the feather length of AA was significantly (P < 0.01) longer than that of AC at E21.
Figure 1. Feather phenotype observations during embryogenesis between Anser cygnoide and Anser anser. The measured feather was sampled from the cross-region (about 1.5 cm2) of the midline of the dorsum. Feather length data is shown as mean + SEM, **p < 0.01 by Student’s t-test, n = 120 feathers averagely from 6 embryos.
Feather follicle morphological observations during embryogenesis between AC and AA
The results of feather follicle morphology ((a)) illustrated that the stage from bud to cavity in AC was earlier than AA during feather follicle morphogenesis. At E12, although buds had emerged in both AC and AA, follicles in AC had come into the stage of short bud elongation with anterior-posterior and proximal-distal asymmetries, and the feather direction has been determined. However, buds were still symmetry in AA. At E15, invagination of the epidermis surrounding base into the dermis had led to the formation of follicle cavities in AC, while AA was still in the stage of long bud. At E18, invagination of the epidermis into the dermis was widely occurred, while only a small area invagination began in AA. By E21, invagination was mainly completed in both with similar morphology on the cavity, mesenchymal evenly filled in cavities, the internal structure of feather follicle had not yet differentiated, and follicle antitype was formatted. At E24, the basal tissue of primary feather follicle became dense. The dermal papilla, feather sheath, and outer and inner root sheaths could be observed in both. While at E27, follicle cavities disappeared and it is clear that the inner structures of feather follicles, glands and secondary feather follicles surrounding feather follicles. Sebaceous glands and sweat gland ducts (as signaled by black arrows) emerged and evenly distributed surrounding follicles in AC, while the development of sweat gland in AA was still at the initial stage. Notably, there was melanin deposition during follicle development in AA (as signaled by red arrows).
Figure 2. Feather follicle morphology observations during embryogenesis between Anser cygnoide and Anser anser. (a) Feather follicle diameter and representative photographs as investigated by longitudinal dorsal skin sections. n = 60 follicles averagely from 6 embryos. Bar = 50 or 100 μm. Representative photographs (b) and feather follicle densities (c) as investigated by transverse dorsal skin sections. The investigated tissues were sampled from the cross-region (about 1.5 cm2) of the midline of dorsal skin. n = 60 follicles averagely from 6 embryos. Bar = 100 μm. All data is shown as mean + SEM, **p < 0.01 by Student’s t-test. Abbreviations: Pfs, primary feather follicles; Sfs, secondary feather follicles.
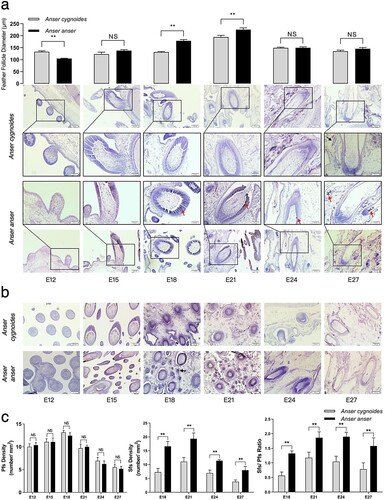
The results of feather follicle diameter ((a)) showed that the level of feather follicle diameter in AC was significantly (P < 0.01) higher than that in AA at E12. However, the level of feather follicle diameter in AA was significantly higher than that in AC at E18 (P < 0.01) and at E21 (P < 0.01). By E24 and E27, the feather follicle diameter and feather length had no statistical difference (P > 0.05) between the two breeds.
In terms of the results of feather follicle density ((b,c)), there was no difference (P > 0.05) in Pfs density at each embryonic day between the two breeds, while Sfs density and Sfs/Pfs ratio in AA were significantly higher than those of AC at E18 (P < 0.01), E21(P < 0.01), E24 (P < 0.01) and E27 (P < 0.01).
Expression of hub molecules in the Wnt signalling pathway in dorsal skin during embryogenesis between AC and AA
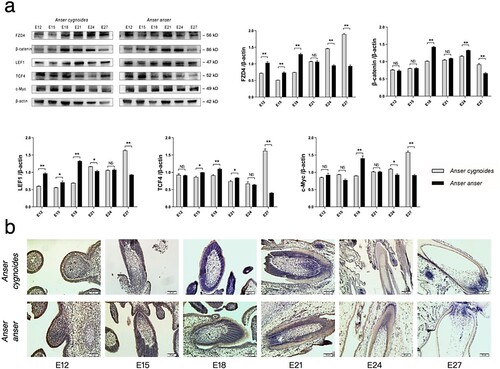
FZD4, β-catenin, LEF1, TCF4 and c-Myc are the most focused and investigated molecules and are considered the hub molecules in the Wnt signalling pathway. The transmembrane spanning receptor: FZD4 has the ability to identify Wnt ligands, then the transducer: beta-catenin is transferred into the nucleus to regulate the transcription factors: LEF1 and TCF4, and finally to regulate the target c-Myc. As the results showed ((a), the raw Western blotting images in Supplemental Data 2), the levels of FZD4, β-catenin, LEF1, TCF4 and c-Myc in AA were significantly (P < 0.01) higher than those in AC at E18, while the levels of these molecules in AA were significantly (P < 0.01) lower than those in AC at E27. Notably, in AC, the tendency among embryonic days illustrated that only the level of β-catenin reached the peak at E24, while the levels of other molecules reaching their peaks were at E27. In AA, the levels of these five hub molecules reached their peaks at E18. Moreover, the transcriptional levels of these molecules were also investigated using qPCR, but there emerged inconsistent tendencies between the transcription and protein levels (Figure S2, in file: Supplemental data 1). The results of IHC ((b)) showed that β-catenin was mainly expressed in the outer root sheath at E18 and in the dermal papilla of the two breeds at E24, while β-catenin was distributed in the feather sheath and the dermal papilla in the two breeds at E27.
Figure 3. Hub molecular expression in the Wnt signalling pathway in dorsal skin tissues during embryogenesis between Anser cygnoide and Anser anser. (a) The levels of FZD4, β-catenin, LEF1, TCF4 and c-Myc as quantified by western blotting. All blots were from the same gels conducting striping. Data is shown as mean + SEM, *p < 0.05 and **p < 0.01 by Student’s t test, n = 3 embryos. (b) β-catenin distribution in feather follicles during morphogenesis as investigated by IHC. The investigated tissues were sampled from the cross region (about 1.5 cm2) of the midline of dorsal skin. Bar = 50 μm.
Discussion
AC and AA have their advantages in reproduction, growth, feather yield and feather quality. In this study, the fertilization rate and egg weight data between AC and AA showed and supported that the Chinese domestic geese breed has better reproduction performance than imported geese breeds in the domestic environment (Li et al. Citation2011). However, AC eggs are smaller than AA eggs, which depends largely on their small body type. Goose feather is an important economic product in the goose industry, it is also essential to understand feather follicle development between the two breeds to provide references for further breeding work. Therefore, this study and the next discussion were focused on the comparisons of feather phenotypes, feather follicle development and the expression of hub molecules in the Wnt signalling pathway between AC and AA during embryogenesis.
In phenotype observation of this study, we found that the feather colour underwent a series of changes between the two breeds. Especially, the feather colour in AA during embryogenesis experienced a unique ‘black dorsum’ stage. The feather length of AC and AA were at a common level at E18, while the feather length of AA was significantly (P < 0.01) higher than that of AC by E21. In birds, the phenomenon of feather colour changing is commonly found during the embryonic period. For example, Xi et al. (Citation2020) reported that there was feather colour variations in light brown mottling ducks during embryonic period. Birds have abundant feather colours (Romero and Fairhurst Citation2016; Voit et al. Citation2020), which are mainly determined and coloured by melanin, carotenoid, and structural colour (Xi et al. Citation2020; Wen et al. Citation2021). In geese, the wild geese with grey plumage are widely accepted as the ancestors of domestic geese (Enshell-Seijffers et al. Citation2010), while most feather colours are white and grey in domesticated geese. Genetic basis determines phenotypes to a large extent (Enshell-Seijffers et al. Citation2010; Wen et al. Citation2021), in part because of the knowledge of genes involved in pigmentation and their developmental interactions, and in another part, because strong selective pressure drives dramatic and quantifiable variation in closely related populations adapting to different environments.
As feather follicle governs feather formation, we next observed and investigated the differences in feather follicle morphology during morphogenesis between AC and AA. Feather follicle morphogenesis is involved in a series of complex interactions between mesoderm and ectoderm beginning with embryogenesis (Rishikaysh et al. Citation2014; Xie et al. Citation2020b) which undergoes consistent morphological changes from epidermal placode formation to bud formation to cavity formation and finally to the follicle (Jiang et al. Citation2011). Based on the morphology data ((a)), it can be found that the stage from bud to a cavity in AC was earlier than that in AA during follicle morphogenesis. Simultaneously, the data on feather follicle diameter showed that feather follicle diameter in AC was significantly (P < 0.01) higher than that in AA at E12, which might be also associated with the earlier feather follicle development from bud to the cavity in AC. AC belongs to the small body type goose with the advantage in growth performance compared to the large type goose AA (Romero and Fairhurst Citation2016; Voit et al. Citation2020), which also supports the faster body development and feather follicle development in AC (Sun et al. Citation2020).
Conversely, the level of feather follicle diameter in AA was significantly higher than that in AC at E18 (P < 0.01) and at E21 (P < 0.01), we speculated that the feather follicle in AA suffered a fast development from E18 to E21. As feather length is affected by follicle diameter (Jenni et al. Citation2020), the abovementioned feather length data supported the dramatic changes in follicle diameter between the two breeds. While, by E24 and E27, feather follicle diameter and feather length had no statistical difference (P > 0.05) between the two breeds, which might be explained by the completion of feather follicle morphogenesis and affiliated structures development near hatching. Moreover, feather colour is associated with pigmentation in the feather follicle (Pshenichnaya et al. Citation2012; Wen et al. Citation2021), the melanin deposition was only found in AA feather follicles, that might be associated with their ‘black dorsum’.
Plumage yield is not only correlated with the body size, but also with feather follicles density. The Pfs and Sfs develop independently (Gong et al. Citation2018), and respectively form feathers and down (Chen et al. Citation2012; Xie et al. Citation2020a). The Sfs start to develop approximately at E18 in geese (Sun et al. Citation2020), this phenomenon is also found in this study (black arrows in (b)). The data of Sfs density and the Sfs/Pfs ratio showed that AA had a higher level of Sfs than AC, which might also be one of the physiological bases supporting AA as a globally recognized excellent down producer. Combining the above results of feather follicle morphology, this study suggests that different developmental processing occurred during the feather follicle morphogenesis between AC and AA, which might determine the feather phenotypic diversity between the two breeds.
Embryonic development, including feather follicle morphogenesis, is a strictly procedural and conservative processes encoding genes to a large extent. The Wnt signalling molecules, as well as fibroblast growth factor (Mukhopadhyay et al. Citation2013), bone morphogenetic protein (Guha et al. Citation2004), Notch/Delt (Zhang et al. Citation2016), and Shh (Mukhopadhyay et al. Citation2013), are the most reported molecules associating with system development and driving the feather follicle development from bud to follicle (Choi et al. Citation2013; Xu et al. Citation2015). Previous studies had confirmed that dorsal skin transcriptome profiling identified a lot of differentially expressed genes in the Wnt signalling pathway during geese embryogenesis (Liu et al. Citation2020). Therefore, to understand the mechanisms of the different feather follicle developmental processing between AC and AA, we investigated the expression levels of the hub molecules in the Wnt signalling pathway. Transcription and protein levels of these hub molecules’ expression were investigated, but they were inconsistent, which might be caused by post-transcriptional regulation (Liu et al. Citation2016). As protein is considered to perform the ultimate biological functions, the next discussion will base on protein level.
β-catenin is the central hub molecule in the Wnt signalling pathway (Huelsken et al. Citation2001; Enshell-Seijffers et al. Citation2010; Yu et al. Citation2020). Similar β-catenin expression tendencies during the embryonic period in the two breeds were first increased (E12-18) and reached the peak at E18 and then decreased (E21-27), which might be induced by cavity formation. Gong et al. (Citation2018) reported that a similar increase in β-catenin expression tendency was observed at the initial stage of cavity formation during feather follicle morphogenesis in chick. In addition, near hatching, the feather follicle developmental stages transition from embryonic period to post-hatching period also require a lot of Wnt signals for feather follicle stem cells differentiation to form nerve, muscle, sebaceous glands, and other tissues (Wang et al. Citation2012). The Wnt signals, LEF1 (Wong and Reiter Citation2011; Zhang et al. Citation2013; Mokry and Pisal Citation2020), TCF4 (Cadigan Citation2012; Mokry and Pisal Citation2020) and c-Myc (Koster et al. Citation2002; Du et al. Citation2018), plays important roles in the sebaceous gland formation and cell proliferation and differentiation. AC and AA embryonic periods are 28 days and 28–30 days, respectively. In this study, the expression of FZD4, LEF1, TCF4 and c-Myc in AC reached the peak at E27, these tendencies might be caused by near hatching. Therefore, our data suggest that the Wnt signalling pathway exists in breed-specific expression mode between the two breeds during feather follicle morphogenesis. The breed-specific signalling regulation modes might participate in the determination of feather phenotypes and feather follicle morphogenesis between breeds.
The Wnt signalling pathway is the initial signal of feather follicle morphogenesis for the epidermal placode formation (at E9–E10 in geese). Massive Wnt signals can be detected at the first stage of follicle morphogenesis (Rishikaysh et al. Citation2014; Gong et al. Citation2018). Wnt signals will reach two peaks at the stages of epidermal placode formation and near hatching (abovementioned) during feather follicle morphogenesis. In this study, we noticed that the levels of part of the hub molecules in AC were significantly (P < 0.05) lower than those in AA at E12 and/or E15 ((a)), while the stage from bud to the cavity in AC was earlier than that in AA as indicated by morphology observations ((a)). Based on these results, we speculate that AC might have earlier experienced epidermal placode formation.
However, the levels of these five hub molecules in AA were significantly (P < 0.01) higher than those in AC at E18, which might be associated with the Sfs development and the ‘black dorsum’ in AA at E18. In the phenotypical and morphological observations of this study, in AA, the ‘black dorsum’ was the most obvious at E18, and melanin deposition was clear in feather follicles. Previous studies have suggested that β-catenin in the epidermal placode can participate in the fate determination of feather colour (Enshell-Seijffers et al. Citation2010; Rabbani et al. Citation2011). c-Myc is essential for melanocyte development, and c-Myc deficiency in embryos affects the proliferation of melanocyte precursors (Koster et al. Citation2002; Rabbani et al. Citation2011; Pshenichnaya et al. Citation2012). Some studies had implied that melanin deposition contributes to feather follicle morphogenesis (Enshell-Seijffers et al. Citation2010), while the understanding is limited. In this study, the levels of β-catenin and c-Myc reached the peaks at E18 and then decreased in AA, which also implies that the special expression mode of the Wnt signalling pathway in AA might be associated with their unique ‘black dorsum’ during embryogenesis.
Conclusions
This study investigated reproduction performance, and mainly compared feather phenotype and feather follicle morphology between AC and AA during embryogenesis, also combined the phenotype and morphology with the expression of the hub molecules in Wnt signalling pathway in an attempt to understand the different feather follicle developmental processing between AC and AA. This work suggests that the breed-specific expression modes of the Wnt signalling pathway between AC and AA might drive and participate in the shaping of breed-specific feather follicle morphogenesis and feather phenotypes. Moreover, for the goose industry and for the future crossbreeding work, this study suggests that AC might be a potential candidate for good breeding with earlier feather follicle morphogenesis. High Sfs density in AA supports that they are globally recognized as down producer. This work provides a reference regarding feather follicle development between AC and AA.
Institutional review board statement
Animal experiment was approved by Animal Health Care Committee of Animal Science and Technology College of Jilin Agricultural University (Approval No. GR (J) 18-003).
TAAR_2066676_Supplementaldata
Download Zip (5.3 MB)Acknowledgements
The authors appreciate the daily management of the goose farm and the operation of the hatching system of Jilin Agricultural University.
Disclosure statement
No potential conflict of interest was reported by the author(s).
Data availability statement
The raw Western blotting images presented in this study are available in the Supplementary Materials.
Additional information
Funding
Related Research Data
References
- Cadigan KM. 2012. TCFS and WNT/beta-catenin signaling: more than one way to throw the switch. In: S. Plaza, F. Payre, editors. Transcriptional switches during development. p. 1–34. San Diego: Academic Press.
- Chen CF, Foley J, Tang PC, Li A, Jiang TX, Wu P, Widelitz RB, Chuong CM. 2015. Development, regeneration, and evolution of feathers. Annu Rev Anim Biosci. 3:169–195. DOI:10.1146/annurev-animal-022513-114127.
- Chen X, Bai H, Li L, Zhang W, Jiang R, Geng Z. 2012. Follicle characteristics and follicle developmental related Wnt6 polymorphism in Chinese indigenous Wanxi-white goose. Mol Biol Rep. 39(11):9843–9848. DOI:10.1007/s11033-012-1850-2.
- Choi YS, Zhang Y, Xu M, Yang Y, Ito M, Peng T, Cui Z, et al. 2013. Distinct functions for Wnt/beta-catenin in Hair Follicle Stem Cell Proliferation and survival and interfollicular epidermal homeostasis. Cell Stem Cell. 13(6):720–733. DOI:10.1016/j.stem.2013.10.003.
- Du K-T, Deng J-Q, He X-G, Liu Z-P, Peng C, Zhang M-S. 2018. MiR-214 regulates the human hair follicle stem cell proliferation and differentiation by targeting EZH2 and Wnt/beta-catenin signaling way in vitro. Tissue Eng Regen Med. 15(3):341–350. DOI:10.1007/s13770-018-0118-x.
- Enshell-Seijffers D, Lindon C, Wu E, Taketo MM, Morgan BA. 2010. Beta-Catenin activity in the dermal papilla of the hair follicle regulates pigment-type switching. Proc Natl Acad Sci U S A. 107(50):21564–21569. DOI:10.1073/pnas.1007326107.
- Gong H, Wang H, Wang Y, Bai X, Liu B, He J, Wu J, Qi W, Zhang W. 2018. Skin transcriptome reveals the dynamic changes in the Wnt pathway during integument morphogenesis of chick embryos. PLoS ONE. 13(1). doi:10.1371/journal.pone.0190933.
- Guha U, Mecklenburg L, Cowin P, Kan L, O'Guin WM, D'Vizio D, Pestell RG, Paus R, Kessler JA. 2004. Bone morphogenetic protein signaling regulates postnatal hair follicle differentiation and cycling. Am J Pathol. 165(3):729–740. DOI:10.1016/s0002-9440(10)63336-6.
- He N, Dong Z, Tai D, Liang H, Guo X, Cang M, Liu D. 2018. The role of Sox9 in maintaining the characteristics and pluripotency of Arbas Cashmere goat hair follicle stem cells. Cytotechnology. 70(4):1155–1165. DOI:10.1007/s10616-018-0206-8.
- Huelsken J, Vogel R, Erdmann B, Cotsarelis G, Birchmeier W. 2001. Beta-Catenin controls hair follicle morphogenesis and stem cell differentiation in the skin. Cell. 105(4):533–545. DOI:10.1016/s0092-8674(01)00336-1.
- Jenni L, Ganz K, Milanesi P, Winkler R. 2020. Determinants and constraints of feather growth. PLoS ONE. 15(4). doi:10.1371/journal.pone.0231925.
- Jiang T-X, Tuan TL, Wu P, Widelitz RB, Chuong C-M. 2011. From buds to follicles: matrix metalloproteinases in developmental tissue remodeling during feather morphogenesis. Differentiation. 81(5):307–314. DOI:10.1016/j.diff.2011.03.004.
- Koster MI, Huntzinger KA, Roop DR. 2002. Epidermal differentiation: transgenic/knockout mouse models reveal genes involved in stem cell fate decisions and commitment to differentiation. J Investig Dermatol Symp Proc. 7(1):41–45. DOI:10.1046/j.1523-1747.2002.19639.x.
- Li HF, Zhu WQ, Chen KW, Xu YH, Xu WJ, Song W. 2011. Two maternal origins of Chinese domestic goose. Poult Sci. 90(12):2705–2710. DOI:10.3382/ps.2011-01425.
- Liu C, Sello CT, Sui Y, Hu J, Chen S, Msuthwana P, Zhou Y, Wachiebine SK, Sun Y, Liu J, et al. 2020. Characterization of embryonic skin Transcriptome in Anser cygnoides at three feather follicles developmental stages. G3-Genes Genomes Genet. 10(2):443–454. DOI:10.1534/g3.119.400875.
- Liu YS, Beyer A, Aebersold R. 2016. On the dependency of cellular protein levels on mRNA abundance. Cell. 165(3):535–550. DOI:10.1016/j.cell.2016.03.014.
- Luan X, Cao Z, Xu W, Gao M, Wang L, Zhang S. 2013. Gene expression profiling in the pituitary gland of laying period and ceased period Huoyan Geese. Asian-Australas J Anim Sci. 26(7):921–929. DOI:10.5713/ajas.2013.13083.
- Mokry J, Pisal R. 2020. Development and maintenance of epidermal stem cells in skin adnexa. Int J Mol Sci. 21(24). DOI:10.3390/ijms21249736.
- Mukhopadhyay A, Krishnaswami SR, Cowing-Zitron C, Hung N-J, Reilly-Rhoten H, Burns J, Yu BD. 2013. Negative regulation of Shh levels by Kras and Fgfr2 during hair follicle development. Dev Biol. 373(2):373–382. DOI:10.1016/j.ydbio.2012.10.024.
- Ng CS, Li WH. 2018. Genetic and molecular basis of feather diversity in birds. Genome Biol Evol. 10(10):2572–2586. DOI:10.1093/gbe/evy180.
- Pshenichnaya I, Schouwey K, Armaro M, Larue L, Knoepfler PS, Eisenman RN, Trumpp A, Delmas V, Beermann F. 2012. Constitutive gray hair in mice induced by melanocyte-specific deletion of c-Myc. Pigment Cell Melanoma Res. 25(3):312–325. DOI:10.1111/j.1755-148X.2012.00998.x.
- Rabbani P, Takeo M, Chou W, Myung P, Bosenberg M, Chin L, Taketo MM, Ito M. 2011. Coordinated activation of Wnt in epithelial and melanocyte stem cells initiates pigmented hair regeneration. Cell. 145(6):941–955. DOI:10.1016/j.cell.2011.05.004.
- Rishikaysh P, Dev K, Diaz D, Qureshi WMS, Filip S, Mokry J. 2014. Signaling involved in hair follicle morphogenesis and development. Int J Mol Sci. 15(1):1647–1670. doi:10.3390/ijms15011647.
- Romero LM, Fairhurst GD. 2016. Measuring corticosterone in feathers: strengths, limitations, and suggestions for the future. Comp Biochem Physiol a-Mol Integr Physiol. 202:112–122. doi:10.1016/j.cbpa.2016.05.002.
- Sello CT, Liu C, Sun Y, Msuthwana P, Hu J, Sui Y, Chen S, Zhou Y, Lu H, Xu C, et al. 2019. De novo assembly and comparative transcriptome profiling of Anser anser and Anser cygnoides geese species’ embryonic skin feather follicles. Genes (Basel). 8;10(5):351. DOI:10.3390/genes10050351.
- Shi XW, Wang JW, Zeng FT, Qiu XP. 2006. Mitochondrial DNA cleavage patterns distinguish independent origin of Chinese domestic geese and Western domestic geese. Biochem Genet. 44(5-6):237–245. DOI:10.1007/s10528-006-9028-z.
- Sun Y, Zhou Y, Msuthwana P, Liu J, Liu C, Sello CT, Song Y, Feng Z, Li S, Yang W, et al. 2020. The role of CTNNB1 and LEF1 in feather follicles development of Anser cygnoides and Anser anser. Genes Genomics. 42(7):761–771. DOI:10.1007/s13258-020-00950-8.
- Voit M, Merle R, Baumgartner K, von Fersen L, Reese L, Ladwig-Wiegard M, Will H, Tallo-Parra O, Carbajal A, Lopez-Bejar M, et al. 2020. Validation of an alternative feather sampling method to measure corticosterone. Animals (Basel). 10(11):2054. DOI:10.3390/ani10112054.
- Wang H-D, Yang L, Yu X-J, He J-P, Fan L-H, Dong Y-J, Dong C-S, Liu T-F. 2012. Immunolocalization of beta-catenin and Lef-1 during postnatal hair follicle development in mice. Acta Histochem. 114(8):773–778. DOI:10.1016/j.acthis.2012.01.004.
- Wen J, Shao P, Chen Y, Wang L, Lv X, Yang W, Jia Y, Jiang Z, Zhu B, Qu L. 2021. Genomic scan revealed KIT gene underlying white/gray plumage color in Chinese domestic geese. Anim Genet. 52(3):356–360. DOI:10.1111/age.13050.
- Wong SY, Reiter JF. 2011. Wounding mobilizes hair follicle stem cells to form tumors. Proc Natl Acad Sci U S A. 108(10):4093–4098. DOI:10.1073/pnas.1013098108.
- Xi Y, Liu H, Li L, Xu Q, Liu Y, Wang L, Ma S, Wang J, Bai L, Zhang R, et al. 2020. Transcriptome reveals multi pigmentation genes affecting dorsoventral pattern in avian body. Front Cell Dev Biol. 8:560766. DOI:10.3389/fcell.2020.560766.
- Xie WY, Chen MJ, Jiang SG, Yan HC, Wang XQ, Gao CQ. 2020a. Investigation of feather follicle morphogenesis and the expression of the Wnt/beta-catenin signaling pathway in yellow-feathered broiler chick embryos. Br Poult Sci. 61(5):557–565. DOI:10.1080/00071668.2020.1758302.
- Xie WY, Chen MJ, Jiang SG, Yan HC, Wang XQ, Gao CQ. 2020b. The Wnt/beta-catenin signaling pathway is involved in regulating feather growth of embryonic chicks. Poult Sci. 99(5):2315–2323. DOI:10.1016/j.psj.2020.01.002.
- Xu, Z., W. Wang, K. Jiang, Z. Yu, H. Huang, F. Wang, B. Zhou, and T. Chen. 2015. “Embryonic attenuated Wnt/beta-catenin signaling defines niche location and long-term stem cell fate in hair follicle.” Elife 4. DOI:10.7554/eLife.10567.
- Yao Y, Yang YZ, Gu TT, Cao ZF, Zhao WM, Qin HR, Xu Q, Chen GH. 2019. Comparison of the broody behavior characteristics of different breeds of geese. Poult Sci. 98(11):5226–5233. DOI:10.3382/ps/pez366.
- Yu N, Hu T, Yang H, Zhang L, Song Q, Xiang F, Yang X, Li Y. 2020. Twist1 contributes to the maintenance of some biological properties of dermal papilla cells in vitro by forming a complex With Tcf4 and beta-catenin. Front Cell Dev Biol. 8. DOI:10.3389/fcell.2020.00824.
- Zhang H, Nan W, Wang S, Zhang T, Si H, Wang D, Yang F, Li G. 2016. Epidermal growth factor promotes proliferation of dermal papilla cells via Notch signaling pathway. Biochimie. 127:10–18. DOI:10.1016/j.biochi.2016.04.015.
- Zhang Y, Yao Y, Wang MM, Yang YZ, Gu TT, Cao ZF, Lu L, An C, Wang JW, Chen GH, et al. 2019. Comparisons in geese of the courtship, mating behaviors and fertility of the Carlos and Sichuan breeds and the breed crosses. Anim Reprod Sci. 204:86–94. DOI:10.1016/j.anireprosci.2019.03.008.
- Zhang Y, Yu J, Shi C, Huang Y, Wang Y, Yang T, Yang J. 2013. Lef1 contributes to the differentiation of bulge stem cells by nuclear translocation and cross-talk with the Notch signaling pathway. Int J Med Sci. 10(6):738–746. DOI:10.7150/ijms.5693.
- Zhu HX, Liu XQ, Hu MD, Lei MM, Chen Z, Ying SJ, Yu JN, Dai ZC, Shi ZD. 2019. Endocrine and molecular regulation mechanisms of the reproductive system of Hungarian white geese investigated under two artificial photoperiodic programs. Theriogenology. 123:167–176. DOI:10.1016/j.theriogenology.2018.10.001.