
 ?Mathematical formulae have been encoded as MathML and are displayed in this HTML version using MathJax in order to improve their display. Uncheck the box to turn MathJax off. This feature requires Javascript. Click on a formula to zoom.
ABSTRACT
In the formulation of rations for guinea pigs, the energy value of the food and the requirements should be expressed as digestible energy (DE) or metabolizable energy (ME); the chemical composition tables do not report values for this species. The conventional determination of DE and ME of the feedstuffs requires animal experimentation, personnel, and specialized high-cost equipment. Study objective was developed mathematical models to estimate DE and ME using chemical composition and digestibility data from 26 forages, 8 dry agro-industrial wastes and 23 concentrated feeds, generated in previous studies using 5 male guinea pigs aged 5–6 months at 600–700 g of weight in each trial. Multiple hierarchical linear regression in SPSS 23 was used to generate the prediction models. Equations based on total digestible nutrient content served as standard equations for comparison with models generated based on . The best fitted equations for predicting ME content were those using DE (
= 0.966), and dry matter, crude protein, crude fiber, organic matter, and organic matter digestibility (
= 0.910). Other equations were generated to predict DE and ME of guinea pig feeds, using other proximal components and digestibility coefficients, with
greater than 0.9.
1. Introduction
In the Andean and developing countries, the guinea pig (Cavia porcellus) is of great socio-economic and nutritional importance, and contributes to food security (Lammers et al. Citation2009; Castro and Chirinos Citation2015). In Peru, annual guinea pig consumption exceeds 21 thousand tons of meat produced by a population of more than 17.4 million guinea pigs; Whit this, a per capita consumption of 0.66 kg per inhabitant per year was reaches (ENA Citation2017). By 2019, the consumption of guinea pig meat is growing, due to the importance of the nutritional value of its meat and the different forms of its presentation, with Peru being the world's largest exporter of guinea pig meat, with a 77.6% share of the international market. In 2019, exports totalled 11.6 tonnes, an increase of 16.6% over 2018. The United States buys 99.9% of total guinea pig meat exports (MIDAGRI Citation2020). This increase in exports and domestic consumption requires guinea pigs of greater size and quality, and their feeding programmes must be improved, requiring accurate information on the nutritional value of their feedstuffs.
To obtain guinea pigs of good weight and carcass quality, properly formulated diets should be used (Castro-Bedriñana and Chirinos-Peinado Citation2020); but there are no specific food composition tables for guinea pigs (Guevara et al. Citation2008; Rostagno et al. Citation2011; FEEDNA Citation2018; NAS Citation2019; USDA Citation2019) and digestible energy (DE) or metabolizable energy (ME) values of other minor species are used.
For guinea pig growth, the North American National Research Council, 25 years ago, recommended the use of diets with 2800 and 3000 kcal/kg (NRC Citation1995), considering them as laboratory animals, with daily weight gains of 5–7 grams during growth (NRC Citation1995; Bindelle et al. Citation2009) and not like meat; furthermore, the guinea pig used for consumption differs from the experimental or mascot guinea pig (Spotorno et al. Citation2006) and their requirements cannot be extrapolated to meat guinea pigs (Guevara et al. Citation2008), to therefore research is needed on the subject.
The conventional determination of DE or ME requires experimental tests and laboratory analysis, which implies the availability of facilities, equipment and specialized personnel, and are of high cost, being an alternative to estimate them from the caloric yield of their proximal chemical components (AEC Citation1978; Moir et al. Citation1980).
Gross energy (GE) does not indicate the level of energy available, since during the digestive and metabolic processes there are energy losses in feces, urine, gas formation and caloric increase (McDonald et al. Citation2010).
Dietary energy is used for growth, maintenance, production and reproduction of animals (Osorio-Carmona et al. Citation2012; Kassa Citation2019) and can be expressed in terms of total digestible nutrients (TDN), DE and ME.
TDN is estimated from digestibility tests (Stein et al. Citation2007; USDA Citation2008) by measuring the amount of food ingested versus absorbed (Clemente et al. Citation2003; Bindelle et al. Citation2009; McDonald et al. Citation2010; Castro et al. Citation2017, Citation2018; Castro-Bedriñana and Chirinos-Peinado Citation2020).
The DE is the GE ingested minus the energy lost in the feces. ME is the DE minus energy lost in urine and intestinal fermentation gases (Crampton and Harris Citation1974; Van Amburgh et al. Citation2015; Weiss and Tebbe Citation2019) and are determined using direct calorimetry and expensive and often inaccessible breathing chambers (Castrillo et al. Citation2009; McDonald et al. Citation2010). DE and ME are energy terms of higher biological accuracy than TDN (NRC Citation1995, Citation2006; NAS Citation2019), and could be estimated from predictive equations based on proximal chemical composition and digestibility coefficients (Kienzle Citation2002; USDA Citation2008; Castrillo et al. Citation2009; Shi et al. Citation2015).
In this context, the research objective was to generate equations to predict DE and ME of meat guinea pig foods, from the TDN content and the proximal chemical composition and digestibility data generated in various trials carried out by the authors at the National University of Central Peru.
2. Materials and methods
The research was approved by the Special Committee of the Research Institute – FEDU-2019.
2.1. Place and period of the study
The study was conducted in 2019, in the district of El Tambo, Huancayo, at an altitude of 3240 m, south latitude 11° 51′ 00″, west longitude 77° 22′ 24″, rainfall of 625 mm/year, maximum relative humidity 83% and minimum 67%, and average temperature 12°C.
The digestibility room where the metabolic cages for the different trials were located had adequate environmental conditions for guinea pig rearing. The temperature was between 16°C and 18°C, the relative humidity was between 70% and 73%, and the light–dark period cycle was 12–13 h of lighting and 7–8 h of darkness.
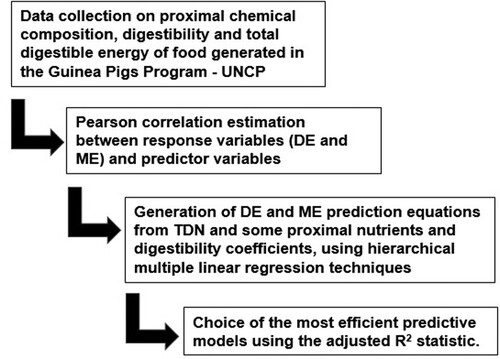
The process followed in the investigation is summarized in four phases ().
Figure 1. Sequence of the investigation procedure.
2.2. Chemical composition, digestibility coefficients and TDN
Chemical composition, digestibility and TDN data generated in 57 digestibility studies, including 26 fodder crops, 8 dry agro-industrial residues and 23 feed concentrates, were used to build the predictive models for DE and ME.
The proximate chemical composition of feedstuffs and feces, in percentage, was determined following AOAC protocols (AOAC Citation1990), considered the specific protocols 934.01 for moisture, 942.05 for ash, 954.01 for crude protein, for 920.39 ether extract and 962.09 for crude fiber.
Five male guinea pigs 5–6 months old, of similar weight (600–700 g), in good health, and housed in individual metabolic cages were used in each digestibility test. The number of animals used per experimental group was in line with international recommendations on the care and use of animals for research (Schofield et al. Citation2014). A total of 285 experimental animals were used in the 57 digestibility trials.
In the pre-experimental phase of the digestibility trials, the conventional feed (Lolium multiflorum) was gradually replaced by the experimental diets and water + vitamin C, using nipple drinkers, over a period of 7–10 days, depending on the type of feed evaluated, until the guinea pigs consumed only the study feeds. The amount of vitamin C was 500 mg/L of water, with each animal being offered 50 ml/day.
In all digestibility trials, during 7-day experimental phase, feed consumption was accurately measured and the total faecal matter produced daily by each guinea pig was collected, considering that the faeces produced on day 2 corresponded to the feed intake of day 1, until complete 7 days of faecal collection. The faeces were weighed, dried, ground and homogenized for chemical analysis. The metabolic cages had their fecal collection devices free of urine contamination (Fan et al. Citation2017; Castro-Bedriñana and Chirinos-Peinado Citation2020).
The amount of faeces produced daily by each guinea pig varied depending on the type of feed and amount ingested per day. From the data obtained with the 57 feeds evaluated, the daily faeces production ranged from 2.3 to 23.2 grams with an average of 9.8 grams and a standard deviation of 4.2 grams.
2.3. Feeds used in the generation of prediction equations
To build the models for predicting DE and ME content, the values of TDN, dry matter (DM), crude protein (CP), ether extract (EE), crude fiber (CF), nitrogen-free extract (NFE), ash (A) and the digestibility coefficients of forages, dry agro-industrial waste and concentrated feed were used.
The green forages included in the study were Phalaris tuberoarundinacea, leaves and roots of Daucus carota, Schoenoplectus californicus at different ages, Medicago sativa, Lolium multiflorum, Lolium perenne, fresh peel of Solanum tuberosum, and Brassica oleracea, Capitata and Viridis varieties. The concentrated feeds included cow's blood meal (raw and cooked), donkey blood meal (raw and cooked), fish guts meal (raw and cooked), recovered guinea pig meat meal (raw, cooked with and without salt), fish meal, earthworm meal (Eisenia foetida) and Lupinus mutabilis meal (bitter and unbitter, with and without the addition of methionine and lysine). Eight agro-industrial residues available in the area were included: maca stubble (Lepidium meyenii), dried broad bean husk (Vicia faba), pea husk (Pisum sativum), roasted barley bran (Hordeum vulgare), wheat bran (Triticum aestivum), kiwicha peel (Amaranthus caudatus), quinoa peel (Chenopodium quinoa) and tarwi peel (Lupinus mutabilis). This variety of inputs allows to have breadth of data that allows to generate predictive equations of its nutritional value based on data on chemical composition and digestibility.
2.4. Study response variables
2.4.1. Digestible energy
In order to complete the data matrix with DE values these were estimated from the TDN content (DE Kcal / kg = 44.09 × TDN%) (Crampton and Harris Citation1974; Weiss et al. Citation1992; McDonald et al. Citation2010; Weiss and Tebbe Citation2019); for this reason, the prediction equation of DE generated from TDN was considered as the standard equation, with which the accuracy of the prediction equations of DE from the proximal chemical composition and digestibility of some nutritional components was compared.
2.4.2. Metabolizable energy
ME values were estimated considering that ME = 0.82 × DE (NRC Citation2000; Aguilera Citation2001; Bakarat et al. Citation2013; Galyean et al. Citation2016; Weiss and Tebbe Citation2019); therefore, similarly in DE case, the ME prediction equation generated from TDN was also considered as the standard equation, with which the efficiency of the ME prediction equations generated from the proximal chemical composition and digestibility of some nutritional components was compared.
To evaluate the accuracy of the prediction equations of DE and ME, the adjusted coefficient of determination was used ().
2.5. Prediction equations and statistical analysis
To generate the prediction equations, first Pearson's correlations between DE and ME and their corresponding predictors were determined. With the variables significantly correlated, predictive models were generated using multiple hierarchical linear regression techniques (Supo Citation2016). The efficiency of the models was determined on the basis of the highest value, to those value allows the selection of the best models and the closer to 1 the model is able to explain a large proportion of the variance of the response variable (James et al. Citation2013).
To identify the differences between the means of the observed and estimated DE and ME values with the prediction equations, the student t-tests were performed for the independent means, with P < 0.05.
2.6. Statement of ethics
Not applicable. The present study is based on the analysis of secondary data generated in research conducted by the authors; however, it is important to report that the guinea pigs used in all the digestibility trials were housed in metabolic cages located in the well ventilated and well-lit digestibility room. All procedures related to the handling and treatment of the animals followed ethical standards of animal welfare in research.
3. Results
3.1. Digestible energy prediction
The energy value of DE in guinea pig feeds is positively correlated with the contents of CP, EE and OM and with their digestibility coefficients (P < 0.05), and is negatively correlated with the contents of CF and A (P < 0.05) ().
Table 1. Correlations (R) between DE content (kcal / kg) with proximal chemical composition and digestibility percentages (N = 51).
The means difference test between the observed DE value and the predicted value by the equations generated considering the proximal chemical components and digestibility coefficients (DEp) as predictors shows that there were no significant differences (P > 0.05; ), indicating that these equations can be used to accurately estimate the DE content of various guinea pig feeds.
Table 2. Equations to predict DE from some values of proximal chemicals composition and digestibility coefficients.
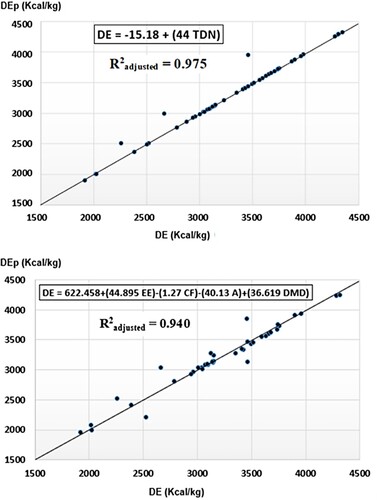
Scatter plots that relate the predicted and observed DE values to prediction equations 1 and 2 are shown in .
Figure 2. Scatter plots that relate the predicted and observed DE values to prediction equations 1 and 2.
3.2. Metabolizable energy prediction
ME value was positively correlated with the contents of CP, EE and OM, and digestibility coefficients of DM, CP, EE, CF and OM (P < 0.05), and negatively correlated with the contents of CF and A (P < 0.05) ().
Table 3. Correlations (R) between ME content (kcal / kg) with predictors.
The means difference test between the observed ME value and the predicted value (MEp) by the equations generated considering the proximal chemical components and digestibility coefficients as predictors shows that there were no significant differences (P > 0.05; ), indicating that these equations can be used to accurately estimate the ME content of various guinea pig feeds.
Table 4. Equations to predict ME from some values of proximal chemicals composition and digestibility coefficients.
With the use of these prediction equations, the contribution of ME from different guinea pig foods can be estimated and more efficient rations can be formulated to improve performance in guinea pig meat production.
In all cases, the Durbin-Watson value was between 1 and 3 and allows the assumption of independence from errors to be considered; therefore, the estimates of the model parameters have quality criteria and the linear adjustments were satisfactory. The Durbin-Watson statistics measure the degree of autocorrelation between the waste corresponding to each observation and the previous one. If its value is close to 2, then the residues are not correlated, if it is close to 4, they will autocorrelated negatively and if its value is close to 0, they will autocorrelated positively. In our case, the values indicate uncorrelated waste.
The standard equation for predicting ME from TDN had an to 0.999. The equation generated with the predictor variable DE had
to 0.98. The other equations also have an
greater than 0.9 and can be used to predict ME for guinea pig feeding.
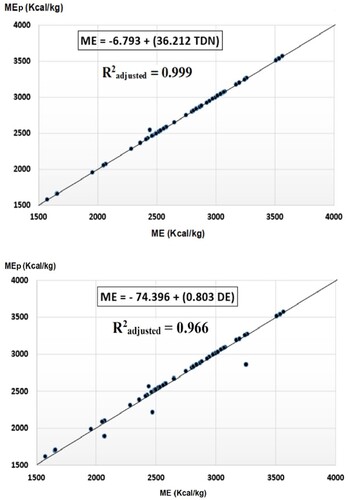
Scatter plots that relate the predicted and observed ME values to prediction equations 1 and 2 are shown in .
Figure 3. Scatter plots that relate the predicted and observed ME values to prediction equations 1 and 2.
The DE and ME observed values and estimated with the prediction equations of the studies foods were similar (P > 0.05), which indicates the validity of the prediction equations; therefore, these equations can be used to energetically value the guinea pigs’ foods.
4. Discussion
DE and ME contents of guinea pig feeds were positively correlated with the level of CP, EE, and OM (P < 0.05) and negatively correlated with the contents of CF and A (P < 0.05), also observed in other animal nutrition studies (McDonald et al. Citation2010; Villalobos and Sánchez Citation2010; Hall and Eastridge Citation2014; Jayanegara et al. Citation2019); and although the guinea pig is an herbivore, it obtains more metabolizable energy from foods with higher protein content than fibrous foods ( and ); since the lignocellulosic fraction has little or no digestibility (NRC Citation2006; Félix et al. Citation2012; Riaz et al. Citation2014; Harahap et al. Citation2018). It is known that FC has the property of accelerating the passage of feedstuffs through the digestive tract decreasing the digestibility of other nutrients (Faber et al. Citation2011).
Available energy increases with the concentration of raw protein in the diet (Tshibangu et al. Citation2014), as observed in this study. For example, in cattail (Scirpus californicus) without and with inflorescence the contents of CP, CF, TDN, and ME were 14.7% and 11.9%, 27.9% and 30.9%, 70.2% and 55.5%, and 2569 and 2068 kcal/kg, respectively, noting that the older the forage is less digestible (Keys et al. Citation1970) and therefore provides less energy (Meza et al. Citation2014; Sotelo et al. Citation2016).
The prediction equations for DE and ME generated in this study have a high degree of accuracy; the for the DE equations are above 0.94, and for the ME equations are above 0.90; noting that the best predictor of DE and ME is the TDN content (
= 0.975 and 0.999, respectively); so, if breeders have data in TDN they can easily transform to ME by applying the corresponding equation.
If the TDN feedstuffs value is not available, equation 2 () can be used to predict DE from the content of EE, CF, A and DMD ( = 0.94), minimizing the costs of full proximal chemical analysis and calorimetry studies. Equation 3 includes in the predictors of equation 2 the CP content, which leads to having all the proximal analysis of the feedstuffs plus the DMD coefficient (
= 0.94).
Equations 4, 5, and 6 for the prediction of DE were developed to compare their accuracy with the first 3 equations and it is evident that the inclusion of more prediction variables increases costs for chemical analysis but does not substantially increase the accuracy of the predictions.
In the case of the ME, the first two equations in allow it to be predicted from the TDN or DE with high precision ( = 0.999 and 0.966). These results are important because there is information on the TDN and DE values of guinea pig food and they can be transformed into ME.
If TDN or DE–based data are not available, equations 3, 4, or 5, which include a larger number of predictor variables (DE, CP, and OM plus OMD or DMD) could be used but would require more laboratory analysis and digestibility tests, which would increase costs.
Our results agree with other studies reporting high precision equations ( to 0.99) to estimate DE and ME considering some chemical or nutritional feed indicators as predictors (Aguilera Citation2001; Laflamme Citation2001; Castrillo et al. Citation2009; Shi et al. Citation2015).
The estimation of the ME from the equations generated in this study will allow the formulation of rations with a higher level of precision in correspondence to the nutritional needs of the meat guinea pigs, which would allow for an improvement in the growth rate (Chung et al. Citation2015; Ahn et al. Citation2019).
5. Conclusions
The equations for predicting DE and ME from TDN, or from CP, CF, EE, A, OM and DMD, OMD, CPD or EED, generally give very accurate predictions for guinea pig feeding.
The ME values estimated with the prediction equations generated in this study will allow the formulation of diets closer to the nutritional needs of the guinea pigs for meat, adequately balancing all the nutrients, reducing the costs that would represent making experimental and laboratory tests to determine the energy availability of the food, since the amount of analysis and testing is reduced when using the prediction equations, obtaining precise values of ME, information that is not currently available for most guinea pig foods.
The use of these equations will allow producers in countries where guinea pig meat contributes to food security, to improve the productive performance of their animals, especially benefiting poor families in the Andean region and other continents where guinea pig breeding is being developed.
The method of evaluating nutritional quality in vivo through digestibility tests has been shown to provide good predictions of DE and ME in a wide range of guinea pig foods (green fodder, dried fodder, agro-industrial waste, protein meals of plant and animal origin) and mathematical modelling has proven to be a very useful tool as an alternative method to estimate the energy contribution of foods.
Disclosure statement
No potential conflict of interest was reported by the author(s).
Additional information
Funding
References
- AEC. Alimentation Equilibrée de Commentry (AEC). 1978. Animal feeding: energy, amino acids, vitamins, minerals. Paris: Doc. No.4. AEC, Commentry, France.
- Aguilera JF. 2001. Aportaciones al conocimiento de la nutrición energética de pequeños rumiantes, con particular referencia al ganado caprino. Arch Zootec. 50(192):565–596.
- Ahn JS, Son GH, Kim MJ, Choi CS, Lee CW, Park JK, Kwon EG, Shin JS, Park BK. 2019. Effect of total digestible nutrients level of concentrates on growth performance, carcass characteristics, and meat composition of Korean Hanwoo steers. Food Sci Anim Resour. 39(3):388–401. doi:10.5851/kosfa.2019.e32.
- AOAC. 1990. Official methods of analysis of the AOAC. 15th ed. Arlington, VA, USA: Association of Official Analytical Chemists.
- Bakarat N, Laudadio V, Cazzato E, Tufarelli V. 2013. Potential contribution of retama raetam (forssk.) webb & berthel as a forage shrub in Sinai, Egypt. Arid Land Res Manag. 27:257–271. doi:10.1080/15324982.2012.756561.
- Bindelle J, Kinsama A, Picron P, Umba di M’Balu J, Kindele E, Buldgen A. 2009. Nutritive value of unconventional fibrous ingredients fed to guinea pigs in the Democratic Republic of Congo. Trop Anim Health Prod. 41(8):1731–1740. doi:10.1007/s11250-009-9372-1.
- Castrillo C, Hervera M, Baucells MD. 2009. Methods for predicting the energy value of pet foods. R Bras Zootec. 38(1):1–14 (supl. especial). doi:10.1590/S1516-35982009001300001.
- Castro-Bedriñana J, Chirinos-Peinado D. 2020. Digestibility, digestible and metabolizable energy of earthworm meal (Eisenia foetida) included in two levels in guinea pigs (Cavia Porcellus). Adv Sci Technol Eng Syst J. 5(3):171–177. doi:10.25046/aj050323.
- Castro J, Chirinos D. 2015. Impact of a comprehensive intervention on food security in poor families of Central Highlands of Peru. Food and Public Health. 5(6):213–219. doi:10.5923/j.fph.20150506.02.
- Castro J, Chirinos D, Calderón J. 2018. Nutritional quality of maca stubble (Lepidium peruvianum Chacón) in guinea pigs. Rev Inv Vet Perú. 29(2):410–418. doi:10.15381/rivep.v29i2.13405.
- Castro J, Chirinos D, Páucar C. 2017. Alkaline treatment (NaOH) effect in the dry matter and protein digestibility of california bulrush (Scirpus californicus) in guinea pigs (Cavia porcellus). Rev Inv Vet Perú. 28(1):86–91. doi:10.15381/rivep.v28i1.11793.
- Chung KY, Chang SS, Lee EM, Kim HJ, Park BH, Kwon EG. 2015. Effects of high energy diet on growth performance, carcass characteristics, and blood constituents of final fattening Hanwoo steers. Korean J Agric Sci. 42(3):261–226. doi:10.7744/cnujas.2015.42.3.261.
- Clemente E, Arbaiza T, Carcelén F, Lucas O, Bazán V. 2003. Evaluación del valor nutricional de la Puya llatensis en la alimentación del cuy (Cavia porcellus). Rev Inv Vet Perú. 14(1):1–6. Available from: https://www.scielo.org.pe/pdf/rivep/v14n1/a01v14n1.
- Crampton E, Harris L. 1974. Nutrición animal aplicada, 2° edición. Zaragoza, España: Editorial Acribia, 756 pp.
- ENA. 2017. Encuesta Nacional Agropecuaria 2017. Lima, Peru: Instituto Nacional de Estadística. Available from: https://www.inei.gob.pe/media/MenuRecursivo/publicaciones_digitales/Est/Lib1593/.
- Faber T, Hopkins A, Middelbos I, Price N, Fahey Jr G. 2011. Galactoglucomannan oligosaccharide supplementation affects nutrient digestibility, fermentation end-product production, and large bowel microbiota of the dog. J Anim Sci. 89(1):103–112. doi:10.2527/jas.2010-3028.
- Fan YF, Yang YY, Yang P, Xia T, Ma YX. 2017. Available energy content, nutrients digestibility of chili meal and effects on performance of growing pigs. Anim Feed Sci Technol. 229:97–105. doi:10.1016/j.anifeedsci.2017.05.001.
- FEEDNA. 2018. Composición de alimentos y valor nutritivo. Available from: https://www.fundacionfedna.org/tablas-fedna-composicion-alimentos-valor-nutritivo.
- Félix A, Gabeloni L, Brito C, Oliveira S, Silva A, Maiorka A. 2012. Effect of b-mannanase on the digestibility of diets with different proteín sources in dogs determined by different methodologies. J Anim Sci. 90(9):3060–3067. doi:10.2527/jas.2011-4222.
- Galyean ML, Cole NA, Tedeschi LO, Branine ME. 2016. Board-invited review: efficiency of converting digestible energy to metabolizable energy and reevaluation of the California net energy system maintenance requirements and equations for predicting dietary net energy values for beef cattle. J Anim Sci. 94(4):1329–1341. doi:10.2527/jas.2015-0223.
- Guevara P, Claeys T, Janssens GP. 2008. Apparent digestibility in meat-type guinea pigs as determined by total collection or by internal marker. Vet Med (Praha). 53(4):203–206.
- Hall MB, Eastridge ML. 2014. Carbohydrate and fat: considerations for energy and more. Prof Anim Scient. 30(2):140–149. doi:10.15232/S1080-7446(15)30101-7.
- Harahap RP, Jayanegara A, Fakhri N. 2018. Evaluation of oil palm fronds using fiber cracking technology combined with Indigofera sp. in ruminant ration by Rusitec. AIP Conf Proc. 2021:050008-1–050008-6. doi:10.1063/1.5062758.
- James G, Witten d, Hastie T, Tibshirani R. 2013. An introduction to statistical learning, with application in R. 1st ed. Springer Texts in Statistics. New York, Heidelberg, Dordrecht, London: Springer. doi:10.1007/978-1-4614-7138-7
- Jayanegara A, Ridla M, Nahrowi & Laconi EB. 2019. Estimation and validation of total digestible nutrient values of forage and concentrate feedstuffs. IOP Conf Series Mater Sci Eng, 546, 042016. doi:10.1088/1757-899x/546/4/042016
- Kassa A. 2019. The different methods of measuring feed digestibility: a review. EC Nutrition. 14(1): 68–74. Available from: https://www.ecronicon.com/ecnu/pdf/ECNU-14-00542.pdf
- Keys J, Van Soest P, Young E. 1970. Effect of increasing dietary cell wall content on the digestibility of hemicellulose and cellulose in swine and rats. J Anim Sci. 31(6):1172–1177. doi:10.2527/jas1970.3161172x.
- Kienzle E. 2002. Further developments in the prediction of metabolizable energy in pet food. J Nutr. 132(6):1796–1798. doi:10.1093/jn/132.6.1796S.
- Laflamme DP. 2001. Determining metabolizable energy content in commercial pet foods. J Anim Physiol a Anim Nutr. 85(7–8):222–230. doi:10.1046/j.1439-0396.2001.00330.x.
- Lammers PJ, Carlson SL, Zdorkowski GA, Honeyman MS. 2009. Reducing food insecurity in developing countries through meat production: The potential of the guinea pig (Cavia porcellus). Renew Agric Food Syst. 24:155–162. doi:10.1017/S1742170509002543.
- McDonald P, Edwards RA, Greenhalgh JF, Morgan CA, Sinclair LA, Wilkinson RG. 2010. Animal nutrition, 7th ed. Madrid, España: Prentice Hall-Pearson.
- Meza G, Cabrera R, Morán J, Meza F, Cabrera C, Meza C, Meza J, Cabanilla M, López F, Pincay J, et al. 2014. Mejora de engorde de cuyes (Cavia porcellus L.) a base de gramíneas y forrajeras arbustivas tropicales en la zona de Quevedo, Ecuador. IDESIA (Chile). 32(3):75–80. doi:10.4067/S0718-34292014000300010.
- MIDAGRI. 2020. En el 2020 se elevarán las ventas y consumo de cuy. Lima, Peru: Ministerio de Desarrollo Agrario y Riego – Perú. Available from: https://www.gob.pe/institucion/midagri/noticias/76440-en-el-2020-se-elevaran-las-ventas-y-consumo-de-cuy.
- Moir KW, Yule WJ, Connor JK. 1980. Energy losses in the excreta of poultry: a model for predicting dietary metabolizable energy. Aust J Exp Agric Anim Husb. 20(103):151. doi:10.1071/ea9800151.
- NAS. 2019. Nutrient requirements of animals collection. Washington, DC: National Academic Press. Available from: https://www.nap.edu/collection/63/nutrient-requirements-of-animals.
- NRC. 1995. Nutrient requirements of laboratory animals. 4th rev ed. Washington, DC: National Academy Press. doi:10.17226/4758.
- NRC. 2000. Nutrient requirements of beef cattle: seventh revised edition: update 2000. Washington, DC: National Academy Press.
- NRC. 2006. Nutrient requirements of dogs and cats. Washington, DC: The National Academies Press.
- Osorio-Carmona E, Giraldo-Carmona J, Narváez-Solarte W. 2012. Metodologías para determinar la digestibilidad de los alimentos utilizados en la alimentación canina. Vet Zootec. 6(1):87–97.
- Riaz MQ, Südekum KH, Clauss M, Jayanegara A. 2014. Voluntary feed intake and digestibility of four domestic ruminant species as influenced by dietary constituents: a metaanalysis. Livest Sci. 162:76–85. doi:10.1016/j.livsci.2014.01.009.
- Rostagno H, Texeira L, Donzele J, Gomez P, De Oliveira R, Lopes D, Ferreira A, Toledo S, Euclides R. 2011. Composición de alimentos y requerimientos nutricionales. Tercera Ediçao: Universidad Federal de Viçosa. 259 p. Available from: https://www.lisina.com.br/arquivos/Geral%20Espa%C3%B1ol.pdf
- Schofield J, Noonan D, Chen Y, Penson P. 2014. Chapter 12 - Laboratory Animals Regulations and Recommendations for Global Collaborative Research: Australia and New Zealand. In: Javier Guillén, editor. Laboratory Animals. Academic Press; p. 333–376. http://doi.org/10.1016/B978-0-12-397856-1.00012-X.
- Shi CX, Liu ZY, Shi M, Li P, Zeng ZK, Liu L, Huang CF, Zhu ZP, Li DF. 2015. Prediction of digestible and metabolizable energy content of rice bran fed to growing pigs. Asian Australas. J Anim Sci. 28(5):654–661. doi:10.5713/ajas.140507.
- Sotelo A, Contreras C, Norabuena E, Castañeda R, van Heurck M, Bullón L. 2016. Digestibilidad y energía digestible de cinco leguminosas forrajeras tropicales. Rev Soc Quím Perú. 82(3):306–314.
- Spotorno AE, Marin JC, Manriquez G, Valladares JP, Rico E, Rivas C. 2006. Ancient and modern steps during the domestication of guinea pigs (Cavia porcellus L.). J Zool. 270(1):57–62. doi:10.1111/j.1469-7998.2006.00117.x.
- Stein HH, Sève B, Fuller MF, Moughan PJ, de Lange CF. 2007. Invited review: amino acid bioavailability and digestibility in pig feed ingredients: terminology and application. J Anim Sci. 85(1):172–180. doi:10.2527/jas.2005-742.
- Supo J. 2016. Soluciones de Análisis Predictivos Para la Investigación. Curso de especialización. Lima, Perú: SAPRE. Bioestadístico.
- Tshibangu I, Nsahlai V, Kiatoko H, Hornick JL. 2014. Nutritive value of Adenodolichos rhomboideus leaves compared with Leucaena leucocephala and Stylosanthes guianensis forages in indigenous goats in Lubumbashi (DR Congo). Biotechnol Agron Soc Environ. 18(2):165–173.
- USDA. 2008. Total digestible nutrients and protein per acre produced by five Indiangrass cultivars. Pasture & Hay Planting; CP 512. Available from: https://www.nrcs.usda.gov/Internet/FSE_PLANTMATERIALS/publications/arpmctn 8012.pdf.
- USDA. 2019. USDA Food Composition Databases. United States Department of Agriculture. Available from: https://ndb.nal.usda.gov/ndb/.
- Van Amburgh ME, Collao-Saenz EA, Higgs RJ, Ross DA, Recktenwald EB, Raffrenato E, Chase LE, Overton TR, Mills JK, Foskolos A. 2015. The cornell net carbohydrate and protein system: updates to the model and evaluation of version 6.5. J Dairy Sci. 98(9):6361–6380. doi:10.3168/jds.2015-9378.
- Villalobos L, Sánchez J. 2010. Evaluación agronómica y nutricional del pasto ryegrass perenne tetraploide (Lolium perenne) producido en lecherías de las zonas altas de Costa Rica. II. Valor nutricional. Agronomía Costarricense. 34(1):43–52. Available from: https://www.scielo.sa.cr/scielo.php?script=sci_arttext&pid=S0377-94242010000100004.
- Weiss W, Conrad H, Pierre N. 1992. A theoretically-based model for predicting total digestible nutrient values of forages and concentrates. Anim Feed Sci Technol. 39:95–110. doi:10.1016/0377-8401(92)90034-4.
- Weiss W, Tebbe A. 2019. Estimating digestible energy values of feeds and diets and integrating those values into net energy systems. Trans Anim Sci. 3(3):953–961. doi:10.1093/tas/txy119.