
 ?Mathematical formulae have been encoded as MathML and are displayed in this HTML version using MathJax in order to improve their display. Uncheck the box to turn MathJax off. This feature requires Javascript. Click on a formula to zoom.
ABSTRACT
Bayesian and average information restricted maximum likelihood (AI-REML) approaches were used to estimate variance components and genetic parameters of Wood’s lactation curve parameters of milk production traits in three lactations of Iranian Holstein dairy cows. Wood’s function parameters (a, b, and c) of each lactation were initially estimated for individual cows using the NLIN procedure of the SAS programme, separately. The variance components of the parameters of each lactation were estimated by the AI-REML method using a single-trait animal model inairemlf90 programme. To do this with the Bayesian method by using the Gibbs sampling technique, the same animal model was used in the gibbs3f90 programme. The estimated heritability values by the AI-REML were 0.018, 0.00, and 0.019 for a parameter; 0.015, 0.007, and 0.02 for b parameter; and 0.23, 0.625, and 0.049 for c parameter in the 1st, 2nd, and 3rd lactations, respectively. The corresponding results from the Bayesian procedure (a posterior means) were 0.019, 0.01, and 0.035 for a parameter; 0.018, 0.019, and 0.043 for b parameter; and 0.024, 0.1, and 0.058 for c parameter, respectively. These obtained results reveal that the differences between the Bayesian and AI-REML methods in terms of estimation of heritability and variance components were small.
Introduction
Milk is a valuable source of mineral nutrients required in human food (Schmidt and Van Vleck Citation1974). Milk production for dairy cattle farms is the main income source, and therefore milk yield records of dairy herds are of great importance (Cankaya et al. Citation2011). The breed composition of the cattle population in Iran in 2006 consisted of 8.6% Holstein with an average milk yield of 6634 kg per year per cow, 45.4% crossing of Holstein and local breeds with a yield of 2827 kg per year and cow, and 46.0% local breeds with a yield of 864 kg per year per cow.Footnote1 The individual performance of animals with various genetic compositions will depend on the prediction of the lactation curve's shape (Pereira et al. Citation2016). The term lactation curve refers to a graphical representation of the ratios of lactation and milk production (Sherchland et al. Citation1995). Lactation curves provide valuable information on the pattern of milk production characteristics that would, in effect, be used for herd breeding and management decisions via predicted milk yield (Pérochon et al. Citation1996; Macciotta et al. Citation2005). Mathematical models in genetic programmes are employed to explain the shape of lactation curves and help develop strategies to optimize lactation curves (Oliveira et al. Citation2007).
To explain the flow of milk production over the course of lactation in dairy cows, various mathematical models have been developed (Wood Citation1967; Wilmink Citation1987). The application of mathematical models to describe the lactation curve is traced back to 1923 (Cobby and Le Du Citation1978), a popular model being the Wood function (Wood Citation1967) which allows a function with a minimum of parameters and accurate biological understanding. The model’s popularity has resulted in its modification and improvement over time (Cappio-Borlino et al. Citation1995) as adopted widely by many researchers (Cobby and Le Du Citation1978; Ferris et al. Citation1985; Scott et al. Citation1996; Kellogg et al. Citation1977; Varona et al. Citation1998; Rekaya et al. Citation2000; Macciotta et al. Citation2005). Genetic variation exists for parameters of wood’s curves, indicating that the shape of the lactation curve can be modified based on genetic information (Ferris et al. Citation1985; Varona et al. Citation1998). Considering that the shape of lactation curves varies between animals and breeds, it is important to obtain the curve parameters which are treated as different traits.
For most animal breeding programmes, important genetic parameters are based on (co) variance components. Accurate measurement of these components would also result in the satisfaction of animal breeding programmes. The classic or Frequentist statistical methods have been adopted for parameter estimation and statistical inferences.
Bayesian approaches, compared to REML, have the advantage of allowing prior knowledge of unknown variables to be included in the analysis. In addition, the Bayesian theorem provides a solution to the problem of finite sample size, since, for every large or small set of data from which inferences can be drawn, there is an exact posteriori distribution (Misztal Citation2008; Aspilcueta-Borquis et al. Citation2010). While evaluating large data, prior knowledge tends to be overcome by the likelihood function in creating a posterior distribution. In this case, estimates of parameters are similar to those obtained on the basis of probability functions by Frequentist methods (Gianola and Fernando Citation1986). Some investigations have been carried out in Iranian Holstein cattle about the estimate of genetic parameters and heritability for parameters of Wood lactation in first parity, but there is no publication about Bayesian analysis for lactation curve of traits in three lactations and comparison with REML method. In addition, in this method, it is possible to incorporate past information about the parameter and formed prior distribution for future analysis. Therefore, the main aim of the present investigation was the estimation of the (co)variance components for Wood’s function parameters via a single-trait animal model by AI-REML and Bayesian methods in the first three lactations of Iranian Holstein dairy cows.
Material and methods
Data
The initial dataset consisted of 250,654 monthly test-day records of milk yield that were collected from 8368, 6749, and 4923 animals in the first three lactations of Iranian Black and White Holstein cows. These data were collected from16 herds, by the National Breeding Center of Iran, from 2007 to 2019. All cows had milking three times a day. The data were edited based on the following criteria: (a) lactation period between 5 and 305 days; (b) the number of test-day records for each cow to be a minimum of 5 test days; and (c) individual daily milk production between 2 and 78 kg (Elahi Torshizi et al. Citation2011). For test-day records of milk yields, an outlier control assessment was conducted. 99.73% of the observations accounted for data within the μ ± 3 standard deviations range. Records outside this range have been taken into as consideration outliers (Junior et al. Citation2018). Therefore, the final data set consisted of 65,710 test-day records from 7052 cows in their first parity, 45,664 test-day records from 4937 animals on the second parity cows, and 32,430 test-day records from 3551 animal cows in their third parity. The total number of animals in the pedigree was 19,704. The number of sires and dams with progeny in the first three parities were 515 and 4659, respectively. The structure of pedigree used is presented in . The parameters of the Wood function (a, b, and c) were considered as traits analyzed for 305 days of lactations. The Univariate procedure of SAS 9.3 software (SAS Institute Inc. Citation2008) was used for primary analyses of milk yield data.
Table 1. Characteristics of the used data in the analysis.
Statistical analysis
The Wood's function was used to describe the lactation curves in three parities. The function is defined by the expression:
(1)
(1) where, yt is the milk yield at day t, a is the initial milk yield after calving, and parameters b and c determine the slope of the curve before and after the peak, respectively. Also, exp is the base of the natural logarithm set up as 2.71828 in the function (Wood Citation1967). The model was fitted to test-day milk yield records using the NLIN procedure of SAS (SAS Institute Inc. Citation2008), and then lactation curve parameters were estimated for each individual cow. In fitting the nonlinear function, the Gauss–Newton method was employed as the iteration method. For calculating the phenotypic correlation between corresponding Wood parameters in different lactations, the CORR procedure of SAS software was employed.
AI-REML analysis
In each lactation, (co)variance components for Wood lactation curve parameters were estimated using the single-trait mixed animal model as:
(2)
(2) where y is the observation vector for the traits, i.e. a, b, or c parameters of the Wood function, b is the fixed effect vector that included herd, age at calving, and year of calving, and u is the random vector of the additive genetic effect of the animals, e is the residual random effect vector, and X and Z are the incidence matrices that relate the traits records to the fixed and random effects, respectively. The structure of (co)variance matrix of random variables in this model is as follows:
After considering R = I.σe2 and G = A.
in which A is the matrix of additive relationship between animals and I is the identical matrix in these equations, the variance components were estimated by the REML method using the AI-REML algorithm and the airemlf90 programme (Misztal et al. Citation2002).
Bayesian analysis
In Bayesian estimation of genetic parameters of Wood lactation curve parameters, the same single-trait mixed animal model was applied by the gibbs3f90 programme (Misztal et al. Citation2002). As an important part of each Bayesian analysis, for all unknown parameters, corresponding prior distributions were considered. The posterior marginal distribution of parameters was obtained through Gibbs sampling (Jiantao et al. Citation2017). The Gibbs sampler analysis was carried out with a burn-in period and a sampling interval (thin) of 2 × 10⁴ and 100 iterations, respectively, with total cycles of 2 × 10⁵. Finally, 1800 samples from each posterior distribution were used for Bayesian inference. The convergence was verified through the inspection of effective sample sizes (ESS) and autocorrelations by using the post gibbsf90 programme (Misztal et al. Citation2002). The ESS is an estimate of the number of independent samples, and an ESS value closer to the sum of the samples shows that there is practically no association between the Gibbs samples (Riebler et al. Citation2008). The ESS was limited to a value of greater than 30 in this analysis. The autocorrelation was limited to less than 0.1 between successive stored iterations.
Genetic parameters
Genetic parameters were subsequently calculated using additive genetic and residual variance components estimated using AI-REML and Bayesian methods. Heritability was calculated as follows:
where
and
are additive genetic and residual variances of the corresponding trait, respectively.
For the Bayesian method, heritability values were computed using the posterior mean of variance components in posterior distributions. In addition, 95% of High Posterior Density intervals (HPD intervals) were calculated for each parameter of interest. In the Bayesian method, estimated heritability values were tested for their significance using 95% HPD intervals (Villemereuil Citation2012). All calculations were completed in gibbs3f90 programme (Misztal et al. Citation2002).
Results
summarizes the data distribution for test-day milk production records. The average milk yield is 35.05 ± 8.63 kg, 37.22 ± 11.07 kg, and 38.34 ± 12.66 kg for the first three parities. Based on the estimated lactation curve parameters from the fitted lactations, overall mathematical means for a, b and c were 17.44, 0.26, and 0.002 for the first parity, 20.07, 0.22, and 0.003 for the second parity and 19.66, 0.33, and 0.004 for the third parity, respectively. The highest C.V. (%) value was observed in a parameter of the third parity (83.93%) and the lowest value in a parameter of the second lactation (50.49%). Descriptive statistics for the lactation curve parameters in the first three parities of Iranian Holstein cows are summarized in .
Table 2. Descriptive statistics for test-day milk production (kg) records in the first three lactations.
Table 3. Descriptive statistics for the estimated parameters of Wood’s lactation curve parameters in the first three lactations.
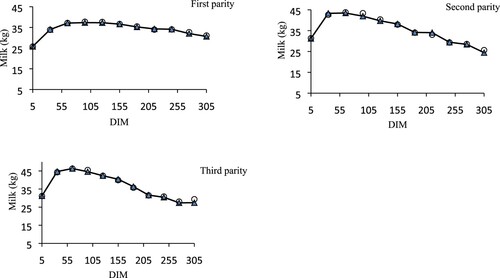
represents the average observed and predicted lactation curves in the range from (days in milk) DIM 5–305 for the first, second and third parity cows using Wood’s function. The third parity lactation curve indicates that the initial milk yield was higher and resulted in a higher peak milk yield compared with the first and second lactation parity curves. However, the second and third lactation parity curves showed a similar pattern for the decreasing lactation slope In general, for the predicted and observed parameter values, the lactation curves for the second and third lactation parities did not demonstrate differences.
Figure 1. Plots of predicted and actual average milk yield (kg) against DIM for cows of first, second and third parity using the Wood function. (▴actual, ○ Predicted).
As shown in , the phenotypic correlations among lactation curve parameters in the first parity ranged from −0.88 (between a1 and b1) to 0.83 (between b1 and c1), and in the second parity ranged from −0.85 (between a2 and b2) to 0.80 (between b2 and c2), and in the third parity ranged from −0.84 (between a3 and b3) to 0.78 (between b3 and c3). A positive and strong correlation was found between b and c parameters in the same lactation period (P < 0.0001). This implies that, if this correlation has genetic reasons, selection for greater values of b would result in a higher rate of c parameter in the lactation curve.
Table 4. Phenotypic correlation among lactation curve parameters in first three parities.
Estimation of genetic parameters
As the main goal of this research was the comparison of REML and Bayesian methods for estimating genetic parameters of Wood curve parameters, the results of the two methods were considered.
There are several diagnostics available to make this determination more systematic, such as the Geweke diagnostic (Geweke Citation1992). For a converged Markov chain, the absolute value of a Geweke statistic should be smaller than1.96 at the 0.05 alpha level. Convergence has been achieved according to the p-value of the Geweke test. The Z-values ranged from −1.12 to −0.05, −0.9 to 0.02, and −0.07 to 0.01 for additive genetic variance and 0.04 to 0.07, −0.01 to 0.49 and −0.04 to 0.05 for the residual variance of Wood function parameters in the first three parties (a1, b1, … , b3, c3), respectively. All the Z-values estimated were <1.96 (α = 0.05). In addition, the auto correlations index between successive samples of the variance components were calculated at 0.01–0.04. All of these results demonstrate that convergence was reached.
The results of estimated values of variance components and genetic parameters of the first three Wood lactations curve parameters using the Bayesian and AI-REML methods under the single-trait animal model have been shown in . The additive genetic variance estimates for a, b, and c parameters by the Bayesian method were from 0.00000048 to, 2.09, respectively. The corresponding estimates by the REML method were from 0.0000001 to 3.81, respectively. On the other hand, the residual variance estimates for the Wood lactation curve parameters in the first three parties obtained by the REML method were similar to those obtained by the Bayesian procedure. Furthermore, residual variances estimated by both methods were the largest components, particularly that obtained by the REML procedure, which was 105.21 for a3 parameter. Overall, the results indicated that the estimated values in the AI-REML method were similar compared to the Bayesian method. The estimated heritability in the Bayesian and AI-REML methods was from 0.018 to 0.1 and from 0.00 to 0.625, respectively. Estimates of heritability were low for all traits (a, b, and c parameters).
Table 5. Estimated genetic parameters of first three lactations curve parameters by Bayesian an AI-REML method.
Discussion
Wood’s lactation curve is one of the most common models in fitting the observed daily milk yields. In this research, h2, phenotypic and genotypic of a, b, and c parameters of Wood’s function for the first three parities of Iranian Holstein cows were estimated by the REML and Bayesian methods. Heritabilities ranged from 0.00 to 0.625 for the initial production and rate of decline of the second parity, respectively. The heritability values obtained by Bayesian method were relatively higher than the REML method. These results imply that the direct selection of lactation curve parameters may not effectively change the shape of the lactation curve. These findings were lower than those reported by Farhangfar and Rowlinson (Citation2007), who reported estimates for the parameters of Wood’s incomplete gamma function 0.10 for a, 0.03 for b and 0.05 for c, using the REML method for the first parity of Iranian Holstein heifers.
On the other hand, the heritabilities from the current study were similar to the results of Saghanezhad et al. (Citation2017) except second parity, who reported heritabilities of Wood’s lactation curve parameters (a, b, and c) for the first, second and third lactation ranged from 0.012 to 0.29, 0.017 to 0.15, and 0.02 to 0.13, respectively using REML method. The heritabilities from the current study were lower than the results of Rekaya et al. (Citation2000), who reported heritabilities of 0.26, 0.32, and 0.19 for a, b, and c, respectively, using the Bayesian method for the first parity Holstein-Friesian cows and the Wood’s model.
The positive phenotypic correlation between the second and third parameters of the lactation curve indicates that cows with higher upward trends in milk production are expected to have a higher rate of decrease in milk production after a peak at phenotypic level (Tekerli et al. Citation2000). Based on the negative estimated phenotypic correlations between a, b parameters and c parameters, cows with a higher level of production tend to have the phenotypic lactation curves with a long upward (b) and lower downward (c) phase during lactation. For the posterior mean, the Bayesian additive and residual variances were both lower than the REML estimates. In this study, values of additive variance estimated with Bayesian and REML methods were different from other dairy cattle populations (Varona et al. Citation1998; Rekaya et al. Citation2000; Alijani et al. Citation2012). In fact, genetic variances associated with a parameter were larger than the others. These differences were likely due to difficulties encountered in expressing their genetic potential under harsh climatic conditions and limited feed resources by the daughters of superior sires. Residual variances obtained in this study for a parameter had standard errors larger than those found by Rekaya et al. (Citation2000) and Varona et al. (Citation1998) implying elevated heterogeneity in estimates. This finding can be explained by the use of a large number of genetic parameters and hindered by lack of data (Rekaya et al. Citation2000). represents that the average actual and predicted lactation curves were almost similar. It can be clearly seen that this model is accurate in predicting the actual milk yield of Iranian Holstein cows. With regard to the computation time, in this and other studies, REML analysis was much faster than in Bayesian (Rekaya et al. Citation2003). It should be noted that there are a few studies about the comparison of two statistical methods for estimation of lactation curve parameters in Holstein and therefore comparative discussion seems difficult.
Conclusion
Modelling cow lactation curves is of great importance for optimized management and predicting production levels. The variance components of Wood’s lactation curve parameters of milk production in the three lactations were estimated using a single-trait animal model by the AI-REML and Bayesian procedures. The biological interpretation of these parameters allows them to be used in a selection index to genetically change the shape of the lactation curve. The Bayesian analysis allows parameter estimate in nonlinear models to be done using all available information and accounting for all sources of uncertainty. Marginal posterior distributions of parameters are used to make inferences, and the Gibbs sampler is used to achieve marginalization. Animals with high initial production levels, and hence a high (a) estimates, have lactation curves with a short ascending phase (tb) and higher persistency (exp(–ct)), according to the estimated correlations between parameters. Low heritabilities were obtained for the a, b, and c parameters of Wood's function of milk production in the Iranian Holstein cows in comparison to those from other Holstein population. This study suggests that the findings from both approaches were reasonably similar indicating that both methods could be employed.
Disclosure statement
No potential conflict of interest was reported by the author(s).
Notes
1 The report for 2011–2012 is available at https://www.amar.org.ir/english/Statistics-by-Topic/Agriculture#113281-releases.
References
- Alijani S, Jasouri M, Pirany N, Daghigh Kia H. 2012. Estimation of variance components for some production traits of Iranian Holstein dairy cattle using Bayesian and AI-REML methods. Pak Vet J. 32:562–566.
- Aspilcueta-Borquis RR, Di Palo R, Araujo Neto FR, Baldi F, De Camargo GMF, De Albuquerque LG, Zicarelli L, Tonhati H. 2010. Genetic parameter estimates for buffalo milk yield, milk quality and mozzarella production and Bayesian inference analysis of their relationships. Genet Mol Res. 9:1636–1644.
- Cankaya S, Unalan A, Soydan E. 2011. Selection of a mathematical model to describe the lactation curves of Jersey cattle. Arch Tierz. 54:27–35.
- Cappio-Borlino A, Pulina G, Rossi G. 1995. A non-linear modification of Wood's equation fitted to lactation curves of Sardinian dairy ewes. Small Rumin Res. 18:75–79.
- Cobby JM, Le Du YLP. 1978. On fitting curves to lactation data. Anim Prod. 26:127–133.
- Elahi Torshizi M, Aslamenejad AA, Nassiri MR, Farhangfar H. 2011. Comparison and evaluation of mathematical lactation curve functions of Iranian primiparous Holsteins. S Afr J Anim Sci. 41:104–115.
- Farhangfar H, Rowlinson P. 2007. Genetic analysis of wood`s lactation curve for Iranian Holstein heifers. J Biol Sci. 7:127–135.
- Ferris TA, Mao IL, Anderson CR. 1985. Selecting for lactation curve and milk yield in dairy cattle. J Dairy Sci. 68:1438–1448.
- Geweke J. 1992. Bayesian statistics, volume 4, chapter evaluating the accuracy of sampling-based approaches to calculating posterior moments. New York: Oxford University Press.
- Gianola D, Fernando RL. 1986. Bayesian methods in animal breeding theory. J Anim Sci. 63:217–244.
- Jiantao G, Weiji W, Yulong H, Mosang W, Tao T, Jie K. 2017. Estimation of genetic parameters for growth trait of turbot using Bayesian and REML approaches. Acta Oceanol Sin. 36:47–51.
- Junior JA, Gonçalves T, Souza JD, Rodriguez MA, Costa CN, Carvalheira JGV. 2018. Adjustment of lactation curves of Holstein cows from herds of Minas Gerais. Brazil J Agr Sci. 10:1–14.
- Kellogg DW, Urquhart NS, Ortega AJ. 1977. Estimating Holstein lactation curves with a gamma curve. J Dairy Sci. 60:1308–1315.
- Macciotta NPP, Vicario D, Cappio-Borlino A. 2005. Detection of different shapes of lactation curve for milk yield in dairy cattle by empirical mathematical models. J Dairy Sci. 88:1178–1195.
- Misztal I. 2008. Reliable computing in estimation of variance components. J Anim Breed Genet. 125:363–370.
- Misztal I, Tsuruta S, Strabel T, Auvray B, Druet T, Lee D. 2002. BLUPF90 and related programs (BGF90). Proceedings of the 7th world congress on Genetics applied to livestock production; Montpellier. France. p. 743–744.
- Oliveira VC, Fontes CAA, Siqueira JG, Fernandes AM, Sant‘Ana AF, Chambela Neto A. 2007. Milk production and performance of calves from Nellore and crossbred cows. Rev Bras Zootec. 36:2074–2081.
- Pereira MA, Menezes ML, Oliveira VS, Lima MS, Carvalho CTG, Santos ADF. 2016. Lactation curves of crossbred Taurine x Zebu cows. Bol Ind Anim. 73:118–126.
- Pérochon L, Coulon JB, Lescourret F. 1996. Modelling lactation curves of dairy cows with emphasis on individual variability. Anim Sci. 63:189–200.
- Rekaya R, Carabaño MJ, Toro MA. 2000. Bayesian analysis of lactation curves of Holstein-Friesian cattle using a nonlinear model. J Dairy Sci. 83:2691–2701.
- Rekaya R, Weigel KA, Gianola D. 2003. Bayesian estimation of parameters of a structural model for genetic covariances between milk yield in five regions of the United States. J Dairy Sci. 86:1837–1844.
- Riebler A, Held L, Stephan W. 2008. Bayesian variable selection for detecting adaptive genomic differences among populations. Genetics. 178:1817–1829.
- Saghanezhad F, Atashi H, Dadpasand M, Zamiri MJ, Shokri-Sangari F. 2017. Estimation of genetic parameters for lactation curve traits in Holstein dairy cows in Iran. Iranian J Appl Anim Sci. 7:559–566.
- SAS Institute Inc., S. C. D., Cary, NC. 2008. user's guide.
- Schmidt GH, Van Vleck LD. 1974. Principles of dairy science. San Francisco: W. H. Freeman.
- Scott TA, Yandell B, Zepeda L, Shaver RD, Smith TR. 1996. Use of lactation curves for analysis of milk production data. J Dairy Sci. 79:1885–1894.
- Sherchland l, Mcnew RW, Kellogg DW, Johnson ZB. 1995. Selection of a mathematical model to generate lactation curves using daily milk yields of Holstein cows. J Dairy Sci. 78:2507–2513.
- Tekerli M, Akinci Z, Dogan I, Akcan A. 2000. Factors affecting the shape of lactation curves of Holstein cows from the Balikesir province of Turkey. J Dairy Sci. 83:1381–1386.
- Varona L, Moreno C, Garcia Cortes LA, Altarriba J. 1998. Bayesian analysis of Wood's lactation curve for Spanish dairy cows. J Dairy Sci. 81(5):1469–1478.
- Villemereuil pd. 2012. Estimation of a biological trait heritability using the animal model. How to use the MCMCglmm R package.
- Wilmink JBM. 1987. Adjustment of test-day milk, fat and protein yield for age, season and stage of lactation. Livest Prod Sci. 16:335–348.
- Wood PDP. 1967. Algebraic model of lactation curve in cattle. Nature. 216:164–165.