
ABSTRACT
It has been reported that a commercial solid-phase competition ELISA (SPCE) commonly used in year-round serum surveillance in South Korea may not be sufficient for use in the sero-monitoring of protective antibody responses following vaccination. Here, we established a liquid-phase blocking ELISA (LPBE) method based on the purified 146S antigen of the foot-and-mouth disease virus (FMDV) A/Yeoncheon/SKR/2017 strain, and its analytical performance was assessed using a wide range of pig sera. The established LPBE performed well regardless of whether antisera were elicited by a homologous (A/Yeoncheon/SKR/2017) or heterologous virus (A/Pocheon/SKR/2010) classified in the A/ASIA/Sea-97 lineage. The LPBE performance was also assessed using sera obtained from pigs in the field that underwent routine vaccination, demonstrating that the assay exhibited higher consistency with the virus neutralization test (standard reference test) than the commercial SPCE. This suggested that the LPBE performed well for antisera induced by the FMDV serotype A vaccine strains used in South Korea, namely, A22/IRQ/24/64, A/Argentina/2001 + A24/Cruzeiro and A/Zabaikalsky/2013. Overall, the established LPBE is considered to be a convenient serological assay for use in postvaccination sero-monitoring.
Introduction
Foot-and-mouth disease (FMD) is one of the most economically important diseases and has a significant impact on livestock productivity and international trade. FMD vaccines, which are formulated with chemically inactivated purified whole viruses, are extensively used worldwide to control the disease because vaccination can be highly effective in limiting the spread of infection (Diaz-San Segundo et al. Citation2017). However, the highly variable nature of the FMD virus (FMDV) and the associated patterns of change in disease occurrence necessitate continual monitoring of the genetic and antigenic evolution of field isolates and reviewing the protection afforded by vaccination (Paton et al. Citation2019).
The internationally accepted method for assessment of FMD vaccine potency, recognized as the ‘gold standard’, is an in vivo vaccination-challenge test in the target animals. However, in vivo vaccination-challenge tests are associated with some practical difficulties in terms of the high cost associated with animal purchase, the considerable amount of time required for experiments, and the requirement for facilities with high biosecurity levels. Furthermore, the test has some drawbacks regarding scientific perspectives on animal welfare (Hendriksen Citation2002). In this respect, the experts from the World Organization for Animal Health (OIE) and the Food and Agriculture Organization of the United Nations (FAO) FMD Reference Laboratory have supported the use of serological tests as an alternative to animal testing because the tests can indirectly evaluate the efficacy of vaccines.
The conventional serological tests used for FMDV-specific antibody screening prescribed by the OIE are the virus neutralization test (VNT), liquid-phase blocking ELISA (LPBE) and solid-phase competition ELISA (SPCE) (Golding et al. Citation1976; Hamblin et al. Citation1986a; Hamblin et al. Citation1986b; Mackay et al. Citation2001). Although VNT is recognized as the standard reference method for the quantification of FMDV-specific antibody titers (OIE Citation2021), it is labor intensive and time consuming and requires a biocontainment laboratory. Therefore, the OIE recommends LPBE and SPCE as alternative methods for use in FMDV sero-monitoring (OIE Citation2021) because these ELISA formats are highly sensitive, cost-effective, reproducible and suitable for large-scale screening (Wong et al. Citation2020). The LPBE has also been found to be at least as reliable and precise as the VNT in assessing the level of protective immunity in vaccinated animals because its results correlate well with those of the VNT (Van Maanen and Terpstra Citation1989; Periolo et al. Citation1993; Maradei et al. Citation2008).
Several outbreaks of FMD serotype A have occurred in the Republic of Korea since 2017, and the emergence of FMDV serotype A has continued to pose a major threat to the livestock industry. Since then, the Korean government has made various efforts to prevent the outbreak of FMD serotype A in susceptible cloven-hoofed animals, such as pigs and cattle. The first is to extend a bivalent vaccine containing serotype O and A antigens used for a comprehensive biannual vaccination program in cattle to use in pigs. Currently, all susceptible livestock are vaccinated with three kinds of commercially available bivalent vaccines containing different serotypes of O and A antigens according to the prime and boost vaccination schedule. Second, various FMD vaccine strains have been developed and stocked in antigen banks in the preparation of possible future outbreaks. The FMDV A Yeonchoen (A/YC) strain (FMDV A/ASIA/Sea-97/G2 lineages) that emerged in 2017 was developed as one of the vaccine candidate strains. The aim of this study was to establish the LPBE using the purified FMDV A/YC antigen (146S) for the detection of antibodies against FMDV serotype A. In this study, the established LPBE was thoroughly validated by comparison with the VNT, a standard reference method, using an extensive range of serum samples from pigs to investigate whether it could replace the field-based diagnostic method (e.g. the commercial SPCE).
Materials and methods
Cells and viruses
The foot-and-mouth disease virus (FMDV) A/Yeoncheon/SKR/2017 strain (A/YC, A/ASIA/Sea-97/G2 lineage) and A/Pocheon/SKR/2010 strain (A/PC; A/ASIA/Sea-97/G1 lineage) were recovered from archival stocks at the Animal and Plant Quarantine Agency (APQA). The vaccine viruses A22/IRQ/24/64, A/Argentina/2001, A24/Cruzeiro and A/Zabaikalsky/2013 were obtained from the respective manufacturers. Two adherent cell lines, baby hamster kidney-21 (BHK-21) and fetal porcine kidney (LF-BK), were used for routine cultivation of viruses and in vitro studies. A BHK-21 suspension cell line was used for the production of the 146S antigen of FMDV. Viral titer measurement was performed with adherent cells by endpoint titration. Titers are represented as the 50% tissue culture infectious dose (TCID50) per 100 μl determined using the Spearman-Kärber method (Spearman Citation1908; Kärber Citation1931).
Antigen production
The production and purification of the FMDV A/YC antigen were carried out based on previously established techniques (Lee et al. Citation2020; Park et al. Citation2021). In brief, the FMDV A/YC strain was propagated in a suspension culture of BHK-21 cells cultured in serum-free CellventoTM BHK200 medium (Merck KGaA, Germany) in a shaking incubator. Viruses were harvested at 12 h postinfection and isolated by low-speed centrifugation at 3,000 x g for 20 min. Live viruses were inactivated by the addition of 3 mM binary ethyleneimine (BEI; Sigma–Aldrich, USA) followed by BEI neutralization with sodium thiosulfate treatment. The inactivated viruses were concentrated with 7.5% polyethylene glycol (PEG) 6000 (Sigma–Aldrich, USA). 146S antigens were purified from a crude sample by 15%−45% sucrose density gradient ultracentrifugation (SDG, at 110,000 x g for 4 h at 4°C) and stored at −70°C until use. The integrity and purity of the purified 146S antigens were checked by transmission electron microscopy (TEM) and SDS–PAGE (4-20% gradient gel), respectively. The total quantity of 146S antigens was determined by scanning at 259 nm using UA-6 absorbance detectors (Teledyne Isco, USA). The area under the peak for the specific fraction was calculated and used to determine the concentration of 146S (μg/ml) according to the previously established formula (Doel and Baccarini Citation1981).
Serum samples
All categories of serum samples used in this study are summarized in . To establish the liquid-phase blocking ELISA (LPBE), two panels of sequential serum samples with different neutralizing antibody (NAb) titers, which were obtained from in vivo vaccine efficacy studies conducted in advance, were used. Panel 1 consisted of positive (n = 97) and negative (n = 45) sera collected from pigs vaccinated with an experimental monovalent A/YC vaccine, while panel 2 consisted of positive (n = 70) and negative (n = 24) sera collected from pigs vaccinated with an experimental monovalent A/PC vaccine. The sequential serum panels, panel 1 and 2, were collected at 0, 21 and 28 days postvaccination (dpv) and collected sequentially between 1 and 7 days postchallenge (dpc). FMDV-negative sera collected from naïve pigs (n = 101) were also used in the assay as a negative serum panel (panel 3). The sera were pretitrated with a virus neutralization test (VNT), and reciprocal log10 NAb titers of 1.2 or more were considered positive. Among the serum samples, a series of reference serum standards with desired NAb titers were selected (n = 10); NAb titers corresponding to ≥ 1.95 (log10), 1.51-1.81 (log10), and ≤ 0.6 (log10) were considered strongly positive (n = 3), moderately positive (n = 3), and negative (n = 4), respectively. For evaluation of the established LPBE in the field, 148 pig serum samples were collected from a conventional pig farm in Chungnam Province in South Korea (panel 4).
Table 1. List of pig serum samples used in this study. All categories of sera were used for the establishment of the LPBE and evaluation of its application in the field. Panels 1 and 2 included sequentially collected serum samples from pigs vaccinated with a monovalent vaccine and subsequently challenged with the homologous vaccine strain of FMDV serotype A (collected at 0, 21 and 28 dpv and at 1–7 dpc). Panel 3 included FMDV-negative sera obtained from naïve pigs that had been neither vaccinated nor infected. Panel 4 included field sera obtained from a conventional pig farm with historical FMD vaccination records.
LPBE
The LPBE procedure was adapted from the OIE Manual of Diagnostic Test and Vaccines for Terrestrial Animals (OIE Citation2021) and carried out as described previously with some modifications (Hamblin et al. Citation1986a; Hamblin et al. Citation1986b; Maradei et al. Citation2008). Checkerboard titration was used to determine the optimal reaction conditions for the LPBE. In brief, test serum samples were diluted 1:20 in PBS-T buffer (PBS containing 0.05% Tween 20, pH 7.4) and mixed with an equal volume of the FMDV serotype A (FMDA) A/YC antigen in 50 mM Tris containing 300 mM KCl (pH 7.6). After overnight incubation at 4°C, the mixture was incubated for 1 h at 37°C in a well coated with a rabbit FMDV A/YC-specific capture antibody. Afterward, the test plates were washed five times with PBS-T buffer, and then a second incubation was carried out for 1 h at 37°C following the addition of a guinea pig FMDV A/YC-specific detection antibody. After repeating the washing steps, anti-guinea pig IgG conjugated with horseradish peroxidase (Thermo Fisher Scientific) was added to the wells. After 1 h of incubation at 37°C and washing, the colorimetric reaction was developed by the addition of the TMB (3,3',5,5'-tetramethylbenzidine) substrate reagent (Thermo Fisher Scientific), and the optical density (OD) at a wavelength of 450 nm was measured with an ELISA plate reader. A series of reference serum standards containing two strongly positive, moderately positive and negative sera and the four antigen controls (CAg; 100% reactivity) were assayed simultaneously as internal controls.
LPBE results are expressed as the percent inhibition (PI) value and were calculated using the following formula: PI (%) = 100 – (mean OD control or test serum – mean blank OD/mean CAg OD – mean blank OD) x 100. When both replicate PI values (%) of a test serum sample were below 50, the test serum sample was considered to be negative. If either or both replicate PI values (%) of a test serum sample were above 50, the test serum sample was considered to be positive, and further analysis by antibody titration using a twofold dilution assay procedure (from 1:20–1:640) was performed. Before calculating the PI value, whether each LPBE assay met the acceptance condition under the predetermined performance criteria was evaluated (Supplementary table 1).
Immunoassays
The titers of NAbs against FMDV in all sera were measured by the VNT based on the methodology described in the OIE Manual of Diagnostic Test and Vaccines for Terrestrial Animals (7). The NAb titer was calculated as the log10 of the reciprocal serum dilution required to achieve 50% neutralization of 100 TCID50 virus. The levels of antibodies raised against the structural proteins (SPs) of FMDV were measured by SPCE using a commercially available kit (PrioCHECKTM FMDV type A ELISA, Thermo Fisher Scientific) according to the manufacturer’s instructions.
Statistical analysis
Raw data from the immunoassays, LPBE, VNT and SPCE used in the study were obtained by testing all serum samples (). Using the VNT results as the gold standard, the diagnostic values of the ELISAs were estimated following appropriate statistical analyses with 95% confidence intervals (CIs), unless otherwise specified.
The diagnostic sensitivity and specificity of the ELISAs in relation to the VNT were computed using Fisher’s exact test (two-tailed, α < 0.05 considered significant). Cohen’s kappa value (k) was computed by comparing the number of true positive and true negative samples identified by the LPBE and VNT to measure the degree of agreement between the two assays. The k values of ≥ 0.81, 0.61-0.8, 0.41-0.6, 0.21-0.4 and ≤ 0.2 were defined as almost perfect, substantial, moderate, fair, and no agreement, respectively (Landis and Koch Citation1977). The correlation between the endpoint antibody titers of each serum sample generated by the LPBE and VNT was evaluated by Pearson’s correlation coefficient (r, p value < 0.05 considered significant) (Sheskin Citation2004). Based on the same data sets used to evaluate the r value, Bland–Altman analysis was performed to assess the level of agreement between the antibody titers measured by the LPBE and VNT, where the range of agreement was defined as the mean bias ± 1.96 standard deviation (SD). Using the antibody titer data obtained for field-obtained pig sera, the optimal cutoff value and diagnostic values of the LPBE, including the sensitivity, specificity and accuracy, were determined by using the area under the curve (AUC) determined by receiver operating characteristic (ROC) curve analysis (Zweig and Campbell Citation1993). A computed AUC value near 1 indicated a higher discriminatory potential to distinguish between positive and negative samples with maximized specificity and sensitivity.
Statistical analyses were performed using GraphPad Prism software for Windows (GraphPad Software, Inc., LA Jolla, CA, USA) and GraphPad QuickCalcs (http://www.graphpad.com/qui-ckclalcs/catMenu/).
Results
Establishment of the LPBE
Purification of the 146S antigen from crude virus infection supernatant of FMDV A/YC strain was successfully accomplished (supplementary Fig. 1). The LPBE was established using a purified FMDV A/YC antigen and anti-A/YC polyclonal antibodies produced in rabbits and guinea pigs. The optimal dilutions for all reagents used in the LPBE were predetermined by checkerboard titration using a series of reference serum standards (n = 10), including known strongly positive, moderately positive and negative pig sera (data not shown). The optimal working concentration of the purified FMDV A/YC antigen was 0.5 μg/ml. The optimal serum dilution that was determined by testing twofold serial dilutions of serum in the range of 1:5–1:80 was 1:20.
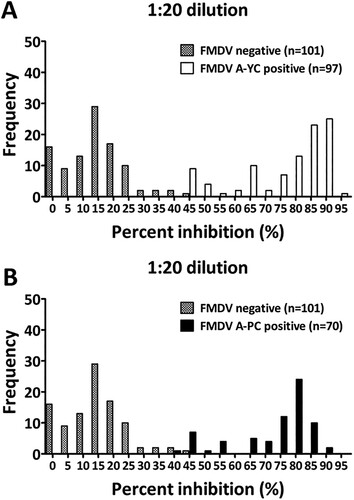
The cutoff value for the PI value for the LPBE was established based on known positive and negative sera, including 97 and 70 positive serum samples from panels 1 (n = 142 for A/YC) and 2 (n = 97 for A/PC), respectively, and 101 FMDV-free serum samples (panel 3). At a 1:20 dilution, the cutoff values for the PI value for positive and negative sera were 45.1% (for A/YC-positive sera), 44.9% (for A/PC-positive sera), and 46.8% (for FMDV-free sera). Thus, the cutoff value for the PI value was fixed at 50% to minimize false-positive results (). With this cutoff value (PI value = 50%), the LPBE exhibited good potential to distinguish between positive and negative sera. Overall, only eight samples each of A/YC-positive sera (8/97, 8.24%) and A/PC-positive sera (8/70, 8.75%) were interpreted as negative, while none of the negative sera were interpreted as positive (0/101, 0%).
Figure 1. Frequency distributions of the PI values (%) measured for known positive and negative sera, indicating the presence of antibodies against FMDV serotype A detected by the LPBE. Whether test sera were positive or negative was previously determined based on the level of NAb titers against A/YC (A) and A/PC (B). A reciprocal log10 NAb titer of 1.2 (16-fold) or more was considered positive.
Diagnostic performance of the LPBE with sequential serum panels
Using sequential serum panels that were obtained previously from in vivo vaccine efficacy testing, namely, panel 1 (n = 142) and panel 2 (n = 97), the diagnostic performance of the LPBE was evaluated by computing diagnostic values in relation to corresponding VNT results, and the results are summarized in . Sera were defined as either positive or negative for the presence of antibodies against FMDV serotype A based on the given cutoff values of 1.6 (log10 reciprocal NAb titer) and 50% (PI value) for the VNT and LPBE, respectively. The diagnostic sensitivity, specificity, positive predictive value (PPV) and negative predictive value (NPV) of the LPBE were assessed on a two-by-two contingency table with Fisher’s exact test by comparing the proportions of true-positive and true-negative samples identified. Consequently, the LPBE exhibited 90.7% sensitivity (95% CI: 83.1%−95.7%) and 88.9% specificity (95% CI: 75.9%−96.3%) for serum panel 1 and 88.6% sensitivity (95% CI: 78.6%−94.9%) and 95.8% specificity (95% CI: 78.8%−99.8%) for serum panel 2. For the PPV and NPV of the LPBE, the percentages were 94.6% (95% CI: 87.9%−98.2%) and 81.6% (95% CI: 68%−91.2%), respectively, for serum panel 1 and 98.4% (95% CI: 91.5%−99.9%) and 74.2% (95% CI: 55.4%−88.1%), respectively, for serum panel 2.
Table 2. Diagnostic performance of the LPBE for the detection of antibodies raised against FMDV serotype A. The diagnostic values of the LPBE for serum panels 1 and 2 were computed by comparison with the results of the VNT using contingency table analysis.
Data analysis, performed by computing the overall concordance between the LPBE and VNT, demonstrated that there was substantial agreement between the two assays, and the concordance levels were 90.1% with a kappa value of 0.78 (95% CI: 0.67-0.88) for serum panel 1 and 90.4% with a kappa value of 0.77 (95% CI: 0.63-0.91) for panel 2. The correlation between the two assays was further investigated by generating scatter plots and linear regression curves based on the results of endpoint antibody titers measured by both assays for serum panels 1 and 2. The Pearson correlation coefficient (r) between the two assays was computed by comparing those quantitative data at the individual level. The results for reference serum samples (n = 10) measured by the LPBE showed a significantly high correlation with those obtained by the VNT (Pearson correlation coefficient r = 0.9596 (95% CI: 0.86-0.99, P < 0.0001)) (data not shown). The results for each sequential serum panel, specifically panel 1 and panel 2, also showed a statistically significant correlation between the two assays, and the r values were 0.84 (95% CI: 0.78-0.88 P < 0.0001) and 0.87 (95% CI: 0.81-0.91 P < 0.0001) for panel 1 and panel 2, respectively (A and B).
Figure 2. Correlation of endpoint antibody titers measured by the LPBE and VNT in serum panels 1 (n = 142) and 2 (n = 94). To assess agreement between the two assays, scatter plots with linear regression curves and Bland–Altman scatter plots were generated from quantitative data for serum panel 1 (A and C) and serum panel 2 (B and D) obtained with each assay.
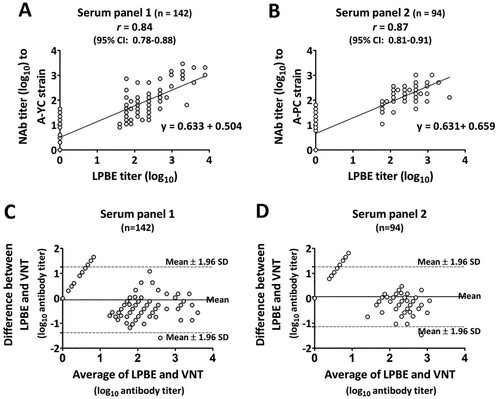
In addition, Bland–Altman analysis was performed with the same quantitative data sets and demonstrated that the minimum mean bias values measured between the LPBE and VNT were −0.061 and 0.062 for serum panels 1 and 2, respectively (C and D). Almost all of the calculated bias data (except for 8 out of 142 serum samples in panel 1 and 7 out of 94 serum samples in panel 2) were distributed within the 95% limit of agreement (mean bias ± 1.95 SD of bias) around the horizontal line at the center representing the mean bias. These results indicated significant agreement in measurements between the two assays.
Application of the LPBE in the field
To evaluate the suitability of the LPBE for use in the field, a total of 148 serum samples (serum panel 4) collected from a pig herd that received second-dose vaccinations were tested simultaneously by three serological assays: the LPBE, VNT and SPCE. Using the given cutoff value for each assay (PI value = 50% and log10 reciprocal NAb titer = 1.2), the test results were classified as positive or negative for the presence of antibodies against FMDV serotype A. As shown in , a comparison test performed based on the assumption that the VNT was the standard reference test demonstrated that the LPBE and SPCE showed significantly different diagnostic performance. The overall concordance between the LPBE and VNT was 97.3% with a kappa value of 0.74 (95% CI: 0.49-0.98), while that between the SPCE and VNT was 37.2% with a kappa value of 0.022 (95% CI: 0-0.074), indicating that the LPBE was in good agreement with the VNT. The sensitivity and specificity of the LPBE were 99.3% (95% CI: 96.1%−99.9%) and 77.8% (95% CI: 39.9%−97.2%), respectively, whereas the SPCE showed a sensitivity of 34.5% (95% CI: 26.7%−43.1%) and specificity of 77.8% (95% CI: 39.9%−97.2%). The PPV and NPV of the LPBE were 98.6% (95% CI: 94.9%−99.8%) and 87.5% (95% CI: 47.6%−99.7%), respectively, whereas the SPCE had a PPV of 96% (95% CI: 86.3%−99.5%) and an NPV of 0.071% (95% CI: 0.03%−14.1%). This low NPV value was estimated to be due to the high false-positive rate of the SPCE (65.5%).
Table 3. Diagnostic performance of the LPBE in comparison to the commercial SP-A ELISA. The diagnostic values of the two different ELISAs for serum panel 4 (n = 148) were computed based on the assumption that the VNT was the standard reference test (gold standard) using contingency table analysis.
Diagnostic accuracy of the LPBE with field-obtained sera
Under the assumption that the VNT results are perfectly correct, the predictive capacity of the LPBE was assessed by ROC curve analysis using all obtained antibody titer data across all categories of sera ( and Supplementary Fig. 2), and the results are shown in . At a cutoff value of 1.69 (log10 reciprocal antibody titer of the LPBE), the LPBE was highly predictable, with an AUC of 0.938 (95% CI: 0.898-0.978, p < 0.0001) for serum panel 1. In this analysis, the accuracy rate, sensitivity and specificity of the LPBE were 91.5%, 89.7% and 95.6%, respectively. An analysis using serum panel 2 demonstrated that, similar to the analysis of serum panel 1, a high AUC value of 0.938 (95% CI: 0.890-0.986, p < 0.0001) was observed at a cutoff value of 0.89 (log10 reciprocal antibody titer of the LPBE). Using this cutoff value, the accuracy rate, sensitivity and specificity of the LPBE were 90.4%, 88.6% and 95.8%, respectively. For serum panel 4, the LPBE showed a high AUC value of 0.915 (95% CI: 0.856-0.974, p < 0.0001) at a cutoff value of 2.14 (log10). This higher cutoff value seemed to be due to the large number of serum samples (89 out of 148 serum samples) that were considered strongly positive with a log10 reciprocal NAb titer of 1.81 or higher. Accordingly, the accuracy rate, sensitivity and specificity of the LPBE for serum panel 4 were 77.7%, 76.3% and 100%, respectively. In a ROC curve analysis of a total of 384 combined serum samples (serum panel 1, panel 2 and panel 4), the AUC value was increased by 9.45 (95% CI: 0.923-0.968, p < 0.0001) at a cutoff value of 1.69. Additionally, the accuracy rate, sensitivity and specificity of the LPBE were 93.1%, 88.5% and 92.2%, respectively.
Table 4. ROC curve analysis of the LPBE versus the VNT (gold standard) on different categories of serum samples. The optimal cutoff value, diagnostic sensitivity, specificity, accuracy and AUC of the LPBE were computed with a 95% confidence interval. The computed AUC value was near 1, which indicates a higher discriminatory potential to distinguish between positive and negative samples with maximized specificity and sensitivity.
Discussion
Postvaccination sero-monitoring has been considered an important measure for the evaluation of vaccination status in both herds and individual animals for countries undergoing FMD vaccination programs. This is commonly accomplished using serological assays, including the VNT, LPBE and SPCE, by measuring the anti-SP antibodies induced by vaccination. In South Korea, a commercially available SPCE (e.g. PrioCHECKTM FMDV type-specific antibody ELISA) has been applied as an anti-SP antibody detection method for year-round sero-surveillance (Park et al. Citation2021) due to its ability to be readily adapted for large-scale serological screening. Additionally, the sensitivity of SPCE has been reported to be less affected by the antigenic heterogeneity of FMDV strains, even those belonging to the same serotype, than that of other serological assays (Paiba et al. Citation2004). However, a recent study demonstrated that the results measured by the SPCE exhibited a high false detection rate and did not fully reflect the protective capacity of the serum, unlike those of the VNT and LPBE (Kang et al. Citation2018). This might be due to a greater antigenic diversity of FMDV serotype A viruses (Parida Citation2009). These previous findings suggest that the SPCE may not be sufficient for use in monitoring protective antibody responses induced following vaccination.
The LPBE has been applied as an alternative test method to the VNT in many laboratories to evaluate vaccine-induced antibody responses because it is relatively simple to use and its results are consistent with those of the VNT (OIE Citation2021). Furthermore, extensive studies have defined a good correlation between vaccine potency test outcomes and antibody titers measured by the LPBE (Barnett et al. Citation2003; Maradei et al. Citation2008; Robiolo et al. Citation2010).
In the present study, we established an LPBE for qualitative and quantitative estimation of anti-SP antibodies raised against FMDV serotype A. The design of our LPBE included the use of the FMDV A/YC antigen with a broad antigenic spectrum, enabling the detection of anti-SP antibodies against multiple FMDV serotype A strains. The antigenic cross-reactivity of the FMDV A/YC antigen with heterologous FMDV serotype A strains was previously demonstrated by VNTs. VNT results have demonstrated a high level of cross-neutralization by antibodies raised against the FMDV A/YC antigen against different topotypes and genotypes of FMDV serotype A strains (Park et al. Citation2021). Therefore, the use of the FMDV A/YC antigen in the assay was expected to provide broad cross-specificity, which is one of the characteristics of the SPCE facilitating large-scale serological screening.
The analytical performance of the LPBE was validated using a wide range of pig sequential sera representing different immune statuses. Using qualitative data, the diagnostic value of the LPBE was determined by comparing the proportions of true-positive and true-negative samples identified with the LPBE and VNT. The diagnostic sensitivity and specificity of the LPBE for homologous sera (anti-A/YC antisera, Panel 1) were acceptably high, and those values were comparable to the results estimated for heterologous sera (anti-A/PC antisera, Panel 2), indicating that the LPBE performed similarly well regardless of whether antisera were elicited by a homologous or heterologous virus in the A/ASIA/Sea-97 lineage. The PPV and NPV of the LPBE for both serum panels seemed to be fairly acceptable (94.6-98.4% PPV and 74.2%−81.5% NPV), considering that the assay was able to effectively discriminate positive and negative sera with efficiency similar to that of the VNT. In addition, the LPBE showed the highest concordance rates (90.7% for panel 1 and 88.6% for panel 2) and significantly high k values (0.78 for panel 1 and 0.77 for panel 2), which could be interpreted as substantial agreement between the LPBE and VNT.
In South Korea, three kinds of FMD bivalent O + A vaccines containing serotype A antigens, A22/IRQ/24/64, A/Argentina/2001 + A24/Cruzeiro and A/Zabaikalsky/2013, are used for compulsory vaccination in the field. In general, pigs are subjected to vaccination at least twice following a prime and boost schedule and are sometimes boosted with a heterologous vaccine, i.e. a vaccine different from that used for the priming vaccination. This variability creates a difficulty in sero-surveillance, and a comprehensive serological test method is consequently needed for simultaneous detection of anti-SP antibodies elicited by different vaccine antigens in the field. Therefore, in this study, we evaluated the established LPBE using field-obtained pig sera (n = 148) to ascertain whether the assay could provide broad cross-specificity irrespective of the FMDV serotype A vaccine antigens and whether it could replace the field-based diagnostic method (e.g. the commercial SPCE).
Comparative analysis, implemented based on the assumption that the VNT was the standard reference test (gold standard), demonstrated that the LPBE exhibited acceptably high diagnostic values (99.3% sensitivity, 77.8% specificity, 98.6% PPV and 87.5% NPV) and was closely correlated with the VNT (97.3% concordance rate with a k value of 0.74). These results indicated that the LPBE was less affected by the antigenic heterogeneity of the FMDV serotype A vaccine strains. However, this seems to be because most field sera have a high heterologous NAb titer for A/YC after two vaccinations. Thus, to more closely investigate whether the LPBE provides broad cross-specificity, the LPBE results need to be further compared with VNT results for various levels of homologous NAb titers. In contrast to those of the LPBE, the results of the SPCE performed with a PrioCHECKTM FMDV serotype A antibody ELISA kit were poorly matched with those measured by the VNT (34.5% concordance rate with a k value of 0.022). The lack of agreement between the SPCE and VNT was mainly due to the low diagnostic sensitivity and NPV value (34.5% and 0.071%, respectively), which indicated that the SPCE did not correctly predict positive sera identified by the VNT. Taken together, these results suggested that although it remains to be evaluated with larger field serum sample sets, the LPBE was considered more reliable than the SPCE in measuring the protective antibodies in serum samples and consequently might be useful for postvaccination sero-monitoring.
The established LPBE was further validated based on quantitative data and endpoint antibody titers obtained with the LPBE and VNT. Pearson’s correlation coefficient (r) is a measure of the strength of a linear association between two variables that are estimated on the same object by different test methods. However, as the r value does not give an indication of the discrepancy from equality, in terms of an additional verification, Blend-Altman analysis may be needed to reveal systemic errors between measurements (Van Stralen et al. Citation2008). The r values computed on anti-A/YC antisera (Panel 1) and anti-A/PC antisera (Panel 2) were acceptably high (r = 0.84 for panel 1 and r = 0.87 for panel 2), which explained the good correlation between the LPBE titer and NAb titer. The results of the Bland–Altman analyses of anti-A/YC antisera (panel 1) and anti-A/PC antisera (panel 2) showed a very low mean bias between the two assays, suggesting that similar to the VNT, the LPBE titer accurately reflects the protective capacity of the serum.
ROC curve analysis is most useful in the early stages of evaluation of a newly developed diagnostic method (Mandrekar Citation2010). By using ROC curve analysis, we determined the optimal cutoff LPBE titer that conferred the best performance for each serum panel. Although the results generated by ROC curve analysis showed some differences from the results based on the qualitative data set, the overall LPBE performance for the sequential serum panels (panels 1 and 2) seemed to be similar or improved. In the case of the results generated using field sera (panel 4), a significant discriminatory ability of the LPBE (AUC = 0.915) was found at a cutoff LPBE titer of 2.14 (log10), but the diagnostic sensitivity and accuracy (concordance) were decreased compared to those based on the qualitative data set. This was probably due to the limited number of weakly positive samples in panel 4. Therefore, further testing with a large number of weakly positive field serum samples will be needed to validate assay performance. In fact, a previous report suggested the importance of using weakly positive serum as a minimum standard for herd-based sero-surveillance (Niedbalski Citation2004). By ROC curve analysis, the best LPBE performance with a high AUC value of 0.945 was achieved when the serum samples were combined (n = 384). The result appeared to show improvement in the diagnostic performance of the LPBE because the lack of weakly positive samples in the field serum sample set (panel 4) was supplemented by the weakly positive samples in the sequential serum sample sets (panel 1 and panel 2).
It is important to compare the results obtained with a newly developed test method with those obtained with other measurement methods that are already in use before the new test method is implemented. This study evaluated the newly established LPBE for the detection of FMDV serotype A-specific anti-SP antibodies in serum samples. The established LPBE worked well regardless of whether homologous or heterologous sera were induced by viruses in the A/ASIA/Sea-97 lineage. Moreover, it showed reasonable diagnostic performance for antisera raised against the FMD serotype A vaccine strain used in South Korea. Therefore, the established LPBE is considered a convenient serological assay that can replace the commercial SPCE currently being used for postvaccination sero-monitoring. However, further study will be necessary to improve the LPBE, as it has been suggested that there are some limitations related to reproducibility due to the use of polyclonal antibodies (Veerasami et al. Citation2008).
Acknowledgments
This study was conducted independently by the APQA. The authors wish to thank the staff and researchers of the Center for FMD Vaccine Research, APQA, for providing support and facilities to carry out this research.
Disclosure statement
No potential conflict of interest was reported by the author(s).
Additional information
Funding
References
- Barnett PV, Statham RJ, Vosloo W, Haydon DT. 2003. Foot-and-mouth disease vaccine potency testing: determination and statistical validation of a model using a serological approach. Vaccine. 21:3240–3248. doi:10.1016/S0264-410X(03)00219-6
- Diaz-San Segundo F, Medina GN, Stenfeldt C, Arzt J, de Los Santos T. 2017. Foot-and-mouth disease vaccines. Vet Microbiol. 206:102–112. doi:10.1016/j.vetmic.2016.12.018
- Doel TR, Baccarini PJ. 1981. Thermal stability of foot-and-mouth disease virus. Arch Virol. 70:21–32. doi:10.1007/BF01320790
- Golding SM, Hedger RS, Talbot P. 1976. Radial immuno-diffusion and serum-neutralisation techniques for the assay of antibodies to swine vesicular disease. Res Vet Sci. 20:142–147. doi:10.1016/S0034-5288(18)33445-3
- Hamblin C, Barnet IT, Crowther JR. 1986b. A new enzyme-linked immunosorbent assay (ELISA) for the detection of antibodies against foot-and-mouth disease virus. II. Application. J Immunol Methods. 93:123–129. doi:10.1016/0022-1759(86)90442-4
- Hamblin C, Barnet IT, Hedger RS. 1986a. A new enzyme-linked immunosorbent assay (ELISA) for the detection of antibodies against foot-and-mouth disease virus I. development and method of ELISA. I. Development and method of ELISA. J Immunol Methods. 93:115–121. doi:10.1016/0022-1759(86)90441-2
- Hendriksen CFM. 2002. Refinement Reduction, and Replacement of Animal use for Regulatory Testing: Current Best Scientific Practices for the Evaluation of Safety and Potency of Biologicals ILAR J. 43:S43–S48.
- Kang Y-L, Jeong J-Y, Choi H-Y, Zhang Y, Liu Y, Lee H-J, Choi J-C, Lee S-H, Lee B-J, Lee S-W, et al. 2018. Evaluation and optimization of a conventional SPCE for FMD post-vaccination monitoring. BMC Vet Res. 14:371. doi:10.1186/s12917-018-1686-7
- Kärber G. 1931. Beitrag zur kollektiven behandlung pharmakologischer reihenversuche. Arch Exp Pathol Pharmacol. 162:480–483. doi:10.1007/BF01863914
- Landis JR, Koch GG. 1977. The measurement of observer agreement for categorical data. Biometrics. 33:159–174. doi:10.2307/2529310
- Lee G, Hwang J-H, Park J-H, Lee MJ, Kim B, Kim S-M. 2020. Vaccine strain of O/ME-SA/Ind-2001e of foot-and-mouth disease virus provides high immunogenicity and broad antigenic coverage. Antiviral Res. 182:104920. doi:10.1016/j.antiviral.2020.104920
- Mackay DK, Bulunt AN, Rendle T, Davidson F, Ferris NP. 2001. A solid-phase competition ELISA for measuring antibody to foot-and-mouth disease virus. J Virol Methods. 97:33–48. doi:10.1016/S0166-0934(01)00333-0
- Mandrekar JN. 2010. Receiver operating characteristic curve in diagnostic test assessment. J Thorac Oncol. 5:1315–1316. doi:10.1097/JTO.0b013e3181ec173d
- Maradei E, La Torre J, Robiolo B, Esteves J, Seki C, Pedemonte A, Lglesias M, D’Alola R, Mattion N. 2008. Updating of the correlation between lpELISA titers and protection from virus challenge for the assessment of the potency of polyvalent aphtovirus vaccines in Argentina. Vaccine. 26:6577–6586. doi:10.1016/j.vaccine.2008.09.033
- Niedbalski W. 2004. Comparison of different ELISA methods for the detection of antibodies against foot-and-mouth disease virus (FMDV) type O. Bull Vet Inst Pulawy. 48:5–9.
- [OIE] World Organization for Animal Health. 2021. Manual of diagnostic tests and vaccines for terrestrial animal. In: Chapter 3.1.8. foot-and-mouth disease (Infection with foot and mouth disease virus). http://oie.int/en/what-we-do/standards/code-and-manuals/terrestrial-manual-online-access/ (updated 24 Nov 2021).
- Paiba GA, Anderson J, Paton DJ, Soldan AW, Alexandersen S, Corteyn M, Wilsden G, Hamblin P, Mackey DKJ, Donaldson AI. 2004. Validation of a foot-and-mouth disease antibody screening solid-phase competition ELISA (SPCE). J Virol Methods. 115:145–158. doi:10.1016/j.jviromet.2003.09.016
- Parida S. 2009. Vaccination against foot-and-mouth disease virus: strategies and effectiveness. Expert Rev Vaccines. 8:347–365. doi:10.1586/14760584.8.3.347
- Park M-Y, Han YJ, Choi E-J, Kim H, Pervin R, Shin W, Kwon D, Kim JM, Pyo HM. 2021. Post-vaccination monitoring to assess foot-and-mouth disease immunity at population level in Korea. Front Vet Sci. 8:673820. doi:10.3389/fvets.2021.673820
- Park S-H, Lee S-Y, Kim J-S, Kim A-Y, Park S-Y, Lee J-H, Lee M, Kim H, Lee S-I, Kang N-Y, et al. 2021. Scale-up production of type O and A foot-and-mouth disease bivalent vaccine and its protective efficacy in pigs. Vaccines (Basel). 9:586. doi:10.3390/vaccines9060586
- Paton DJ, Reeve R, Capozzo AV, Ludi A. 2019. Estimating the protection afforded by foot-and-mouth disease vaccines in the laboratory. Vaccine. 37:5515–5524. doi:10.1016/j.vaccine.2019.07.102
- Periolo OH, Seki C, Grigera PR, Robiolo B, Fernandez ME, D’Aloia R, La Torre JL. 1993. Large-scale use of liquid-phase blocking sandwich ELISA for the evaluation of protective immunity against aphthovirus in cattle vaccinated with oil-adjuvanted vaccines in Argentina. Vaccine. 11:754–760. doi:10.1016/0264-410X(93)90261-U
- Robiolo B, La Torre J, Maradei E, Beascoechea CP, Perez A, Seki C, Smitsaart E, Fondevila N, Palma E, Goris N, et al. 2010. Confidence in indirect assessment of foot-and-mouth disease vaccine potency and vaccine matching carried out by liquid phase ELISA and virus neutralization tests. Vaccine. 28:6235–6241. doi:10.1016/j.vaccine.2010.07.012
- Sheskin DJ. 2004. Test 28: The Pearson product-moment correlation coefficient. In: Handbook of parametric and nanoparametric statistical procedures. 3rd ed. Boca Raton: CRC press; p. 945–1025.
- Spearman C. 1908. The method of “right and wrong cases” (constant stimuli) without gauss’s formula. Br J Psychol. 2:227–242.
- Van Maanen C, Terpstra C. 1989. Comparison of a liquid-phase blocking sandwich ELISA and a serum neutralization test to evaluate immunity in potency tests of foot-and-mouth disease vaccines. J Immunol Methods. 124:111–119. doi:10.1016/0022-1759(89)90192-0
- Van Stralen KJ, Jager KJ, Zoccali C, Dekker FW. 2008. Agreement between methods. Kidney Int. 74:1116–1120. doi:10.1038/ki.2008.306
- Veerasami M, Singanallur NB, Thirumeni N, Rana SK, Shanmugham R, Ponsekaran S, Muthukrishnan M, Villuppanoor SA. 2008. Serotyping of foot-and-mouth disease virus by antigen capture-ELISA using monoclonal antibodies and chicken IgY. New Microbiol. 31:549–554.
- Wong CL, Yong CY, Hk O, Ho KL, Tan WS. 2020. Advances in the diagnosis of foot-and-mouth disease. Front Vet Sci. 7:477. doi:10.3389/fvets.2020.00477
- Zweig MH, Campbell G. 1993. Receiver-operating characteristic (ROC) plots: a fundamental evaluation tool in clinical medicine. Clin Chem. 39:561–577.