
 ?Mathematical formulae have been encoded as MathML and are displayed in this HTML version using MathJax in order to improve their display. Uncheck the box to turn MathJax off. This feature requires Javascript. Click on a formula to zoom.
ABSTRACT
The study was performed to determine the association between body weight and biometric traits and to examine the effect of biometric traits on the live body weight of Nguni cows using Multivariate Adaptive Regression Splines (MARS) and Classification and Regression Tree (CART) data mining algorithms. In total, 105 Nguni cows aged three to four years were used for body weight (BW) and biometric traits viz; head width (HW), head length (HL), ear length (EL), body length (BL), rump height (RH), withers height (WH), sternum height (SH), body depth (BD), bicoastal diameter (BCD), rump width (RW), rump length (RL) and heart girth (HG). Coefficient of determination (R2), adjusted coefficient of determination (Adj.R2), root-mean square error (RMSE), standard deviation ratio (SD ratio) and Pearson correlation between actual and predicted values were predicted to find out the best fit models. MARS models in prediction of BW presented as the best fit as compare with CART model with higher R2 = 0.993 and Adj.R2 = 0.991 with the lowest RMSE = 5.97 and SD ratio = 0.081. In this study, MARS models established are the significant statistical tools that might be used for describing studied breed standards for breeding purposes.
1. Introduction
Nguni cattle are an indigenous Southern African breed under the Bos taurus Africana subspecies and it is believed that this breed is a mixture of Bos indicus and Bos Taurus, which was created from North Africa (Madilindi et al. Citation2020). Nguni cattle cannot only adapt to a harsh environment but also have a natural immunity to tick-borne diseases and parasites that affect livestock production (Sanarana et al. Citation2016; Mamogobo et al. Citation2021). Body weight is used by farmers in their daily farm management activities such as assessment of response to a different diet, growth rate and determining the growth traits (Haq et al. Citation2020). Knowledge of animal weight and weight changes is also important in determining responses to genetic selection (Lukuyu et al. Citation2016). Tyasi et al. (Citation2020) reported that selecting for high body weight might genetically improve the body weight of the next generation and help farmers to generate more money from their animals. Regression techniques such as simple regression and multiple regression have been used for the estimation of body weight (Adhianto et al. Citation2020). However, estimation of body weight using the regression techniques is affected by multicollinearity problems (Celik Citation2019). Faraz et al. (Citation2021) reported that Multivariate Adaptive Regression Splines (MARS) and Classification and regression tree (CART) data mining algorithms overcome the multicollinearity problems in predicting body weight. MARS is a non-parametric regression technique that does not need any supposition about the distribution of the variables and association among the variables entered into the predictive model to be built into statistical evaluation (Fatih et al. Citation2021). MARS have been used to estimate body weight in five different breeds of sheep (Akkaraman, Dağlıç, Kivircik, Merinos and Karacabey Merino) (Karabacak et al. Citation2017), Holstein-Friesian and Brown Swiss Cattle (Aytekin et al. Citation2018b), Pakistan goat (Celik Citation2019), camel (Fatih et al. Citation2021), Kars Sheperd dogs (Celik and Yilmaz Citation2021) and Karacabey Merino Sheep (Altay et al. Citation2021). CART is a data mining algorithm that can estimate categorical dependent variables known as classification and continuous dependent variables known as regression by constructing trees (Tyasi et al. Citation2021). It has been used frequently in animal breeding to predict body weight in Beetal goats of Pakistan (Eyduran et al. Citation2017), Balochi sheep (Huma and Iqbal Citation2019) and South African non–descript indigenous goats (Mathapo et al. Citation2022).
However, based on our knowledge, there is limited information on the use of MARS and CART to predict the effect of biometric traits on body weight of Nguni cows. Hence, the objectives of the study were: (1) to determine the association between live body weight and biometric traits of Nguni cows using correlation analysis, and (2) to determine the effect of biometric traits on the body weight of Nguni cows using MARS and CART. This study will help cattle farmers to use biometric traits during selection for breeding to improve the body weight of the cows.
2. Materials and methods
2.1. Study area, experimental animals, and management
The work was carried out at the University of Limpopo experimental farm, South Africa as explained by Alabi et al. (Citation2012). Nguni is a medium-sized breed that is kept mostly by communal farmers due to its ability to adapt to a harsh environment. It is a breed that is differentiated from other breeds by its multi-colour variation (Mamogobo et al. Citation2021). A total of 105 lactating and non-lactating Nguni cows of three to four years of age were used in this study. The cows were kept under an extensive farming system, in which, they were released in the morning to graze and brought back to the kraal in the afternoon. The sick and pregnant animals were excluded to achieve accurate results.
2.2. Data collection
Biometric traits and live body weight were measured in Nguni cows. The body weight was measured with a balance weighing scale whereas the biometric traits were measured using a measuring tape calibrated in centimetres (cm). The body weight and biometric traits include head width (HW), head length (HL), ear length (EL), rump height (RH), withers height (WH), sternum height (SH), body depth (BD), Bicoastal diameter (BCD), rump width (RW), rump length (RL) and heart girth (HG) were measured following the guideline described by FAO (Citation2012). To avoid differences in measurements, one person was taking the measurements.
2.3. Multivariate adaptive regression spline (MARS) algorithm
Multivariate adaptive regression spline data mining was conducted as described by Şengül et al. (Citation2020). The MARS algorithm can be rewritten as:
Where:
f(x) is the estimated value of the dependent variable, βm is an intercept, ℎm(Xv(k,m)) is the basis function, where v(k, m) is an index of the predictor for the mth component of the kth product, K is the parameter regulating the order of interaction. After building the most suitable MARS model, the basic functions that did not contribute much to the model fitting performance were removed in the pruning process based on the following generalised cross-validation error (GCV) (Şengül et al. Citation2020).
Where:
n is the number of training cases, yi is the observed value of a response variable, yip is the estimated value of a response variable and M(λ) is a penalty function for the complexity of the model with λ terms.
2.4. Classification and regression tree (CART) algorithm
Breiman et al. (Citation1984) proposed CART as a duplicating algorithm tree constructed by splitting a node into pairs of child nodes repeatedly, starting with the root node that contains the whole learning sample. Akin et al. (Citation2017) reported more detailed information on CART and CHAID algorithms.
2.5. Goodness of fit test
The best model between MARS and CART was determined by calculating the goodness of fit test criteria (Celik and Yilmaz Citation2021).
Pearson correlation coefficient (r) between the observed and predicted dependent variable values,
Coefficient of Determination
Adjusted Coefficient of Determination
Root-mean-square error (RMSE) given by the following formula:
Standard deviation ratio (SDratio):
Statistical Package for Social Sciences (IBM SPSS Citation2020) software version 27.0 was used for descriptive statistics and Pearson’s correlation. The ehaGoF package was used in R studio software (R Core Teams Citation2018) to calculate the goodness of fit test comparing MARS and CART as explained by Eyduran et al. (Citation2017).
3. Results
3.1. Descriptive statistics
The descriptive statistics results summarising the data of BW and biometric traits of Nguni cows are shown in .
Tables 1. Descriptive statistics of body weight and biometric traits of Nguni cows.
3.2. Phenotypic correlations
The results for phenotypic correlation among BW and biometric traits of Nguni cows are presented in . The findings showed that BW had a positively high significant correlation (P < 0.01) with RH, BD and HG, a positive significant correlation (P < 0.05) with HL, BL, WH and SH. The results further revealed that BW had no significant correlation (P > 0.05) with HW, EL, BCD, RW and RL in Nguni cows. The findings also showed that HL had a highly negative significant association (P < 0.01) with EL and a positively high significant relationship (P < 0.01) with RL. The RH also had a positively high significant association (P < 0.01) with BD.
Table 2. Phenotypic correlation of body weight and biometric traits of Nguni cows.
3.3. Mars data mining algorithm
The correlation coefficients do not highlight the influence of biometric traits on BW. Therefore, it is important to use the MARS data mining algorithm to predict the effect of biometric traits on BW of Nguni cows. The present study was performed to examine the effect of biometric traits on BW with the MARS data mining algorithm. The model () established by the MARS data mining algorithm showed that age, EL, WH, SH, BD, BCD, RL, HL, BL, HG and RH were involved in the model and RW and HW were excluded. MARS model established 26 basic functions with 10 for single order term variable influence and 16 order of interactions with an intercept coefficient of 302.42. Briefly, cows in the age 4 group had a positive influence on BW and the model coefficient was 34.17 when BD < 158 cm and the coefficient was 1.24 when BCD < 49.6 cm. The effect on BW was 75.22 when RL > 44.73 cm. Additionally, the findings revealed the effect of biometric traits interactions on BW of Nguni cows. The effect on BW was in a positive direction and the model coefficient was 0.65 when HL > 52 and BD > 158 cm. The influence on BW was 10.53 when RH > 127 and BD > 158 cm. The interaction between RH and BD also displayed that the model coefficient was 8.34 when RH < 131 cm and BD > 158 cm. The results further displayed that the influence on BW was 0.75 and 1.32 when 68 < SH > 68 cm and BD < 158 cm. The influence on BW was 1.03 when BD > 158 and RL < 45.74 and the influence was 16.32 when BD > 158 and HG < 181.
Table 3. Multivariate adaptive regression splines algorithm
3.4. CART data mining algorithm
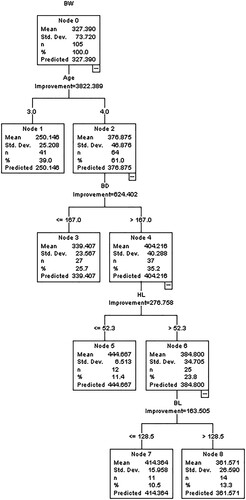
showed the CART model predicting BW from biometric traits and age groups. CART model consists of 8 nodes with node 0 as the root node having descriptive statistics for BW. Node 0 as the basis of the age group with a mean of 327.390 kg, n of 105 and a standard deviation of 73.72 was divided into node 1 (age group 3) with a mean of 250.146 kg, n of 41 and a standard deviation of 25.208 and node 2 (age group 4) with a mean of 376.875 kg, n of 64 and a standard deviation of 46.876. Node 2 was divided based on BD into node 3 (≤ 167 cm) with a mean of 339.407 kg, n of 27 and a standard deviation of 23.567, and node 4 (> 167 cm) with mean = 404.216 kg, n = 37 and a standard deviation = 40.288. Node 4 was divided into node 5 (≤ 52.3 cm) with a mean of 444.667 kg, n of 12 and a standard deviation of 6.513, and node 6 (> 52.3 cm) with a mean of 384.800 kg, n of 25 and a standard deviation of 34.705 based on the HL. Node 6 was further divided on the bases of BL into node 7 (≤ 128.5 cm) with a mean = 414.364 kg, n = 11 and a standard deviation = 15.958, and into node 8 (> 128.5 cm) with a mean = 361.571 kg, n = 14 and a standard deviation = 26.590.
Figure 1. Regression tree diagram constructed by CART algorithm.
3.5. Comparison of the CART and MARS algorithm
shows the goodness of fit criteria used to measure the predictive performance between MARS and CART algorithms. Among the two algorithms given, MARS showed a higher predictive performance accuracy compared to the CART algorithm. MARS algorithm showed higher R2, Adj R2 with lower RMSE and SD ratio. However, both algorithms showed a strong positive correlation between the actual and predicted live body weight values estimated (P < 0.01).
Table 4. Goodness of fit criteria for MARS and CART algorithm
4. Discussion
Biometric traits have a significant part in predicting body weight where the precision can be up to 90% of the actual body weight (Kusminanto et al. Citation2020). Firstly, the current study examined the relationships between biometric traits and the body weight of Nguni cows. The correlation results displayed that body weight had a positively high remarkable correlation with rump height, body depth and heart girth, a positive remarkable association with head length, body length, withers height and sternum height. The outcomes further revealed that the body weight had no statistically significant association with head width, head length, ear length, bicoastal diameter, rump width and rump length in Nguni cows. Maiwashe et al. (Citation2002) indicated that when traits are positively correlated, it means that those traits are controlled by the same gene. The findings of the study are in harmony with those of Sahu et al. (Citation2017) in adult female Sahiwal cattle, Putra et al. (Citation2015) in Aceh cattle, Lukuyu et al. (Citation2016) in crossbred dairy cattle in smallholder farms in Kenya. Tyasi et al. (Citation2015) reported dissimilar findings in South African indigenous sheep and the differences might be due to varying species. The correlation findings suggest that enhancing rump height, heart girth, body length, withers height and sternum height might improve body weight in Nguni cows. Therefore, rump height, heart girth, body length, withers height and sternum height might be included in the selection criteria for improvement of BW when breeding.
The study further examined the effect of biometric traits on the body weight of Nguni cows using MARS and CART algorithms. The results suggest that 98% of the variance of body weight in Nguni cows described by the MARS model, predicted and actual values of body weight had a positive high correlation, which means that the MARS model is the best model to estimate body weight of Nguni cows. The findings further showed the highest R2, Adj. R2 with the lowest RMSE and SD ratio indicates that the MARS model is the best fit model as compared with the developed CART model. MARS models showed that body depth, rump length, rump width, heart girth, withers height and rump height are important traits with an influence on body weight. However, the CART model recognised that age played a role as the premier influencer on the body weight of Nguni cows. Faraz et al. (Citation2021) reported that if it can be proved genetically, the traits with high influence can be selected to increase body weight. Based on the acquired knowledge, no study estimates body weight from biometric traits using multivariate adaptive regression splines and classification and regression tree data mining algorithms in the Nguni cattle breed. However, the same results in other livestock were found for the prediction of body weight using multivariate adaptive regression splines with the goodness of fit criteria of R2 = 0.9717, Adj. R2 = 0.9643, SD ratio = 0.168 and r = 0.986 in young bulls of crossbred and exotic breeds viz. Holstein, Simmental and Brown Swiss (Aytekin et al. Citation2018a), R2 = 0.994, SD ratio = 0.078, r = 0.997 in crossbred beef cattle in Eastern Turkey (Erturk et al. Citation2018), R2 = 0.91, Adj. R2 = 0.86, RMSE = 3.32, r = 0.95 and SD ratio = 0.30 in Pakistan goats (Celik Citation2019) and R2 = 0.92, Adj. R2 = 0.90, RMSE = 0.60, r = 0.96 and SD ratio = 0.28 in Turkish Tazi dogs (Celik and Yilmaz Citation2017). MARS models suggest that the influence on Nguni cows’ live body weight was 16.32 when BD > 158 and HG < 181.
5. Conclusions
The current study revealed there is a high positive association between body weight and some biometric traits (body depth, heart girth and rump height). Multivariate adaptive regression splines showed that age, withers height, body depth, rump length, heart girth, bicoastal diameter and sternum height had an effect on the body weight in Nguni cows. While classification and regression tree data mining algorithm discovered that age, body depth, head length and body length play a significant role in the body weight of Nguni cows. However, the goodness of fit criteria suggests that MARS is the best fit model for the prediction of live body weight in Nguni cows. The models developed in this study can be employed by cattle farmers to improve the body weight in the herd by selecting the traits in the model with an influence on body weight during the breeding of Nguni cows. Further studies need to be performed on the use of MARS and CART data mining algorithms in Nguni cows to evaluate the influence of biometric traits on body weight.
Acknowledgements
The authors would like to give thanks to the University of Limpopo experimental farmworkers for the assistance in data collection during the study.
Disclosure statement
No potential conflict of interest was reported by the author(s).
References
- Adhianto K, Harris I, Nugroho P, Putra WPB. 2020. Prediction of body weight through body measurements in boerawa (boer × etawah crossbred) bucks at tanggamus regency of Indonesia. Bulgarian J. Agric. Sci. 26(6):1273–1279.
- Akin M, Eyduran E, Reed BM. 2017. Use of RSM and CHAID data mining algorithm for predicting mineral nutrition of hazelnut. PCTOC. 128:303–316.
- Alabi OJ, Egena SSA, Ng’ambi JW, Norris D. 2012. Comparative study of three indigenous chicken breeds of South Africa: Body weight and linear body measurements. Agricultural Journal. 7:220–225. doi:10.3923/aj.2012.220.225.
- Altay Y, Boztepe S, Eyduran E, Keskin I, Tariq MM, Bukhari FA, Ali I. 2021. Description of factors affecting wool fineness in Karacabey Merino sheep using chaid and Mars algorithms. Pakistan J. Zool. 53(2):691–697.
- Aytekin I, Eyduran E, Karadas K, Akşahan R, Keskin I. 2018b. Prediction of fattening final live weight from some body measurements and fattening period in young bulls of crossbred and exotic breeds using MARS data mining algorithm. Pak J Zool. 50(1):189–195. doi:10.17582/journal.pjz/2018.50.1.189.195.
- Aytekin I, Eyduran E, Keskin I. 2018a. Detecting the relationship of california mastitis test (CMT) with electrical conductivity, composition and quality of the milk in Holstein-Friesian and Brown Swiss cattle breeds using CART analysis. Fresenius Environ. Bull. 27(6):4559–4565.
- Breiman L, Friedman J, Olshen R, Stone C. 1984. Classification and regression trees. Monterey, CA: Wadsworth and Brooks.
- Celik S. 2019. Comparing predictive performances of tree-based data mining algorithms and MARS algorithm in the prediction of live body weight from body traits in Pakistan goats. Pak J Zool. 51(4):1447–1456. doi:10.17582/journal.pjz/2019.51.4.1447.1456.
- Celik S, Yilmaz O. 2017. Comparison of different data mining algorithms for prediction of body weight from several morphological measurements in dogs. J. Anim. Plant Sci. 27(1):57–64.
- Celik S, Yilmaz O. 2021. The relationship between the coat colors of kars shepherd Dog and its morphological characteristics using some data mining methods. Int. J. Livest. Res. 11(1):53–61.
- Erturk YE, Aksoy A, Tariq MM. 2018. Effect of selected variables identified by MARS on fattening final live weight of crossbred beef cattle in eastern Turkey. Pak J Zool. 50(4):1403–1412. doi:10.17582/journal.pjz/2018.50.4.1403.1412.
- Eyduran E, Zaborski D, Waheed A, Celik S, Karadas K, Grzesiak W. 2017. Comparison of the predictive capabilities of several data mining algorithms and multiple linear regression in the prediction of body weight by means of body measurements in the indigenous beetal goat of pakistan. Pak J Zool. 49(1):257–265.
- FAO. 2012. Phenotypic characterization of animal genetic resources. FAO Animal Production and Health Guidelines, No. 11. Rome.
- Faraz A, Tirink C, Eyduran E, Waheed A, Tauqir NA, Nabeel MS, Tariq MM. 2021. Prediction of live body weight based on body measurements in thalli sheep under tropical conditions of Pakistan using CART and MARS. Trop Anim Health Prod. 53(301):1−12. doi:10.1007/s11250-021-02748-6.
- Fatih A, Celik S, Eyduran E, Tirink C, Tariq MM, Sheikh IS, Faraz A, Waheed A. 2021. Use of MARS algorithm for predicting mature weight of different camel (camelus dromedarius) breeds reared in Pakistan and morphological characterization via cluster analysis. Trop Anim Health Prod. 53(191)1−14. doi:10.1007/s11250-021-02633-2.
- Haq MS, Budisatria IGS, Panjono P, Maharani D. 2020. Prediction of live body weight using body measurements for jawa brebes (jabres) cattle. J. Anim. Plant Sci. 30(3):552–559.
- Huma ZE, Iqbal F. 2019. Predicting the body weight of balochi sheep using a machine learning approach. Turkish Journal of Veterinary and Animal Sciences. 43:500–506.
- IBM SPSS. 2020. Statistical packages for social sciences for windows: base system user’s guide, IBM statistics, 27. Chicago: SPSS Inc. doi:10.2527/jas.2013-6967.
- Karabacak A, Celik S, Tatliyer A, Keskin I, Erturk YE, Eyduran E, Javed Y, Tariq MM. 2017. Estimation of cold carcass weight and body weight from several body measurements in sheep through various data mining algorithms. Pak J Zool. 49(5):1731–1738.
- Kusminanto RY, Alawiansyah A, Pramono A, Cahyadi M. 2020. Body weight and body measurement characteristics of seven goat breeds in Indonesia. IOP Conference Series: Earth and Environmental Science. 478(1):012039–012167.
- Lukuyu MN, Gibson JP, Savage DB, Duncan AJ, Mujibi FDN, Okeyo AM. 2016. Use of body linear measurements to estimate liveweight of crossbred dairy cattle in smallholder farms in kenya. SpringerPlus. 5(63):1−14. doi:10.1186/s40064-016-1698-3.
- Madilindi MA, Cuthbert BB, Evison B, Yandisiwe PS, Khanyisani SN, Maria GT, Bongani SM, Ntanganedzeni OM. 2020. Genetic diversity and relationships among three southern African Nguni cattle populations. Trop Anim Health Prod. 52:753–762. doi:10.1007/s11250-019-02066-y.
- Maiwashe N, Bradfield MJ, Theron HE, Van Wyk JB. 2002. Genetic parameter estimates for body measurements and growth traits in South African bonsmara cattle. Livest Prod Sci. 75(3):293–300.
- Mamogobo MD, Mapholi NO, Nephawe KA, Nedambale TL, Mpofu TJ, Sanarana YP, Mtileni BJ. 2021. Genetic characterisation of non-descript cattle populations in communal areas of South Africa. Animal Production Science. 61:84–91. doi:10.1071/AN20030.
- Mathapo MC, Mugwabana TJ, Tyasi TL. 2022. Prediction of body weight from morphological traits of South African non-descript indigenous goats of lepelle-nkumbi local municipality using different data mining algorithm. Trop Anim Health Prod. 54(102):1−9. doi:10.1007/s11250-022-03096-9.
- Putra WPB, Sumadi HT, Saumar H. 2015. Relationship between body weight and body measurements of aceh cattle. Mal J. Anim. Sci. 18(1):35–43.
- R Core Team. 2018. R: A language and environment for statistical computing. Vienna: R Foundation for Statistical Computing. https://www.R-project.org/.
- Sahu SS, Choursia SK, Chaturvedani AK, Prakash OM. 2017. Correlation between body weight and linear body measurements in adult female sahiwal cattle. The Indian Journal of Veterinary Sciences and Biotechnology. 12(3):90–93. doi:10.21887/ijvsbt.v12i3.7103.
- Sanarana Y, Visser C, Bosman L, Nephawe K, Maiwashe A, van Marle-Köster E. 2016. Genetic diversity in South African Nguni cattle ecotypes based on microsatellite markers. Trop Anim Health Prod. 48:379–385. doi:10.1007/s11250-015-0962-9.
- Şengül T, Çelik Ş, Şengül Ö. 2020. Use of multivariate adaptive regression splines (MARS) for predicting parameters of breast meat in quails. J. Anim. Plant Sci. 30(4):786–793.
- Tyasi TL, Makgowo KM, Mokoena K, Rashijane LT, Mathapo MC, Danguru LW, Molabe KM, Bopape PM, Mathye ND, Maluleke D. 2020. Multivariate adaptive regression splines data mining algorithm for prediction of body weight of Hy-line silver brown commercial layer chicken breed. Advances in Animal and Veterinary Sciences. 8(8):794–799. doi:10.17582/journal.aavs/2020/8.8.794.799.
- Tyasi TL, Mkhonto AT, Mathapo MC, Molabe KM. 2021. Regression tree analysis to predict body weight of South African non-descript goats raised at syferkuil farm, capricorn district of South Africa. Biotechnology in Animal Husbandry. 37(4):293–304. doi:10.2298/BAH2104293T.
- Tyasi TL, Tyasi YF, Tyasi AL, Lagu S, Ngambu S. 2015. A study of relationship between body weight and morphological traits by using path analysis in South African indigenous sheep. J. Boil. Agric. Health. 5(10):1−4.