
ABSTRACT
This experiment aimed to investigate the effects of dietary energy or protein levels on lactation performance and progeny growth of Hu sheep. Thirty early lactation ewes with twin litters were assigned into five treatments (E1, E2 = P2, E3, P1, P3; n = 6) according to dietary energy levels (E1: 9.52 MJ/kg, E2: 10.02 MJ/kg, E3: 10.52 MJ/kg) and dietary protein levels (P1: 9.82%, P2: 10.99%, P3: 12.11%). The corresponding lambs were divided into SE1, SE2 = SP2, SE3, SP1 and SP3 (n = 12). Dietary energy level significantly affected the average daily gain (ADG) of Hu sheep (P = .005). The milk yield increased significantly with the increase of dietary protein level (P = .017), and then significantly increased the ADG of lambs. The serum blood urea nitrogen (BUN) of offspring (P = .006) and ewes (P = .003) increased significantly with the increase in the dietary protein level of ewes. Interestingly, at 60 d, the body size of SE3 group was the highest, and the straight crown hip length (P = .005) with the lightest birth weight (SP2) was significantly higher than the other two groups. To sum up, we suggest that Hu sheep be fed diets with energy and protein levels of 10.52 MJ/kg and 10.99%, respectively.
1. Introduction
Hu sheep, a unique Chinese breed, is recognized for its high prolificacy, early sexual maturity, and year-round oestrus (Feng et al. Citation2018). The experiment on the nutritional requirements of ewes during lactation is a key link in the production, but it is a weak link in local sheep breeds. The requirement of energy and protein level of Hu sheep was mostly studied in the 1990s. With the gradual improvement of feeding conditions and methods, it is no longer suitable for the current requirements (Yang et al. Citation2019).
The rapid development of newborn lambs depends on milk feeding. Early lactation (1–60 d) is the key stage of the whole lactation period (Wang et al. Citation2020). At this time, the digestion and absorption of ewes are rapid and the feed conversion rate is high. If dietary energy is insufficient, it will not only affect the recovery of ewes but also reduce the birth weight of lambs. If the feed energy is too high, it will cause a waste of resources and affect economic benefits. Insufficient dietary protein intake will affect rumen fermentation and reduce growth performance and milk yield of ewes. However, excessive dietary protein intake may lead to an increase in rumen ammonia and blood urea nitrogen concentration, resulting in greater urinary nitrogen losses (Castillo et al. Citation2001; Hristov et al. Citation2004). In ruminants, a partition of dietary crude protein (CP) is more complex than in monogastric animals (Nolan Citation1993). This is mainly due to the unique rumen of ruminants, which can directly convert non-protein nitrogen and low-quality protein into high-quality nutrients such as short-chain fatty acids and microbial proteins through microbial fermentation (Angelidis et al. Citation2019). It is well known that there is a significant correlation between early weight gain of lambs and milk yield of ewes (Torres-Hernandez and Hohenboken Citation1980). Passos et al. (Citation2000) found that offspring weight significantly decreased by reducing the dietary protein level of the mother, and this negative effect would last until the offspring were 6 months old. This is consistent with the experimental results of Teixeira et al.’s (Citation2002) study. This suggests that maternal nutrition may affect the birth weight and metabolism of offspring by regulating milk yield.
In order to give full play to the production potential of lambs and ewes, we assume that properly reducing the dietary energy and protein levels of lactating ewes can also meet the growth needs of ewes and their offspring. Therefore, the purpose of this experiment is to find the lowest and most appropriate dietary energy and protein level for lactating ewes without affecting the growth and development of ewes and their offspring.
2. Materials and methods
The experimental design and procedures were reviewed and approved by the Animal Care and Use Committee of Hunan Normal University, Changsha, Hunan, P.R. China.
2.1. Animals, diets and treatments
This experiment was carried out in Hubei Zhiqinghe Agriculture and Animal Husbandry Co., Ltd., Yichang, Hubei, China. Thirty ewes (43.40 ± 6.17 kg initial BW) giving birth to twin lambs were randomly divided into five experimental groups. The first three groups of ewes were fed diets with different energy levels of E1: 9.52 MJ/kg, E2: 10.02 MJ/kg and E3: 10.52 MJ/kg, respectively (n = 6), the protein levels were kept at 10.99%, and the corresponding lambs were divided into SE1, SE2 and SE3 groups (n = 12). The latter three groups were fed diets with different protein levels of P1: 9.82%, P2 (E2): 10.99% and P3: 12.11%, respectively (n = 6), the energy levels remained the same as 10.02 MJ/kg, and the corresponding lambs were divided into SP1, SP2 (SE2) and SP3 groups (n = 12). The dietary energy and protein level was set according to the nutritional requirement standard (National Research Council Citation2006). The feed was made into a total mixed ration. Dietary nutrients are shown in .
Table 1. Ingredients and chemical analyses of ewe diet.
Each ewe was separately and fed with concentrate and mixed roughage (corn straw and peanut seedlings) at 8:00 and 15:00, with the feeding offer adjusted in the morning to ensure approximately 5% feed refusal. Lambs feeding methods: Breast milk during 1–10 d, breast milk and a small amount of supplementary feeding (concentrate feed) during 11–30 d, breast milk and massive supplementary feeding (concentrate feed) during 31–60 d. The concentrated feed comes from Cargill Feed Co., Ltd., the product code is 3112. During breastfeeding, two offspring lambs were transferred from the next pen to the ewe’s pen.
2.2. Growth and lactation performance and milk composition of lactating ewes
From the beginning of the experiment, ewes and lambs were weighed every 10 d in the morning. The average daily gain (ADG) was calculated from the average of three measurements of individual daily gain (Yin et al. Citation2001). According to the difference of body weight of ewes before and after feeding their offspring, the milk yield was measured at 12:00, 16:00 and 20:00 every 10 d.
Milk samples were collected continuously during the 59 and 60 d of the formal trial period (8:00 and 17:00). Twenty millilitre of milk samples were collected and mixed with antibacterial preservative bromoalcohol (2-bromo-2-nitro-1-mine3-propanediol) and stored at −20°C. The concentration of somatic cell, butterfat rate, milk protein, rate of lactose, the total dry matter, and urea nitrogen was determined by NIRS (MilkoScan FT6000) and SCC using a fluorimetric method (FosSomatics) (both devices from Foss Electric A/S, Hillered, Denmark) (Koczura et al. Citation2019).
2.3. Serum biochemical indexes
On the 60 d of the lactation period, blood samples were randomly collected from 6 ewes and 8 lambs of each group via the jugular vein into a 5 ml vacuum tube without anti-coagulant (Changsha Yiqun Medical Equipment Co., Ltd., Hunan, China) before morning feeding. The samples were centrifuged (1006.2×g at 4°C for 15 min) after kept at room temperature for 2–3 h, the serum was extracted and stored at −80°C until analysed for the biochemical parameters (Yang et al. Citation2012).
During analysis, serum samples were dissolved on ice, and centrifuged (1006.2×g at 4°C for 10 min) before the analysis of total protein (TP) content, albumin (ALB), alanine aminotransferase (ALT), aspartate transaminase (AST), lactate dehydrogenase (LDH), blood urea nitrogen (BUN), blood glucose (GLU), triglyceride (TG), blood cholesterol (CHOL), high-density lipoprotein cholesterol (HDL), low-density lipoprotein cholesterol (LDLC), lactic acid (LACT) and blood ammonia (NH3L) using commercial kits by manufacturer instructions (Roche Diagnostics Products Co., Ltd., Shanghai, China) and were identified using a Cobas C311 analyser (Roche Diagnostics, Rotkreuz, Switzerland) according to the methods described by Chen et al. (Citation2019).
2.4. Growth and body size of lambs
The body size of lambs was measured at 0 and 60 d, respectively. The indexes and methods were as follows (Kabir et al. Citation2014).
Body height: the vertical distance from the shoulder to the ground.
Body length: the distance from the shoulder to the end of the ischial tuberosity.
Chest depth: the vertical distance from the nail to the lower edge of the sternum.
Chest circumference: the length of the posterior edge of the scapula around the chest.
Abdominal circumference: the vertical circumference of the largest part of the abdomen.
Head width: length of transverse muscle lines on both sides of the head.
Head length: the vertical distance from the top of the head to the chin.
Straight crown hip length: the vertical distance from the forehead to the end of the coccyx.
Curved crown hip length: the distance between the end of the forehead along the back and the end of the tailbone.
2.5. Statistical analysis
The data were initially processed by Excel, then analysed by IBM SPSS 20.0 (IBM Corp, Armonk, New York), and multiple comparisons were carried out by DUNCAN. ‘Individual animal effects’ were included as a random term, while diet effects were used as a fixed term. Data were presented as means ± SEM, the significance was analysed by univariate analysis, and probability values P < .05 indicated that the differences were statistically significant.
3. Results
3.1. Growth and lactation performance of lactating ewes
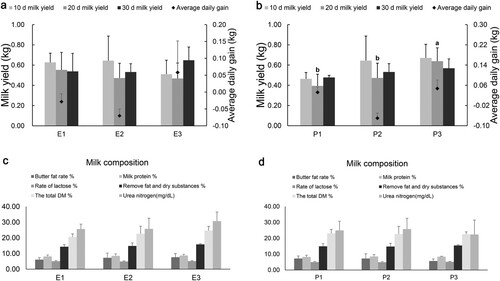
With the increase of dietary energy level to 10.52 MJ/kg, the ADG of ewes changed from negative to positive (P = .005) ((a)). When the dietary energy was maintained at 10.02 MJ/kg, and the protein level was more than 10.99%, the ADG of lactating ewes increased significantly (P < .001) ((b)). Milk yield was not affected by the dietary energy levels of ewes; however, it increased at d 10, d 20 and d 30 with the increase of dietary protein level and reached a significant level at d 20 (P = .017). ((b)). Dietary energy and protein levels had no significant effect on the milk composition of lactating ewes (P > .05) ((c,d)).
Figure 1. Effect of dietary energy and protein level on lactation performance and average daily gain of lactating ewes.
Notes: Ewes were weighed every 10 d in the morning. The average daily gain (ADG) was calculated from the average of three measurements of individual daily gain. According to the difference in body weight of ewes before and after feeding their offspring, the milk yield was measured at 12:00, 16:00 and 20:00 every 10 d. Milk samples were collected continuously during the 59 and 60 d of the formal trial period (8:00 and 17:00). (a) Effect of dietary energy level on milk yield and ADG of ewes. (b) Effect of dietary protein level on milk yield and ADG of ewes. * a and b represent significant differences between each group. (c) Effect of dietary energy level on milk composition of ewes. (d) Effect of dietary protein level on milk composition of ewes. The energy levels of the three diets of ewes were E1 (9.52 MJ/kg), E2 (10.02 MJ/kg) and E3 (10.52 MJ/kg). The protein levels of the three diets of ewes were P1 (9.82%), P2 (10.99%), P3 (12.11%), E2 = P2 (n = 6).
3.2. Serum biochemical indexes
With the increase in dietary energy level, the serum TG content of lactating ewes decreased significantly (P = .018), reached a stable value when the energy level increased to 10.02 MJ/kg, and the glucose (GLU) content reached the highest at 10.02 MJ/kg (). The dietary energy level of ewes had no significant effect on the serum biochemical indexes of their offspring lambs, but the concentration of CHOL increased when the energy level of ewes increased from 10.02 to 10.52 MJ/kg (). With the increase in dietary protein level, the serum TG content of lactation Hu sheep decreased (P = .062), and the BUN concentration of lactation Hu sheep increased significantly (P = .003) (). It is worth noting that the change of serum BUN of lambs is consistent with that of ewes, and the difference is significant (P = .006). The changes of LDH and CHOL in lambs reached a significant level, and the concentration of HDL decreased at first and then increased, the concentration of LDH (P = .049) in SP2 group was the highest, while that of CHOL (P = .033) and HDL (P = .067) was the lowest ().
Table 2. Effects of different energy levels on serum biochemical indexes of lactating ewes.
Table 3. Effects of lactating ewes fed diets with different energy levels on serum biochemical indexes of offspring.
Table 4. Effects of different protein levels on serum biochemical indexes of lactating ewes.
Table 5. Effects of lactating ewes fed diets with different protein levels on serum biochemical indexes of offspring.
3.3. Growth and body size of lambs
On the 11 d of the experiment, the lambs were fed with concentrate supplements based on breast milk. Although the birth weight of lambs in the three groups increased with the increase of dietary energy level of ewes, the difference was not significant (). However, there was a significant difference in ADG at 51–60 days (P = .011), SE3 > SE1 > SE2 group ((a)). After 60 d of experiment, the oblique body length (P = .048), head width (P = .020), head length (P = .033) and curved crown hip length (P = .009) of lambs in SE3 and SE2 groups were significantly higher than SE1 group ().
Figure 2. Effects of lactating ewes fed diets with different energy and protein levels on average daily gain of offspring.
Notes: Lambs were weighed every 10 d in the morning. The average daily gain (ADG) was calculated from the average of three measurements of individual daily gain. (a) Effects of lactating ewes fed diets with different energy levels on ADG of offspring. (b) Effects of lactating ewes fed diets with different protein levels on ADG of offspring. SE2 = SP2. * a and b represent significant differences between each group (n = 12).
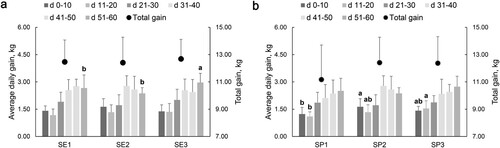
Table 6. Effects of lactating ewes fed diets with different energy levels on body size of offspring.
The concentrate feed intake of lambs in the SP2 group was significantly higher than other two groups (). There was no significant difference in total weight gain among the three groups, but the ADG of lambs in SP2 group reached the maximum at 0–10 d (P = .034). At 11–20 days, the daily gain was SP3 > SP2 > SP1 (P = .021) ((b)). When the lambs were 60 d, the straight crown hip length of SP2 group was the highest (P = .005) ().
Figure 3. Feed intake of concentrated feed for lambs (air-dried basic, kg).
Notes: On the 11 d of the experiment, the lambs were fed with concentrate supplements based on breast milk. SE2 = SP2. ADFI, average daily feed intake (n = 12).
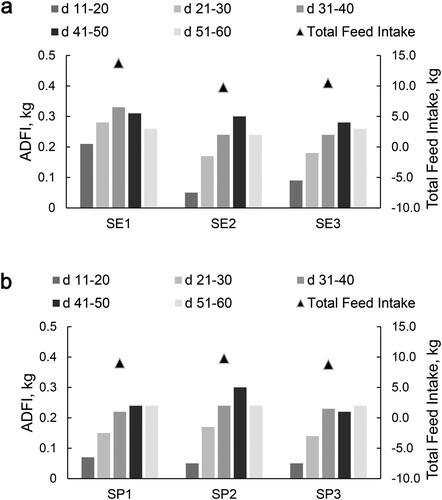
Table 7. Effects of lactating ewes fed diets with different protein levels on body size of offspring.
4. Discussion
For lactating livestock, dietary energy and protein requirements are extremely important. Lack of energy is an important source of stress (Sordillo and Aitken Citation2009; Celi, Citation2010; Singh et al. Citation2011). This negative energy balance produces reactive oxygen metabolites, which leads to oxidative stress and, in severe cases, diseases such as mastitis, retained and placental retention (Sordillo and Aitken Citation2009; Celi, Citation2010). Protein, as the main nitrogen donor of the three major nutrients, is the basic component of tissues and cells. If the intake of protein is insufficient, it will lead to insufficient nutrition and weakness of lactating ewes, and it is easy to lead to lamb disease, dysplasia of body size and lack of immunity. However, excess protein intake can place a burden on the growth and metabolism of the ewe. The part which cannot be used will be deaminated and the excess N is excreted from the body, causing environmental pollution (Nuno et al. Citation2004).
The survival rate of newborn lambs depends on the milk yield and milk composition of ewes (Linden et al. Citation2010; Allah et al. Citation2011). By monitoring the milk yield of ewes, it was found that the milk yield of the high protein level group was significantly higher than that of the low protein level group. Colmenero and Broderick’s (Citation2006) results were similar to this experiment. However, Gonzalez et al. (Citation1985), giving lactating ewes rations containing 13, 16, and 19% CP at ME levels of 19, 23, and 27 MJ/d, observed a milk yield response to protein supplementation only at relatively high-energy intakes. Cowan et al. (Citation1980) reported that where ewes received a higher level of dietary protein during lactation (116 vs. 143 g/kg DM CP), body reserves lost during this time were used more efficiently, leading to increases in milk yield. Jaime and Purroy (Citation1995), who kept ME intake constant at 12.5 MJ/kg, found an increase in ewe milk yield when passing from 13 to 16% CP, irrespective of the protein source (fava beans, soybean cake, and fish meal), which is the same as the results of this experiment.
Lashein et al. (Citation2019) reported that during pregnancy and lactation period and feeding the ewes at high ME can improve the performance of growth and milk production. In this experiment, feeding 10.52 MJ/kg high-energy level diet to lactating ewes could increase the body weight of ewes from negative to positive. However, it does not affect milk production, which may be due to the fact that the energy gradient designed in this experiment is lower than the 20% ratio set by Lashein et al. Both O’Doherty and Crosby (Citation1997) and Mcgovern et al. (Citation2015) suggested that excess protein intake can compensate for inadequate energy nutrition, and this needs to be considered when interpreting the results of this experiment. In this experiment, the dietary protein levels did not affect milk composition, which was similar to the results of Bach et al. (Citation2000) and Bequette et al. (Citation1996). Neither the fat nor the protein content of milk was changed by dietary CP level (Sevi et al. Citation2006).
Corner-Thomas et al. (Citation2015) reported that lambs live birth weights were unaffected by ewes’ nutritional regimens if the lack of differences in ewes’ parameters was measured in late pregnancy. It is worth noting that the ADG of the ewes fed with the P2 group was negative, but the ADG of lambs was significantly higher than that of the other two groups at 0–10 d. During early lactation, the lamb is reliant on milk to meet its nutritional demands (Campion et al. Citation2016), a significant correlation between the growth rate of twin lambs and ewe milk production up to Day 42 of lactation (Snowder and Glimp Citation1991), so we speculate that the weight loss of ewes may be due to the intake of more nutrients by their offspring.
Early supplementary feeding has become a common practice in lamb breeding (Chai et al. Citation2016). With the feed intake of lambs increased, breast milk quantity did not play a decisive role in the growth and development. This may be due to the fact that the rumen of lambs fed concentrate supplementation is more mature than that of breast milk alone, which was consistent with the results of Wang et al. (Citation2016). At 60 d, there was no significant difference in total weight gain among the three groups, but it was worth noting that the growth rate of lambs in the SP2 group was increased, and the length of the straight crown hip length and body height were significantly higher than those of the other two groups, which may be due to the fact that lambs increased their growth rate by increasing feed intake and were in a state of compensatory growth (Lippens et al. Citation2002). In this experiment, the birth weight of lambs in high-energy group was heavier, and the difference became more obvious with the growth and development of lambs. From 51 to 60 d, the trend of ADG of lambs was consistent with the data on concentrate intake. Snowder and Glimp (Citation1991) reported that after 42 d of lactation, the correlation between milk yield and lamb growth rate was insignificant, signifying the lamb’s decreasing dependence on milk as its main nutrient source. It was also found that the oblique body length, head length, head width and curved crown hip length of lambs with higher birth weight were significantly higher than those of the other two groups, so it was speculated that the birth weight would affect the development rate of body size.
The growth and health status can be reflected indirectly by the determination of biochemical indexes (Joshi et al. Citation2002). The concentration of BUN in the serum of lactating ewes and lambs increased with the increase of protein level, which may be due to the low energy of supplementary feed and the negative balance of energy and nitrogen in the rumen, which led to the inhibition of rumen microbial reproduction and the excess of ammonia nitrogen. Indeed, the values were normal even in diets with higher concentrations, a large number of studies have shown that there is a strict correlation between BUN concentration and dietary CP levels (Jaime and Purroy Citation1995; Cannas et al. Citation1998; Frank and Swensson Citation2002), especially when the ME to CP ratio is relatively low, it can result in lower availability of fermentable energy in the rumen, which in turn leads to high ruminal ammonia concentrations and, consequently, to a higher urea production by the liver (Cannas et al. Citation1998). Surprisingly, the changing trend of BUN concentration in lamb serum is the same as that of ewe, but there is no difference between concentrate composition and breast milk composition of lamb. It is well known that sheep milk is rich in protein (Park et al. Citation2007), whether different milk quantities of ewes will lead to different feed intake of lambs and thus affect the change of serum BUN.
The dietary energy level of ewes did not affect the serum biochemical indexes of their offspring lambs, but affected the lipid metabolism of ewes. The serum TG content of ewes fed with a dietary energy level of 9.52 MJ/kg was significantly higher than that of the other two groups. The serum TG content of ewes fed with energy levels of 10.02 and 10.52 MJ/kg was the same, indicating that the dietary energy level of 9.52 MJ/kg might not meet the metabolic requirements of Hu sheep. Fat utilization efficiency was low, and fat utilization increased with the increase of energy level to 10.02 MJ/kg. The continued increase in energy levels did not affect the fat metabolism of ewes. The TG concentration of ewes decreased, indicating that the intake of a high protein diet increased the fat utilization rate of ewes, which may be the reason why the ADG of ewes decreased when the protein level increased from 9.82% to 10.99%. When the protein level increased to 12.11%, the fat utilization rate continued to increase, and the ADG of ewes increased, indicating that 12.11% of the protein level exceeded the nutritional needs of ewes and reached an amount of fat deposition.
There is a glycolytic enzyme-lactate dehydrogenase (LDH), that can catalyse the formation of lactic acid from pyruvate. The activity of serum LDH can reflect the stress sensitivity of the body. The concentration of LDH in the serum of lambs in the SP3 group was significantly lower than that in SP1 and SP2 groups, which was consistent with the difference in daily feed intake of lambs, indicating that the decrease in feed intake of lambs may significantly inhibit the production of lactic acid from pyruvate and reduce the sensitivity to stress. And the concentration of CHOL in lamb serum decreased at first and then increased. All these indicate that the lipid metabolism of offspring has been changed.
In conclusion, in the early stage of lactation, dietary protein levels can affect the ADG lambs by affecting milk yield. When the dietary energy level of ewes was properly increased, the fat utilization efficiency of ewes could be improved, and ewes fed 10.52 MJ/kg diet could better meet their growth and lactation needs. We recommend that Hu sheep be fed diets with energy and protein levels of 10.52 MJ/kg and 10.99% respectively to ensure the growth and development needs of ewes and lambs.
Animal welfare statement
The experimental protocol was approved by the Animal Care and Use Committee of Hunan Normal University, Changsha, Hunan, China. The authors confirm that they have followed EU standards for the protection of animals used for scientific purposes and feed legislation.
Acknowledgements
We thank the staff at the Laboratory of Animal Nutrition and Human Health, College of Life Sciences, Hunan Normal University, for support. Thank Academician Yin Yulong for his strong support of our work.
Disclosure statement
No potential conflict of interest was reported by the author(s).
Data availability statement
The authors confirm that the data supporting the findings of this experiment are available within the article [and/or] its supplementary materials.
Additional information
Funding
References
- Allah MA, Abass SF, Allam FM. 2011. Factors affecting the milk yield and composition of Rahmani and Chios sheep. Int J Livest Prod. 2:024–030.
- Angelidis A, Crompton L, Misselbrook T, Yan T, Reynolds CK, Stergiadis S. 2019. Evaluation and prediction of nitrogen use efficiency and outputs in faeces and urine in beef cattle. Agric Ecosyst Environ. 280:1–15.
- Bach A, Huntington GB, Calsamiglia S, Stern MD. 2000. Nitrogen metabolism of early lactation cows fed diets with two different levels of protein and different amino acid profiles. J Dairy Sci. 83:2585–2595.
- Bequette BJ, Metcalf JA, Wray-Cahen D, Backwell FR, GFtton JD, Lomax MA, Macrae JC, Lobley GE. 1996. Leucine and protein metabolism in the lactating dairy cow mammary gland: responses to supplemental dietary crude protein intake. J Dairy Res. 63:209–222.
- Campion FP, McGovern FM, Lott S, Fahey AG, Creighton P, Boland TM. 2016. Comparison of energy rationing systems for late gestation ewes: impacts on ewe and lamb performance. J Anim Sci. 94:3441–3456.
- Cannas A, Pes A, Mancuso R, Vodret B, Nudda A. 1998. Effect of dietary energy and protein concentration on the concentration of milk urea nitrogen in dairy ewes. J Dairy Sci. 81:499–508.
- Castillo AR, Kebreab E, Beever DE, Barbi JH, Sutton JD, Kirby HC, France J. 2001. The effect of protein supplementation on nitrogen utilization in lactating dairy cows fed grass silage diets. J Anim Sci. 79:247–253.
- Celi P. 2010. The role of oxidative stress in small ruminants’ health and production. Rev Bras Zootec. 39:348–363.
- Chai JM, Ma T, Wang HC, Qi ML, Tu Y, Diao QY, Zhang NF. 2016. Effect of early weaning age on growth performance, nutrient digestibility, and serum parameters of lambs. Anim Prod Sci. 57:110–115.
- Chen C, Wang Z, Li J, Li Y, Huang P, Ding X, Yin J, He S, Yang H, Yin Y. 2019. Dietary vitamin E affects small intestinal histomorphology, digestive enzyme activity, and the expression of nutrient transporters by inhibiting proliferation of intestinal epithelial cells within jejunum in weaned piglets. J Anim Sci. 97:1212–1221.
- Colmenero JJ, Broderick GA. 2006. Effect of amount and ruminal degradability of soybean meal protein on performance of lactating dairy cows. J Dairy Sci. 89:1635–1643.
- Corner-Thomas RA, Back PJ, Kenyon PR, Hickson RE, Ridler AL, Stafford KJ, Morris ST. 2015. Ad libitum pasture feeding in late pregnancy does not improve the performance of twin-bearing ewes and their lambs. Asian-Australas J Anim Sci. 28:360–368.
- Cowan RT, Robinson JJ, Mcdonald I, Smart R. 1980. Effects of body fatness at lambing and diet in lactation on body tissue loss, feed intake and milk yield of ewes in early lactation. J Agric Sci. 95:497–514.
- Feng X, Li F, Wang F, Zhang G, Pang J, Ren C, Zhang T, Yang H, Wang Z, Zhang Y. 2018. Genome-wide differential expression profiling of mRNAs and lncRNAs associated with prolificacy in Hu sheep. Biosci Rep. 38:BSR20171350.
- Frank B, Swensson C. 2002. Relationship between content of crude protein in rations for dairy cows and milk yield, concentration of urea in milk and ammonia emissions. J Dairy Sci. 85:1829–1838.
- Gonzalez JS, Robinson JJ, McHattie I. 1985. The effect of level of feeding on the response of lactating ewes to dietary supplements of fish meal. Anim Sci. 40:39–45.
- Hristov AN, Etter RP, Ropp JK, Grandeen KL. 2004. Effect of dietary crude protein level and degradability on ruminal fermentation and nitrogen utilization in lactating dairy cows. J Anim Sci. 82:3219–3229.
- Jaime C, Purroy A. 1995. Level and quality of protein in rations for lactating ewes. Annales de Zootechnie. 44:135–142.
- Joshi PK, Bose M, Harish D. 2002. Changes in certain haematological parameters in a siluroid cat fish Clarias batrachus (Linn) exposed to cadmium chloride. Pollut Res. 21:129–131.
- Kabir M, Sarker M, Saha B, Khandoker M, Moniruzzaman M. 2014. Effect of different levels of dietary energy on growth and carcass traits of black bengal goat. Bangladesh J Anim Sci. 43:159–165.
- Koczura M, Martin B, Turille G, Marchi MD, Kreuzer M, Berard J. 2019. Milk composition, but not cheese properties, are impaired the day after transhumance to alpine pastures. Int Dairy J. 99:104540.
- Lashein ME, Abd-Allah M, Hussein AMA, Tawfik MH. 2019. Effects of nutrition plane on productive performances of Ossimi ewes and their offspring during pregnancy and lactation periods. Arch Agric Sci J. 2:1–14.
- Linden D, Lopez-Villalobos N, Kenyon PR, Thorstensen E, Jenkinson C, Peterson SW, Blair HT. 2010. Comparison of four techniques to estimate milk production in singleton-rearing non-dairy ewes. Small Ruminant Res. 90:18–26.
- Lippens M, Huyghebaert G, Groote GD. 2002. The efficiency of nitrogen retention during compensatory growth of food-restricted broilers. Br Poult Sci. 43:669–676.
- Mcgovern FM, Campion FP, Lott S, Boland TM. 2015. Altering ewe nutrition in late gestation: I. The impact on pre- and postpartum ewe performance. J Anim Sci. 93:4860–4872.
- National Research Council. 2006. Nutrient requirements of small ruminants: sheep, goats, cervids, and new world camelids. Washington (DC): National Academies Press.
- Nolan JV. 1993. Nitrogen kinetics. In: Forbes JM, France J, editors. Quantitative aspects of ruminant digestion and metabolism. Cambridge: CAB; p. 123–143.
- Nuno DC, Christine MG, Bai Q, Wood JD, Gary E, Chang KC. 2004. Restriction of dietary energy and protein induces molecular changes in young porcine skeletal muscles. J Nutr. 9:2191–2199.
- O’Doherty JV, Crosby TF. 1997. The effect of diet in late pregnancy on colostrum production and immunoglobulin absorption in sheep. Anim Sci. 64:87–96.
- Park YW, Juárez M, Ramos M, Haenlein G. 2007. Physico-chemical characteristics of goat and sheep milk. Small Ruminant Res. 68:88–113.
- Passos MCF, Ramos CF, Moura EG. 2000. Short and long term effects of malnutrition in rats during lactation on the body weight of offspring. Nutr Res. 20:1603–1612.
- Sevi A, Albenzio M, Annicchiarico G, Caroprese M, Marino R, Santillo A. 2006. Effects of dietary protein level on ewe milk yield and nitrogen utilization, and on air quality under different ventilation rates. J Dairy Res. 73:197–206.
- Singh VK, Pattanaik AK, Sharma K, Saini M. 2011. Effect of dietary energy intake on erythrocytic antioxidant defence in growing lambs fed a wheat straw-based diet. Anim Prod Sci. 51:642–649.
- Snowder GD, Glimp HA. 1991. Influence of breed, number of suckling lambs, and stage of lactation on ewe milk production and lamb growth under range conditions. J Anim Sci. 69:923–930.
- Sordillo LM, Aitken SL. 2009. Impact of oxidative stress on the health and immune function of dairy cattle. Vet Immunol Immunopathol. 128:104–109.
- Teixeira CV, Passos M, Ramos C, Dutra S, Moura E. 2002. Leptin serum concentration, food intake and body weight in rats whose mothers were exposed to malnutrition during lactation. J Nutr Biochem. 13:493–498.
- Torres-Hernandez G, Hohenboken W. 1980. Relationships between ewe milk production and composition and preweaning lamb weight gain. J Anim Sci. 50:597–603.
- Wang J, Zhou H, Hickford J, Hao Z, Li S. 2020. Comparison of the transcriptome of the ovine mammary gland in lactating and non-lactating small-tailed Han sheep. Front Genet. 11:472.
- Wang W, Li C, Li F, Wang X, Zhang X, Liu T. 2016. Effects of early feeding on the host rumen transcriptome and bacterial diversity in lambs. Sci Rep. 6:32479.
- Yang CT, Wang CM, Zhao YG, Chen TB, Yan T. 2019. Updating maintenance energy requirement for the current sheep flocks and the associated effect of nutritional and animal factors. animal. 14:1–8.
- Yang H, Fu D, Shao H, Kong X, Wang W, Yang X, Nyachoti C, Yin YL. 2012. Impacts of birth weight on plasma, liver and skeletal muscle neutral amino acid profiles and intestinal amino acid transporters in suckling Huanjiang mini-piglets. PLoS One. 7:e50921.
- Yin YL, Baidoo SK, Schulze H, Simmins PH. 2001. Effects of supplementing diets containing hulless barley varieties having different levels of non-starch polysaccharides with β-glucanase and xylanase on the physiological status of the gastrointestinal tract and nutrient digestibility of weaned pigs. Livest Prod Sci. 71:97–107.