
 ?Mathematical formulae have been encoded as MathML and are displayed in this HTML version using MathJax in order to improve their display. Uncheck the box to turn MathJax off. This feature requires Javascript. Click on a formula to zoom.
ABSTRACT
This study aimed to investigate the bioactive polypeptides of dairy cows' placenta and establish an effective enzymatic hydrolysis evaluation index for preparing bioactive hydrolysates. Hydrolysed placental homogenates by trypsin and papain and evaluated hydrolysis time, substrate concentrations and Enzyme/Substrate ratio to hydrolysates extraction rate and also their reducibility by Box-Behnken central response model. Optimal hydrolysis conditions of trypsin and papain for the highest extraction rate and reducibility were as follows: hydrolysis time 5.78, 5.13 h and 6.18, 3.95h; substrate concentrations 30.21, 35.59 %, and 34.78, 22.04 %, E/S 3.24, 4.19% and 5.00, 3.64%, respectively. The corresponding extraction rates and Vit.C equivalent were 5.55% and 39.32 μg/mg for trypsin, 6.97% and 70.54 μg/mg for papain. Correlations between the extraction rate and reducibility were significant in trypsin but not in papain. Optimized hydrolysis conditions with the highest integrated extraction rate (I) of trypsin and papain were as follows; hydrolysis time 5.8 and 4.7h; substrate concentrations 34.98 and 34.03 %; E/S 3.33 and 3.66%, respectively and corresponding integrated extraction rates were 2037.92 and 4414.09 μg·g−1, respectively. These results indicated that papain has higher hydrolysis efficiency than trypsin and I value is applicable for evaluating bioactive enzymatic hydrolysis of the placenta of dairy cows.
1. Introduction
Placenta has many bioactive components, i.e. peptides, hormones, lipids, etc. Placental peptides of goats have been developed as nutraceuticals (Teng et al. Citation2011). However, the placenta of dairy cows is often discarded without exploiting their beneficial components for the welfare of human beings. For better management of discarded dairy placenta, it is a challenge to use the valuable lipid and protein fractions from these animal by-products (Rustad and Falch Citation2002). The production of placental protein hydrolysates can help to avoid the depletion of the commercially important placental stocks, reduce the environmental pollution from waste of placenta and supply nutritious and functional proteins. There is an increasing interest in the development of fast and gentle enzymatic production methods as an alternative to mechanical or chemical treatments that often damage the products and reduce their efficient utilization. The amount of raw material being converted into soluble hydrolysate is especially important for industrial processes. But the yield of soluble material obtained in a standard batch process using commercial protease was low. So it is vital to explore the processing methods to increase the yield and bioactivity. Enzymatic hydrolysis is one of the primary method to produce bioactive polypeptides from animal tissues, especially placenta (Adlernissen Citation1986; Durak et al. Citation2013). Proteases are used to hydrolyze peptide bonds of proteins, and protease digestion is widely applied in proteomics, food industry and polypeptides preparation (Tavano Citation2013). Research showed that trypsin exhibited the best efficiency of porcine placental hydrolysis and the narrowest ranges of Mw distribution compared to that of pepsin and chymotrypsin (Jung et al. Citation2014). It is proved that several polypeptides with different bioactivity, like hypotensive, anti-oxidant, anti-inflammation, etc. can be isolated from protein hydrolysates (Maria Gabriela et al. Citation2012; Chen et al. Citation2016; Zhang et al., Citation2019). Mechanisms and pathways for the extraction of those proteolysed polypeptides have also become clearer in the further researches (Hyun Jung et al. Citation2011). However, those studies were mainly focused on promoting the biological activities while the extraction rate of those bioactive peptides was rarely optimized (Chand Citation2009; Cao et al. Citation2011;). Recent research showed that extraction efficiency and bioactivity of hydrolysed polypeptides were not correlated, which means enzymatic hydrolysis conditions for high-activity polypeptides may not correspond with a high extraction rate (Li et al. Citation2016). Thus, the index for the optimization of bioactive polypeptides hydrolysis protocol, which represents both bioactivity and extraction efficiency, could be a superior parameter. In this study, we hydrolyzed the placenta of dairy cows by trypsin and papain, established the response surface model of hydrolysis time, substrate concentration and enzyme–substrate ratio (E/S) to extraction rate and bioactivity separately. Then, we analyzed the Pearson correlation coefficient between the extraction rate and bioactivity and the optimized proteolysis protocol by integrated extraction rate (extraction rate and bioactivity) (I) defined by the reducibility of placental hydrolysates per gram of placental tissue. The ‘I’ showed considerable evaluation effectiveness in the placental enzymatic hydrolysis protocol optimization and may apply to the proteolysis evaluation.
2. Materials and methods
2.1. Materials
Fresh placentas of normally parturated, healthy Chinese Holstein cows were collected and rinsed by normal saline immediately to remove the blood and dirt, then stored at −20°C.
2.2. Homogenization of cow’s placental tissue
Frozen placental tissues were segmented, weighted and loaded a beaker. Later, they were thawed at 37°C by HH-4 digital display constant temperature water bath (Changzhou Guohua Electric Co., Ltd.), shredded with scissors and homogenized at 12,000 rpm in the ice bath until no tissue fragments were visible.
2.3. Hydrolysis tissue homogenization
Placental homogenates were hydrolysed with trypsin (250 µ/mg, batch number 920T041) and papain (800 µ/mg, batch number 621G025, Solarbio Life Science Co., Ltd.) strictly following the conditions of optimum temperature and pH. Subsequently, enzymes were in-activated in boiling water bath for 10 min. Hydrolysed liquid was centrifuged at 6000 rpm for 10 min by Sorvall™ Legend™ XT Refrigerated Centrifuge (Thermofisher Scientific Co., Ltd) and collected the supernatant to freeze-dry with LYOQUEST Freeze Dryer (Azbiler Telstar Mechanical & Electrical Equipment Co., Ltd) for 24 h. Later, we obtained the freeze-dried powder as placental hydrolysates, weighed the hydrolysates and calculated the extraction rate (R) by the equation: 100* hydrolysates mass /homogenized placental mass.
Then we designed the hydrolysis conditions based on Box–Behnken Center Response by Design expert 8.0.6, selected hydrolysis time (A), substrate concentration (B), and Enzyme/ substrate mass ratio E/S (C) as factors into three factors and three levels test design, with total 17 test points including 5 central and 12 factorial points. The level design referenced to goat placental enzymatic conditions. Level −1, 0 and 1 of factor A, B and C represent 3, 5, 7 h of hydrolysis, 10%, 30%, 50% of substrate concentration, and 1%, 3%, 5% of E/S, respectively.
2.4. Establishment of Prussian blue standard curve
This study applied the Prussian blue method to measure the reducibility of placental hydrolysates. Reducing samples can reduce potassium ferricyanide to potassium ferrocyanide (K4Fe(CN)6·3H2O) and generate Prussian blue (Fe4[Fe(CN)6]3) with Fe3+. Prussian blue has an absorbance peak at 700 nm (A700), and the A700 showed a linear correlation to the Prussian blue concentration. Our study used 100, 50, 25, 12.5, 6.25 and 3.125 μg/ml of Vit.C solution to establish the standard curve. Ten per cent trichloroacetic acid solution, 1% potassium ferricyanide solution, 0.1% ferric chloride solution and phosphate buffer solution (pH 6.6) were additionally prepared.
We infused 75 μl of phosphate buffer and 1% potassium ferricyanide solution separately into 75 μl of each standard solution, oscillated and water bathed for 20 min. Seventy-five millilitres of 10% trichloroacetic acid solution was injected subsequently. Finally, we centrifuged these components at 3000 rpm for 1 min to prepare the test solution. Two hundred millilitres of each test solution was poured into the wells of a 96-well plate and implanted 20 μl of ferric chloride solution subsequently. A700 was measured and a standard curve was established by linear regression equation in SPSS 24.0, using the Vit.C concentration of standard solutions as the abscissa and their A700 as the ordinate.
2.5. Measurement of reducing power
Placental hydrolysates of each group were dissolved in 1 mg/mL sample solution, then measured the A700 with Varioskan LUX full-wavelength multi-function microplate reader (Thermofisher Scientific Co., Ltd.) according to the protocol in 1.3.2. We used A700 of each sample solution into the standard curve to acquire the reducibility, and showed as Vit.C equivalent (μg/mg), of the placental hydrolysates.
2.6. Data analysis
Used Design expert 8.0.6 to analyse the extraction rates and reducibility of the placental hydrolysates and established a response surface model with hydrolysis time (A), substrate concentration (B) and E/S (C) as factors separately and confirmed the fitness and reliability of those models.
2.7. Establishment and optimization of hydrolysis conditions
In order to verify the reliability of the response surface models, verification tests with six repetitions were proceeded under the model-optimized conditions. Then we analysed the correlation between extraction rate and reducibility of placental hydrolysates in each group. Based on correlation analysis, we set a novel index for hydrolysis evaluation, the reducibility of placental hydrolysates extracted from one gram of placental tissue, and defined as the Integrated extraction rate (I, μg/g). Then we applied ‘I’ to form new response surface models of both enzymatic hydrolysis protocol and confirmed their fitness and reliability. Verification tests with six repetitions were also performed.
3. Results
3.1. Establishment of Prussian blue standard curve
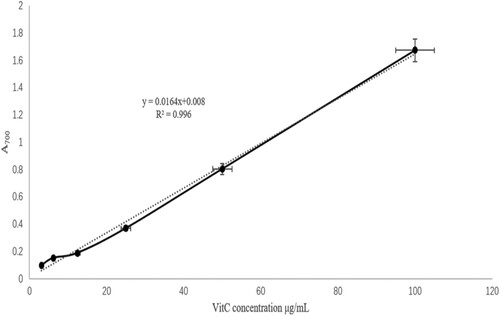
The results of Prussian blue standard curve establishment is shown in , the corresponding A700 of standard Vit.C solutions with concentration 100, 50, 25, 12.5, 6.25 and 3.125 μg/ml were 1.67, 0.802, 0.367, 0.187, 0.15 and 0.097 respectively. A liner regression model:
was established by SPSS 24.0. The SE of intercept and the independent variable is 0.0025 and 0.001, respectively. Relevant R2 was 99.6%, and showed a reliable prediction ability.
Figure 1. Prussian blue standard curve for vitamin C. This figure shows that the corresponding A700 of standard Vit.C solutions with concentration 100, 50, 25, 12.5, 6.25 and 3.125 μg/mL were 1.67, 0.802, 0.367, 0.187, 0.15 and 0.097. A liner regression model A700 = 0.0164*Vit.C concentration +0.008 was established by SPSS 24.0. The SE of intercept and the independent variable are 0.0025 and 0.001. Relevant R2 was 99.6%, showed a reliable prediction ability.
3.2. Factors affecting placental trypsin hydrolysate
Hydrolysis of placental homogenates was done by strictly following the conditions of temperature (37°C) and Ph (8.0). The actual yield, amount of substrate and enzyme is shown in the .
Table 1. Response surface results of placenta trypsin hydrolysis of polypeptides.
Response surface models of factors to extraction rate and Vit.C equivalent were established individually. Response surface regression equation of extraction rate (R) and Vit.C equivalent were:
shows the regression analysis results of both models. Both models were very significant (p < .01) and no significant lack of fitness was found (p > .05). Both models showed considerable demonstration and reliability in the statistical analysis. Variance A, C, B2 and C2 showed very significant effects on the extraction rate (p < .01), F-value showed influence rank among the factors: C > A > B. In the Vit.C equivalent model, variance A, B, C, AB, BC, AC, A2, B2 and C2 all showed very significant effects on the reducing capability (p < .01) Factors influencing ranking by F-value were B > C > A.
Table 2. Regression model analysis of variance analysis of trypsin-digested placenta.
The acceleration of the extraction rate declined with higher hydrolysis time ((a,c)), indicating that the enzymatic reaction was almost complete in the designed levels; the extraction rate showed a parabola-like trend with increasing E/S ((b,c)), but test groups with higher E/S still had higher extraction rate in the whole test, which may be due to self-hydrolysis in high enzyme concentration. Vit.C equivalent model also showed a parabola-like trend with increasing hydrolysis time ((d,f)) and E/S ((e,f)), and the interaction of E/S and hydrolysis time showed a negative correlation with reducibility of placental hydrolysates very significantly (p < .01).
Figure 2. Effect of interactions of various factors on the extraction rate and reducing power of trypsin-digested cow’s placenta. In this figure, (a, d) are the time-substrate concentration interaction diagram; (b, e) are E/S-substrate concentration interaction diagram; (c, f) are time-E/S concentration interaction diagram. The level of the factors that do not appear in each subgraph is coded as 0, the same below. And the Z-axis of (a–c) is the extraction rate, while that of (d–f) is Vit.C equivalent.
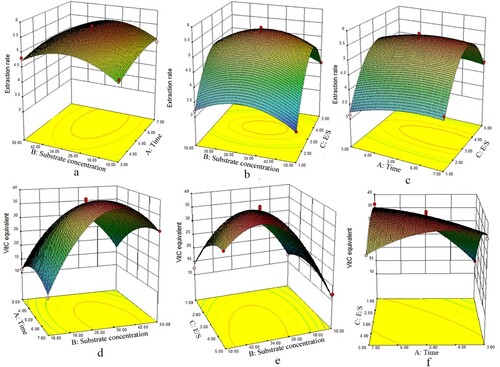
Optimized levels of all factors to maximize the extraction rate and reducing capability basing on the response surface model separately, the optimized enzymatic hydrolysis conditions were: hydrolysis time 5.78 and 5.13 h; substrate concentrations 30.21 and 35.59%, E/S 3.24 and 4.19%, corresponding extraction rate and Vit.C equivalent were 5.55% and 39.32 μg/mg, respectively. Applied six repetition test under the optimized conditions to verify the reliability of both models, actual hydrolysis time was 5.75 and 5.2 h, substrate concentration 30 and 35%, E/S 3 and 4%, actual extraction and Vit.C equivalent were 5.48% and 39.67 μg/mg in average, which is close to the theoretical value.
3.3. Factors affecting the placental papain hydrolysate
Placental homogenates were hydrolysed by strictly following the conditions of pH and temperature (pH 8.0, 55°C). Actual yield, substrate and enzyme mass are shown in .
Table 3. Response surface results of placenta papain hydrolysis of polypeptides.
Response surface models of factors to extraction rate and Vit.C equivalent were established individually. Response surface regression equation of extraction rate (R) and Vit.C equivalent were:
As shown in , the regression models were very significant (p < .01), and no significant lack of fitness has been found (p > .05). R2 was 96.56% and 99.22%, and adjustment R2 was 92.14% and 98.21%. Both models showed considerable demonstration and reliability in the statistical analysis. Variance A, B, C, A2 and C2 have very significant effects on the extraction rate (p < .01), F-value showed influence rank among the factors: C > A > B. In the Vit.C equivalent model, variance A, C, AC, A2 and C2 all had very significant effects on the reducing capability (p < .01), factors influence ranking by F-value was A > C > B.
Table 4. Regression model analysis of variance analysis of papain-digested placenta.
The acceleration of extraction rate declined by increasing hydrolysis time, indicating that substrate was hydrolysed completely in the designed range ((a,c)). Substrate concentration, E/S and hydrolysis time all had positive effects on the extraction rate, the interaction of hydrolysis time and E/S also positively involved in the extraction rate ((a–c)). Vit.C equivalent showed parabola-like trends with increasing hydrolysis time and E/S when one of these two factors was stable; Vit.C equivalent raised with increased E/S under fixed substrate concentration, and got higher with declined hydrolysis time ((d–f)).
Figure 3. Effect of interactions of various factors on the extraction rate and reducing power of papain-digested cow’s placenta. In this figure, (a, d) are the time-substrate concentration interaction diagram; (b, e) are E/S-substrate concentration interaction diagram; (c, f) are time-E/S concentration interaction diagram. And the Z-axis of (a–c) is the extraction rate, while that of (d–f) is Vit.C equivalent.
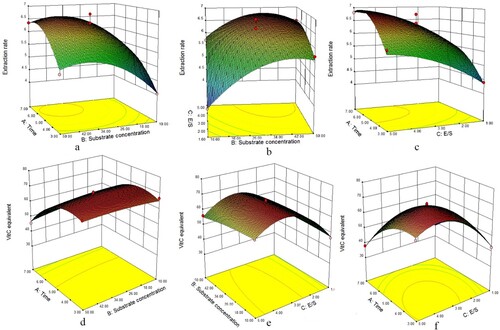
We optimized levels of all factors to maximize the extraction rate and reducing capability based on the response surface model separately. The optimized enzymatic hydrolysis conditions were: hydrolysis time 6.18 and 3.95 h; substrate concentrations 34.78 and 22.04%, E/S 5.00 and 3.64%, corresponding extraction rate and Vit.C equivalent was 6.97% and 70.54 μg/mg. We applied six repetition tests under the optimized condition to verify the reliability of both models, actual hydrolysis times were 6.20 and 4.00 h, substrate concentration 35.00% and 22.00%, E/S 5.00% and 3.50%, practical extraction rate and Vit.C equivalent was 5.48% and 39.67 μg/mg in average, which was close to the theoretical value.
3.4. Enzymatic hydrolysis optimization
Pearson correlation coefficient between extraction rates and Vit.C equivalents of trypsin and papain hydrolysis were 0.498 (p = .012) and 0.176 (p = .5), which means the relevance between extraction rate and Vit.C equivalent may be variable in the hydrolysis process of different proteases. To merge the extraction rate and Vit.C equivalent of the enzymatic hydrolysis process, we established an integrated index of extraction rate and hydrolysate activity as the integrated extraction rate (I) defining as Vit.C equivalent of hydrolysates extracted from one gram of placental homogenates, and optimized the hydrolysis process based on response surface by I value and the results are shown in .
Table 5. Optimization of placental trypsin and papain enzymatic hydrolysates.
3.5. Optimization of trypsin placental hydrolysis
I value of placental trypsin hydrolysates were shown in . We established the response surface model by I value, and acquired the equation as:
shows that the regression model was very significant (p < .01), and no significant lack of fitness has been found (p > .05). R2 was 94.29%, adjustment R2 was 86.95%. Variance A, B, C, A2, B2 and C2 had very significant effects on the I value (p < .01), F-value showed influence rank among the factors: B > A > C.
Table 6. Results of variance analysis of I value-based trypsin-digested placenta regression model.
shows that I value raised with hydrolysis time under high substrate concentration and fixed E/S ((a)); when hydrolysis time fixed, E/S showed a positive interaction with I value corresponding to substrate concentration ((b)). Under specific substrate concentration, I value elevated with hydrolysis time in lower E/S, but showed a parabola-like trend when the E/S was higher ((c)).
Figure 4. Effect of interactions of various factors on I value of trypsin-digested cow’s placenta. The Z-axis is integrated extraction rate (I); (a) is the time-substrate concentration interaction diagram, (b) is the concentration-enzyme bottom ratio interaction diagram and (c) is the enzyme bottom ratio-time interaction diagram.
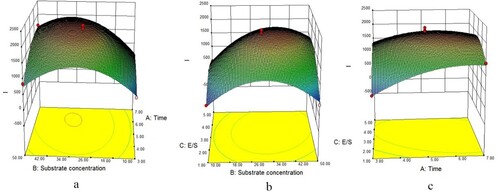
We optimized enzymatic hydrolysis conditions with the highest I value and hydrolysis conditions were: hydrolysis time 6.18 and 5.8 h; substrate concentrations 34.96%, E/S 3.33%, the corresponding I was 2037.92 μg·g−1. Applied six repetition tests under the optimized condition to verify the reliability of both models, actual hydrolysis time was 5.80 h, substrate concentration 35.00%, E/S 3.30%, practical I value was 2040 μg·g−1 in average, which was close to the theoretical value.
3.6. Optimization of papain placental hydrolysis
shows the I value of placental papain hydrolysates. We established the response surface model by I value and acquired the equation as:
shows that the regression model was very significant (p < .01), and no significant lack of fitness has been found (p > .05). R2 was 97.66%, adjustment R2 was 94.65%. Variance C, A2, B2 and C2 had very significant effects on the I value (p < .01). Variance B and AC showed significant effects on the I value (p < .05). F-value showed influence rank among the factors as: C > B > A.
Table 7. Results of variance analysis of I value-based papain-digested placenta regression model.
shows that, under a specific E/S, I value increased with higher substrate concentration, and the differences of I value between the higher and lower substrate concentrations decreased with the progression of hydrolysis ((a)). When hydrolysis time was fixed, I value increased with E/S, and higher E/S inhibited the I value differences caused by substrate concentrations ((b)). E/S and hydrolysis time showed negative interaction when substrate concentration was fixed ((c)).
Figure 5. Effect of interactions of various factors on I value of papain-digested cow’s placenta. The Z-axis is integrated extraction rate (I); (a) is the time-substrate concentration interaction diagram, (b) is the concentration-enzyme bottom ratio interaction diagram and (c) is the enzyme bottom ratio-time interaction diagram.
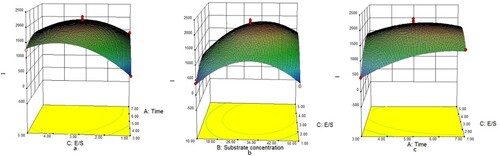
Optimized enzymatic hydrolysis conditions with the highest I value were: hydrolysis time 6.18 and 4.7 h; substrate concentrations 34.03%, E/S 3.66%, the corresponding I was 2037.92 μg·g−1. We applied six repetition tests under the optimized condition to verify the reliability of both models, the actual hydrolysis time was 4.70 h, substrate concentration 34.00%, E/S 3.60%, practical I value was 4397.32 μg·g−1 on an average, which was close to the theoretical value.
4. Discussions
4.1. Factors affecting the extraction rate and reducibility of placental trypsin hydrolysates
Trypsin is a protease found in the gastrointestinal tract of animals and is applied widely in cell incubation, proteomic research, and polypeptides preparation because of its specificity. Trypsin has high activity, and less self-enzymatic reaction under the optimum conditions (37°C and pH 8.0), and the substrates can be hydrolysed effectively by it (Ballatore et al. Citation2020). Based on its high specificity, trypsin can hydrolyse proteins into polypeptides steadily, and many trypsin hydrolysates showed bioactivities in different pathways. However, the yield and activity may not always have a positive correlation (Sani et al. Citation2012). Natural proteins often have a complex structure with a considerable molecular weight, which means the proteolytic site maybe not unique in the molecule; the peptides hydrolysed from protein could be further hydrolysed to become smaller and shorter. Conversion of proteins to peptides and from peptides to smaller peptides occurs at the same time once the hydrolysis reaction is started, which means bioactive polypeptides were produced and reduced simultaneously during the proteolysis process (Chou and Friedman Citation2016). Therefore, hydrolysis is an indicator of hydrolysis progress, but not a suitable evaluation index for the bioactive polypeptides preparation. This study is based on the Box–Behnken central response design to establish a quadratic regression model to fit the influence of factors also their interaction to extraction rate and reducibility, trying to clarify the optimum hydrolysis conditions. Variance analysis of regression models showed that hydrolysis time and E/S had very significant effects on the extraction rate. All factors and their interactions influenced the reducibility very significantly (P < .01). Response surface models indicated that trypsin hydrolysates from the placenta of dairy cows could have maximum extraction rate and reducibility separately: the maximum extraction rate is 5.55% under hydrolysis time 5.78 h, substrate concentration 30.21% and E/S 3.24; maximum reducibility, 39.32μg/mg, can be reached in hydrolysis time 5.13 h, substrate concentration 35.59% and E/S 4.19%. These results showed that trypsin could hydrolyse insoluble proteins into soluble peptides during the test. However, the acceleration of the extraction rate declined with the continuation of hydrolysis, showing that the placental homogenates hydrolysed completely in the designed range. Meanwhile, the interaction of E/S and hydrolysis time has a very significant negative correlation with the reducibility, indicating that the hydrolysis progress is vital for preparing bioactive hydrolysates.
4.2. Factors affecting the extraction rate and reducibility of placental papain hydrolysates
Papain is a protease extracted and isolated from Carica papaya that can cleave peptide bonds from carboxyl groups in L-arginine, L-lysine, glycine and L-citrulline residues in the protein and is widely used in the food industry (Damrongsakkul et al. Citation2008). Papain can hydrolyse animal and plant tissues into bioactive peptides that are functionally related to anti-oxidant, hypotensive and pro-immune polypeptides (Hui et al. Citation2009; Alpay and Uygun Citation2015; Xue et al. Citation2019;). This study administers enzymatic hydrolysis strictly following the instructions of pH and temperature (pH 6.5, 55°C). However, the optimum pH was variable and was determined by the chemical and physical features of substrates. For example, the optimum pH for hydrolyzing plant tissue is usually acidic (Ou et al. Citation2010) while for animal tissue, the optimum pH is usually alkaline (Vien et al. Citation2017). It was suspected that the multiple cleavage sites of papain may hydrolyse proteins to peptides with different isoelectric points and a change in pH of the hydrolysis system will further impact the ingredient of hydrolysates (Asbóth and Polgár Citation1977). This may be the reason for various ranges of reducibility of placental papain hydrolysates under different hydrolysis conditions, mainly influenced by E/S, hydrolysis time, and their interaction significantly. This study verified the optimum conditions for placental papain hydrolysates corresponding to the maximum extraction rate and reducibility separately. The maximum extraction rate was 6.97% under 6.18 h of hydrolysis, substrate concentration of 34.78%, and 5% E/S. The highest Vit.C equivalent 70.54 μg/mg was available under the hydrolysis conditions of time of 3.95 h, substrate concentration of 22.04%, and 3.64% E/S. The extraction rate and reducibility of hydrolysates have no significant correlations under the same hydrolysis condition, indicating that proteolysis is dynamic progress and bioactive polypeptides could be further hydrolysed to in-activated forms.
4.3. Integrated optimization of enzymatic hydrolysis conditions
During the enzymatic hydrolysis process, bioactivities of hydrolysates were influenced by temperature, pH, substrate concentrations, E/S and the time of hydrolysis, also exhibited a sophisticated trends, with slight variations in these conditions. Meanwhile, the yield of hydrolysates was always increasing with the progression of hydrolysis (Oliveira et al. Citation2015; Jeske et al. Citation2018). Therefore, it is necessary to optimize conditions by integrating the extraction rate and bioactivities in the practical preparation of hydrolysates. This study used the Vit.C equivalent of hydrolysates extracted from one gram placental homogenate as an Integrated extraction rate (I, μg·g−1) to acquire the optimal hydrolysis conditions based on Box–Behnken central response method. The optimal hydrolysis conditions of trypsin and papain were: (1) hydrolysis time 5.8 and 4.7 h, (2) substrate concentrations 34.98% and 34.03%, (3) E/S 3.33% and 3.66% and I value of 2037.92 μg·g−1 and 4414.09 μg g−1 respectively. Hydrolysates under the above conditions still have a similar extraction rate and reducibility optimized by one of those two indices. These results verified the reliability of the ‘I’ in bioactive hydrolysates preparation and indicated that the enzymatic hydrolysis of animal tissues was not only a multi-substrate reaction but also a multi-phase reaction (Liu et al. Citation2002). Proteins need to be soluble and become available for enzymatic hydrolysis. These soluble proteins and polypeptides are cleaved by the proteases simultaneously and competitively, producing different hydrolysates. Vit.C equivalent of hydrolysates reach the maximum value at certain conditions and declined when any of these conditions altered, but the extraction rate always showed a positive relation to these conditions under optimum temperature and pH. However, in the optimization of trypsin hydrolysis, I value did not declined remarkably. This is because specific cleavage sites in the protein were hydrolysed entirely in the reaction resulting in the production of reducing polypeptides that cannot be further hydrolysed. This study also showed that a higher substrate concentration would inhibit the hydrolysates competition effect against proteins for enzymes, which in turn will produce more reducing peptides at the same time, raising the I value. Higher E/S may accelerate the enzymatic hydrolysis and cleave reducing peptides into smaller inactive forms when the placental proteins were hydrolysed completely. Under fixed substrate concentration, the I value showed different trends of change with hydrolysis time in different E/S. I value continually raised in lower E/S but showed a parabola-like change in higher E/S.
In summary, E/S determines the hydrolysis speed and progress of the hydrolysis system. Hence, it influences the extraction rate and reducibility indirectly affecting the Integrated extraction rate I.
5. Conclusions
In this study, the optimum hydrolysis conditions for preparing placental hydrolysates having reducing capacity by trypsin and papain were confirmed as hydrolysis time of 5.8 and 4.7 h; substrate concentrations of 34.98% and 34.03%; and E/S 3.33% and 3.66%, respectively. Hydrolysates prepared under these conditions showed both a higher extraction rates and reducibility, which confirmed that, for the preparation of bioactive hydrolysates, the Integrated extraction rate (I) could be an efficient evaluation index. The dual-optimizing method could promote productibility and bioactivities of placental hydrolysates simultaneously and this method is proved effective to exploit the beneficial components of placenta of dairy cows.
Acknowledgements
The authors are thankful to financial support of Science and Technology Department of Sichuan Province and Sichuan Agricultural University.
Disclosure statement
No potential conflict of interest was reported by the author(s).
Additional information
Funding
References
- Adlernissen J. 1986. Enzymic hydrolysis of food proteins. Process Biochem. 172(8):1783–1785.
- Alpay P, Uygun DA. 2015. Usage of immobilized papain for enzymatic hydrolysis of proteins. J Mol Catal B Enzym. 111:56–63. doi: 10.1016/j.molcatb.2014.11.001
- Asbóth B, Polgár L. 1977. Hydrolysis of alkyl ester and amide substrates by papain. Acta Biochim Biophys Acad Sci Hung. 12(4):329.
- Ballatore MB, Bettiol MDR, Vanden Braber NL, Aminahuel CA, Rossi YE, Petroselli G, Erra-Balsells R, Cavaglieri LR, Montenegro MA. 2020. Antioxidant and cytoprotective effect of peptides produced by hydrolysis of whey protein concentrate with trypsin. Food Chem. 319:126472. doi: 10.1016/j.foodchem.2020.126472
- Cao W, Zhang C, Ji H, Hao J. 2011. Optimization of peptic hydrolysis parameters for the production of angiotensin I-converting enzyme inhibitory hydrolysate from Acetes chinensis through Plackett-Burman and response surface methodological approaches. J Sci Food Agric. 92(1):42–48. doi: 10.1002/jsfa.4538
- Chand S. 2009. Bioactive peptides isolated from alcalase hydrolysed horse gram (Macrotyloma uniflorum) protein exhibiting antioxidant activity. New Biotechnol. 25(6):S167–S168. doi: 10.1016/j.nbt.2009.06.532
- Chen J, Yue C, Xia W, Xiong YL, Ran Y, Wang H. 2016. Grass carp peptides hydrolysed by the combination of alcalase and neutrase: angiotensin-I converting enzyme (ACE) inhibitory activity, antioxidant activities and physicochemical profiles. Int J Food Sci Technol. 51(2):499–508. doi: 10.1111/ijfs.13002
- Chou C, Friedman A. 2016. Enzyme dynamics. In: C. S. Chou, A Friedman, editor. Introduction to mathematical biology: modeling, analysis, and simulations. Cham: Springer International Publishing; p. 105–115.
- Damrongsakkul S, Ratanathammapan K, Komolpis K, Tanthapanichakoon W. 2008. Enzymatic hydrolysis of rawhide using papain and neutrase. J Ind Eng Chem. 14(2):202–206. doi: 10.1016/j.jiec.2007.09.010
- Durak A, Baraniak B, Jakubczyk A, Swieca M. 2013. Biologically active peptides obtained by enzymatic hydrolysis of Adzuki bean seeds. Food Chem. 141(3):2177–2183. doi: 10.1016/j.foodchem.2013.05.012
- Hui C, Qu WJ, Ding Q. 2009. Enzymatic hydrolysis of rice protein with papain and antioxidation activity of hydrolysate. J Chin Cereals Oils Assoc. 24(7):10–13.
- Hyun Jung L, Hyun-Sun L, Jang Won C, Kyung Soo R, Jin-Man K, Hyung Joo S. 2011. Novel tripeptides with α-glucosidase inhibitory activity isolated from silk cocoon hydrolysate. J Agric Food Chem. 59(21):11522–11525. doi: 10.1021/jf202686m
- Jeske S, Zannini E, Cronin MF, Arendt EK. 2018. Impact of protease and amylase treatment on proteins and the product quality of a quinoa-based milk substitute. Food Funct. 9(5):3500–3508. doi: 10.1039/C8FO00336J
- Jung K, Choi Y, Chun J, Min S, Hong G. 2014. Effects of concentration and reaction time of trypsin, pepsin, and chymotrypsin on the hydrolysis efficiency of porcine placenta. Korean J Food Sci Anim Resour. 34(2):151–157. doi: 10.5851/kosfa.2014.34.2.151
- Li Y, Jin Y, Li J, Li H, Yu Z. 2016. Effects of thermal pretreatment on the biomethane yield and hydrolysis rate of kitchen waste. Appl Energy. 172:47–58. doi: 10.1016/j.apenergy.2016.03.080
- Liu L, Feng YE, Zhimin OU. 2002. Mechanism and kinetic analysis of enzymatic limited hydrolysis of soy protein isolate. J Chem Industry Eng. 53(2):199–202.
- Maria Gabriela V, Dia VP, Elvira Gonzalez DM, Yoon Kil C. 2012. Antioxidant and antiinflammatory properties of germinated and hydrolysed Brazilian soybean flours. Food Chem. 134(4):2217–2225. doi: 10.1016/j.foodchem.2012.04.037
- Oliveira CFD, Corrêa APF, Coletto D, Daroit DJ, Cladera-Olivera F, Brandelli A. 2015. Soy protein hydrolysis with microbial protease to improve antioxidant and functional properties. J Food Sci Technol. 52(5):2668–2678. doi: 10.1007/s13197-014-1317-7
- Ou K, Liu Y, Zhang L. 2010. Effect of neutrase, alcalase, and papain hydrolysis of whey protein concentrates on iron uptake by Caco-2 cells. J Agric Food Chem. 58(8):4894–4900. doi: 10.1021/jf100055y
- Rustad T, Falch E. 2002. Making the most of fish catches. Food Sci Technol. 16(2):36–39.
- Sani IM, Iqbal S, Chan KW, Ismail M. 2012. Effect of acid and base catalyzed hydrolysis on the yield of phenolics and antioxidant activity of extracts from germinated brown rice (GBR). Molecules. 17(6):7584–7594. doi: 10.3390/molecules17067584
- Tavano OL. 2013. Protein hydrolysis using proteases: an important tool for food biotechnology. J Mol Catal B: Enzym. 90:1–11. doi: 10.1016/j.molcatb.2013.01.011
- Teng D, Fang Y, Song X, Gao Y. 2011. Optimization of enzymatic hydrolysis parameters for antioxidant capacity of peptide from goat placenta. Food Bioprod Process.. 89(3):202–208. doi: 10.1016/j.fbp.2010.05.001
- Vien NTL, Nguyen PB, Cuong LD, An TTT, Dong TAD. 2017. Optimization of papain hydrolysis conditions for release of glycosaminoglycans from the chicken keel cartilage. In: International Conference on Chemical Engineering.
- Xue L, Li Y, Li T, Pan H, Wang L. 2019. Phosphorylation and enzymatic hydrolysis with alcalase and papain effectively reduce allergic reactions to gliadins in Normal mice. J Agric Food Chem. 67(22):6313–6323. doi: 10.1021/acs.jafc.9b00569
- Zhang S, Zhang M, Yang R, Zhang S, Lin S. 2019. Preparation, identification, and activity evaluation of antioxidant peptides from protein hydrolysate of corn germ meal. J Food Process Preserv. 5:e14160–e14171.