
ABSTRACT
This study aimed to generate prediction models to estimate the chemical composition of fresh and dry Brachiaria brizantha cv. Piatã grass using near infrared spectroscopy (NIRS). Chemical analyses of 249 samples were performed to determine oven-dried sample (ODS), dry matter (DM), crude protein (CP), neutral detergent fibre (NDF), acid detergent fibre (ADF), acid detergent lignin (ADL), cellulose (CEL) and total digestible nutrients (TDN). The samples were scanned in an NIRS spectrometer and different percentages were used to compose and develop the models (100% fresh; 100% dry; 25% fresh:75% dry; 50% fresh:50% dry and 75% fresh:25% dry). The purpose of these mixed models is to know if it is possible to obtain reliable predictions from fresh samples in a database that contains dry samples. The calibration models were developed using modified partial least squares (MPLS) and evaluated by statistical parameters, including coefficient of determination (R²) and residual predictive deviation (RPD). The model with 100% dry samples obtained the best results in R² and RPD validations, for CP (0.94; 3.98), NDF (0.92; 3,49) and TDN (0.90; 3.12). The 100% fresh samples produced the best R² results in ODS (0.83), CP (0.85), ADF (0.84) and ADL (0.83). A screening model was validated to predict the characteristics and components of the fresh samples. The model using 100% dry grass was suitable for predicting all the variables, except ODS, DM and CEL.
Highlights
Prediction models can be used for assessment of fresh forage, allowing producers to make quicker decisions, thereby saving time and money.
Introduction
Forage is the main food source used in ruminant production and its quality is related to the productive efficiency of pasture-raised animals. Most grasses in tropical regions are of the genus Brachiaria, a variety with high resistance to temperature change and good adaptability (Ribeiro et al. Citation2014). Among the different species of the genus, the cultivar Piatã is considered one of the most productive and is well accepted by the animals (Dias et al. Citation2015), with a production of 9.5 t/ha of dry matter per year – 36% of this total is accumulated during the dry season, favouring animal performance during this period (EMBRAPA Citation2014). It is important to note that seasonality affects tropical grass production, causing changes in nutritional value throughout the year. Thus, chemical analysis of this food source is an indispensable tool in assessing nutritional quality.
Traditional bromatological analyses to determine grass quality require time and costly chemical analysis techniques, limiting the number of samples that can be processed in a short period. Thus, as an alternative to conventional techniques, fast, low-cost methodologies are essential (Morón et al. Citation2007; Monrroy et al. Citation2017) to facilitate producers’ rapid access to this information.
Near infrared spectroscopy (NIRS) is an alternative resource to analyze grass quality. In recent years, it has proved to be a reliable technique for analyzing several samples and different compounds and is a rapid solution that does not produce polluting waste.
The method is based on the concept of radiation absorption by the sample in the near infrared region (700–2500 nm). When infrared light strikes the sample, it causes vibrations between atoms and groups of atoms in the organic compounds that make up foods (primarily those with C–H, N-H and O-H bonds), increasing the amplitude around covalent bonds. Thus, the light can be absorbed, transmitted or reflected according to the vibrational behaviour of molecules and changes in energy, producing spectra that are interpreted by chemometric techniques (Deepa et al. Citation2016).
One of the possible applications of NIRS is the analysis of fresh plant materials (fruits, leaves, whole plants, seeds), dispensing with the need to prepare samples (such as grinding and drying) (Cozzolino Citation2014) and further lowering time spent on analyses. Grasses generally absorb energy in the absorption range of the domains associated with water, protein, lipids, lignin, starch, sugar, nitrogen and cellulose. However, because water has a broad absorption range in the near infrared, its presence may make it difficult to identify other compounds (Lugassi et al. Citation2015; Parrini et al. Citation2019), particularly in fresh grass.
Nevertheless, NIRS has been successfully used in different products with high moisture content, confirming its efficacy in determining different compounds in samples with distinct physicochemical properties. However, more studies are needed to assess the influence of using fresh and dry grass samples on the effectiveness of equipment calibration, so that the method can be routinely applied (Morón et al. Citation2007), including in portable devices.
Analysis of fresh animal feed has the potential to provide a measurement of grass quality, mainly because it undergoes changes over time (Parrini et al. Citation2019), such as across seasons, and an immediate assessment allows producers to make quicker decisions.
The aim of the present study was to develop and validate predictive models to estimate the chemical composition of Brachiaria brizantha cv. Piatã, using NIRS technology with fresh and dry grass samples, in order to help formulate diets and adjust the stocking rates of pasture-raised ruminants.
Material and methods
Samples and chemical analysis for reference data
A total of 84 samples of Brachiaria brizantha cv. Piatã grass were collected in summer at georeferenced points in a 20 ha area on a cattle breeding farm under continuous grazing, in summer at georeferenced points in a 20 ha area on a cattle breeding farm under continuous grazing, in Santa Fé, Paraná state (23° 02’ 15’’ S, 51° 48’ 19’’ W), Brazil..
The grass was cut at a residual height of 5 cm from the ground, using a backpack grass cutter in an area measuring 0.25 m². The samples collected were packed in previously labelled plastic bags, immediately weighed and frozen in a freezer at – 20°C for subsequent analyses. Later, the 84 samples were morphologically separated into the whole plant (WP), consisting of leaf blade and stem + sheath, leaf blade (LB) and stem + sheath (S + SH).
In order to carry out reference chemical analyses, the samples were pre-dried in an oven at 55°C (±5°C) for 72 h, and ground in a Wiley mill with a 1 mm mesh. After this procedure, the samples were analyzed in duplicate for dry matter (DM), crude protein (CP), neutral (NDF) and acid detergent fibre (ADF), acid detergent lignin (ADL), cellulose (CEL) and total digestible nutrients (TDN).
Analyses were carried out using the following methods: DM (#934.01; AOAC Citation2003), CP (#2001.11; AOAC Citation2005), NDF/ADF/ADL (Detmann et al. Citation2012), CEL (Van Soest et al. Citation1991) TDN (Cappelle et al. Citation2001; TND = 83.79 – (0.4171*NDF)).
Sampling groups for calibration and validation
In order to calibrate and validate the models, the total sample was randomly divided into subsets (Parrini et al. Citation2018): around two-thirds of the samples were used to develop the models and one-third in the validation test to analyze the behaviour of predictive models.
With a view to assessing the effect of different amounts of fresh and dry sample in the predictive model using the database created, different percentages were applied to develop calibration and validation models. The datasets were tested with the following compositions: 100% fresh samples (calibration: 50 fresh samples, validation: 25 fresh samples); 100% dry samples (calibration: 165 dry samples, validation: 84 dry samples); 25% fresh/75% dry samples (calibration: 50 fresh/150 dry samples, validation: 25 fresh/75 dry samples); 50% fresh/50% dry samples (calibration: 50 fresh/50 dry samples, validation: 25 fresh/ 25 dry samples); 75% fresh/25% dry samples (calibration: 50 fresh/15 dry samples, validation: 25 fresh/10 dry samples). In the development of the model with 100% fresh samples, some spectra were discarded for not exhibiting acceptable spectral characteristics, leaving only 75 samples.
NIRS spectra, calibration development and data analysis
In order to obtain spectra of fresh and dry samples, a Foss NIRSystems XDS VIS-NIR spectrometer (Silver Spring, MD, USA), with a reflectance band between 400 and 2500 nm and resolution adjusted to 2 nm, was used. The reflectance data ® were transformed into absorbance (A), using the expression A = log (1/R) and analyzed by WinISI III software. The spectral range used in this study was between 1100 and 2500 nm.
Spectrometer readings of the samples occurred at two different times, the first with fresh samples cut into 10 cm pieces, and the second dry samples with 1 mm particle size.
The spectra were obtained for the whole plant samples (84), leaf blades (83) and stems + sheaths (82) of fresh and dry grass. Each sample was scanned in duplicate to increase the digitized surface and reduce errors that could affect the predictive model (Yang et al. Citation2017). The average spectrum was used to create predictive models, forming 249 fresh and 249 dry grass spectra. The graph of average spectra was constructed using the spectral values from the reading of each sample analyzed, considering the average values of each structure (WP, LB and S + SH).
Principal component analysis (PCA) was applied to spectral data to decrease its amplitude and elucidate sampling variability in both dataset, fresh and dry samples separately. The Kennard and Stone (Citation1969) algorithm was used to separate the samples into two groups (calibration and validation), in order to guarantee homogeneous data distribution. Modified partial least squares (MPLS) regression was used to correlate the reference values obtained in the laboratory with the spectral data of the calibration set using conventional chemical methods (Shenk and Westerhaus Citation1991).
With a view to normalizing and eliminating the non-linear trends of the spectra by correcting light dispersion, noise and particle size interference, raw spectra were submitted to mathematical pre-treatments. Standard normal variate (SNV) or standard normal variate with detrend (SNVD) and only detrend (D) were used for 1441, where the first digit represents the order of the derivative; the second digit, followed by the gap, represents the length of the segment in which the derivative is applied in number. of points; and the third and fourth digits represent the first and second smoothing, respectively. The pre-treatments were tested to select the best for each variable applied.
Up to 10% of the outliers were removed by the operator when developing the models for each individual variable in the calibration and validation stages. These outliers were removed visually and manually, considering the samples that changed or deviated from the trend line in relation to the reference or predicted values.
The following statistical parameters were used to assess the efficiency of the calibration and validation models: standard error of calibration (SEC) and prediction (SEP), coefficient of determination of calibration (R²c) and validation (R²v), and residual predictive deviation of calibration (RPDc) and validation (RPDv). R² is a parameter that indicates the correlation between the reference and predicted values, used to assess the accuracy of a model (Tran et al. Citation2010). RPD allows a comparison between model performance in different datasets and is calculated by the ratio between standard deviation and the SEC or SEP values (Williams and Sobering Citation1993). For standard errors, those with SEP values up to 1.3 times higher than those of SEC were considered (Windham et al. Citation1989).
Results and discussion
The average and standard deviation values of the chemical composition of Brachiaria brizantha cv. Piatã, obtained by conventional chemical analyses of WP, LB and S + SH samples, are presented in . For all the variables assessed there was a considerable variation between the values obtained, directly associated with the differences between the morphological structures of the grass, which are related to their functions. Provided it is homogeneous, broadly distributed data obtained in chemical analyses is indicated for calibration sample selection using NIRS, enabling a better representation of predicted data (Alomar et al. Citation2009), and in predicting the quality of different types of forage (Lobos et al. Citation2013).
Table 1. Descriptive analysis of the chemical composition (% of dry matter) of Brachiaria brizantha cv. Piatã, obtained by conventional chemical analysis (reference methods).
In PCA analysis ( and ) to assess the variance in the sample dataset and the existence of cluster. The PCA was performed to verify the variance of the dataset and the possibility of forming groups, both for dry and fresh data, separately. The spectral PCA of the fresh data () demonstrated the heterogeneity present in the sample group, between the different morphological components of the samples in natura – possibly due to the presence of water. It was possible to observe the formation of groups mainly of leaf blade and stem + sheath, as also occurred in the graph of average spectra (), in which a great difference in absorption of infrared light was observed between these plant components. The first principal component (PC1) explained 96% of variability for the fresh samples and the second component (PC2) only 3%.
Figure 1. Principal components analysis (PCA) of fresh samples grouped according to morphological components whole plant, leaf blade and stem + sheath of Brachiaria brizantha cv. Piatã.PC: principal component.
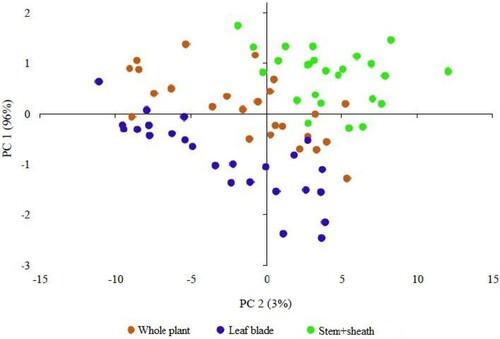
Figure 2. Principal components analysis (PCA) of dried samples grouped according to morphological components whole plant, leaf blade and stem + sheath of Brachiaria brizantha cv. Piatã. PC: principal component.
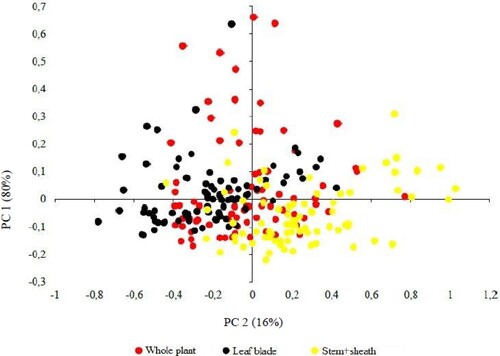
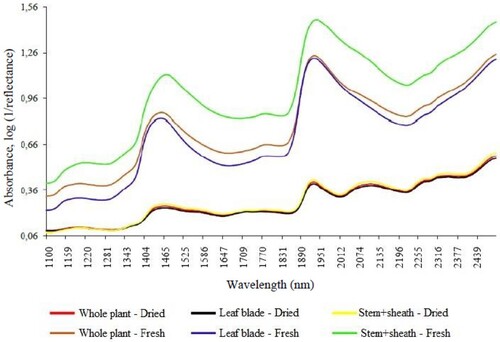
Figure 3. Average raw spectra of fresh and dried samples of whole plant, lelaf blade and stem + sheath of Brachiaria brizantha cv. Piatã.
The spectral PCA of the dry samples () demonstrated the homogeneity of this dataset, without the formation of groups, in agreement with the graph of average spectra of the dry samples with overlapping absorbance values and bands (). This fact elucidates the feasibility of developing a model with dry samples and different morphological structures. The PC1 and PC2 explained 80 and 16% of data variability (), respectively.
The reflectance of fresh grass is heavily influenced by the water absorption bands at approximately 1400, 1450 and 1900nm (Arzani et al. Citation2015; Lugassi et al. Citation2015). These characteristic spectral bands are clearly visible in , demonstrating that reflectance was influenced by the amount of water present in the samples assessed.
Despite the relatively strong water absorption properties, the fresh and dry grass spectra showed similar behaviour, even though absorption by fresh grass was greater (Lugassi et al. Citation2015), as shown in the spectra presented in . Absorbance intensity was also higher in the fresh grass stem + sheath curve. These structures are known to contain phenolic and carboxylic compounds, which may be associated with cellulose and lignin, the predominant content of supporting tissue such as the stem. This influences the spectral signature of each morphological structure, particularly fresh grass S + SH, due to the presence of -CH and -OH bonds that enable the identification of fibrous components by NIRS (Parrini et al. Citation2018).
The effect of the particle size of the sample analyzed can shift the baseline by influencing the diffuse reflection of light: the smaller the particles, the lower the absorbance and the greater the reflection (Kragten and Wyss Citation2014). The opposite occurs in fresh grass samples, which have larger particle sizes, as observed in the fresh grass spectra at approximately 1465 and 1900nm, possibly due to low fibre content (Serafim et al. Citation2021) ().
shows the effect of the pre-treatments on the raw mean spectra of the fresh and dry grass samples. When compared to the raw mean spectra, applying pre-treatments SNV, SNVD and Detrend to the fresh grass spectra resulted in a difference in spectral behaviour. The combination of SNV + Detrend revealed that the slope of the raw mean spectra () and those resulting from the SNV treatment () was gentler for both the fresh and dry grass samples. The SNV pre-treatment reduces light scattering effects related to sample density and particle size, while Detrend removes nonlinear trends and corrects the baseline (Souza et al. Citation2012). These effects were observed in the figures, thus confirming the effectiveness of the pre-treatments. However, it is important to underscore that relevant spectral information may be removed when light scattering correction treatments such as SNV are used, and that in most cases the best models are achieved by combining different treatments (Rambo and Ferreira Citation2018).
Figure 4. Average treated spectra of fresh and dried samples of Brachiaria brizantha cv. Piatã.SNV: standard normal variate; SNVD: standard normal variate + Detrend. ODS: oven-dried sample; DM: dry matter; CP: crude protein; NDF: neutral detergent fibre; ADF: acid detergent fibre; TDN: total digestible nutrients; SEP: standard error of prediction; R2v: coefficient of determination of validation; RPDv: ratio of performance deviation of validation; n, number of samples.
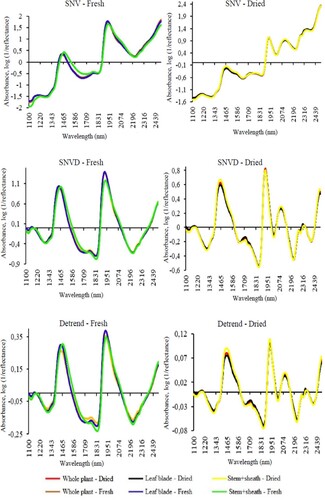
When compared to SNVD, the spectra for the two sample states remain practically unchanged when Detrend was used and analysis of the amplitude of the graph showed smaller peaks, indicating greater spectral smoothing (baseline). The polynomial used in Detrend fits the entire spectrum, as opposed to other treatments that cover only a short window with a limited number of data points (Rambo and Ferreira Citation2018), which may explain the better results obtained with its isolated or combined application.
Analysis of the statistical parameters of the 100% fresh grass model () indicates that mathematical pre-treatment did not optimize the model, with better results obtained without pre-treatment. Generally, pre-treatment significantly optimizes the development of calibration models by promoting linear adjustment through the relationship between absorbance and the concentration of the component to be analyzed (Pereira Citation2017). This did not occur in the present study due to the possible removal of spectral information. Since the aim of pre-treatment is to improve the model, this tool need not be applied if analysis of the statistical parameters indicates no improvement.
Table 2. Prediction models developed from the set of fresh Brachiaria brizantha cv. Piatã samples.
Assessment of the 100% dry sample model () demonstrated that all the variables were pre-treated, mainly via SNV, which may have reduced the problem of particle uniformity in the pre-dried ground samples, thereby producing a better result in relation to the other models. This may also explain why the 25% fresh:75% dry (), 50% fresh:50% dry () and 75% fresh:25% dry sample models () did not provide good prediction results, since the 100% fresh model required no pre-treatment, unlike the 100% dry sample model.
Table 3. Prediction models developed from the set of dry Brachiaria brizantha cv. Piatã samples.
Table 4. Mixed prediction models developed from the set of 25% fresh:75% dry Brachiaria brizantha cv. Piatã samples.
Table 5. Mixed prediction models developed from the set of 50% fresh:50% dry Brachiaria brizantha cv. Piatã samples.
Table 6. Mixed prediction models developed from the set of 75% fresh:25% dry Brachiaria brizantha cv. Piatã samples.
Good predictive models are those with RPD values between 2.5 and 3.0 or higher than 3.0 (Goldshleger et al. Citation2013) and R² greater than 0.80 (Tran et al. Citation2010), associated with low standard errors. SEP values should be low and a maximum of 1.3 times higher than SEC values (Windham et al. Citation1989).
The 25% fresh:75% dry (), 50% fresh:50% dry () and 75% fresh:25% dry sample models () did not exhibit good calibration results, which precluded the validation of good predictive models. In generally, the accuracy of the models declined as the amount of fresh sample included in their construction increased.
Fernandes (Citation2015) and Melo (Citation2017) developed models using pre-dried/ground and fresh mesquite pods/prickly pear and cotton husk/pigeon pea, respectively, and found that some of the fresh sample models were highly complex, with their poor performance possibly related to the high moisture content and particle size of the samples. The authors found that the models using pre-dried and ground samples performed best, corroborating the results obtained in the present study. Thus, it can be inferred that the more aspects used to construct the model, the more complex and unstable it tends to be, evident in the models in which combinations of fresh and dry samples were used.
Use of the database composed of 100% fresh samples () resulted in considerable R² and RPD values in the calibration stage for the highest number of variables among all the models, such as: CP, NDF, ADF, ADL and TDN. Despite the good results in the calibration stage, satisfactory results were not obtained for validation. The best R² and RPD values were obtained for the 100% fresh sample model, which exhibited precision, but low predictive accuracy. Given that validation is used to assess the predictive capacity of the model, accuracy in this stage is vital.
Thus, when only 100% dry samples were used () to construct the model, there was good correlation between predicted and reference values, except for DM content, which exhibit an R²c value of 0.68. Considering RPDc, values for the variables DM, ADF and CEL were not higher than 2.5 in the model development phase; however, all the variables achieved R²v > 0.70 in validation and only DM and CEL obtained RPDv values lower than 2.5.
The 100% dry sample model () performed better than the other models developed and, in addition to the absence of water, its results may be related to the particle size of the samples. The smaller particle size of dry samples in relation to their fresh counterparts may have resulted in spectra that were not negatively affected by the water. Reduced moisture content and the standardization of particle sizes are factors that directly influence calibration results (Burns and Ciurczak Citation2007). The models developed for ODS CP, NDF, ADF, ADL and TDN can be used as accurate reliable substitutes for conventional chemical analysis of dry B. brizantha cv. Piatã grass.
Although the 100% fresh sample model () did not obtain adequate values for the parameters used to select the best predictive model, the average predicted (validation) and reference values were very similar (). As such, there are indications that this model could be used to meet the immediate needs of farmers to assess the quality of their pastures via portable NIR spectrometers, with a view to screening the food available to livestock.
Table 7. Average reference values obtained by conventional chemical analysis and average values predicted by near infrared spectroscopy in 100% fresh Brachiaria brizantha cv. Piatã samples.
The predictive models developed using different percentages of fresh and dry Brachiaria brizantha cv. Piatã samples are graphically depicted in and , illustrated by the ratio on the trend line between the variables obtained via NIRS prediction and the conventional method for each variable analyzed. Analysis of the scatter plots makes it possible to determine whether the samples are well distributed in relation to the trend line, establishing a specific confidence interval (Fekadu et al. Citation2010), and if they represent nutrient dynamics in plants.
Figure 5. Validation of prediction models developmented for chemical composition of fresh forage samples of Brachiaria brizantha cv. Piatã.ODS: oven-dried sample; DM: dry matter; CP: crude protein; NDF: neutral detergent fibre; ADF: acid detergent fibre; TDN: total digestible nutrients; SEP: standard error of prediction; R2v: coefficient of determination of validation; RPDv: ratio of performance deviation of validation; n, number of samples.
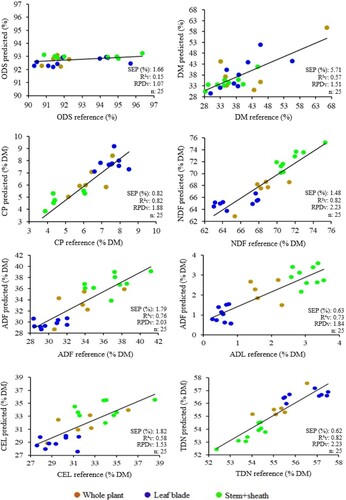
Figure 6. Validation of prediction models developmented for chemical composition of dried forage samples of Brachiaria brizantha cv. Piatã.
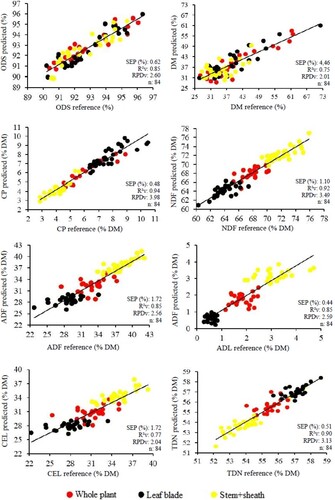
Scatter plots for the fresh samples () show several gaps and a greater distance between dots when compared to plots for the dry samples (), especially for ODS and DM. This may be due to the differences in moisture content in the fresh samples, since spectra are influenced by water, in relation to dry samples, which were used for chemical analyses. Another possible influencing factor may have been the amount of sample used to construct each model, whereby these gaps could be filled by increasing the fresh sample database to develop a more robust model.
However, despite the existence of gaps, R²v values can be considered satisfactory and the models practically applicable for farmers with an immediate need to evaluate forage, with the possibility of conducting field assessments using portable spectrometers.
The results obtained here demonstrate the importance of validation in developing predictive models and the need to increase the fresh sample database in order to develop a more robust model that can produce better results.
Conclusion
The predictive models developed with dry samples of Brachiaria brizantha cv. Piatã can be used to determine the contents of oven-dried samples, crude protein, acid and neutral detergent fibre, lignin, and total digestible nutrients. However, those models developed with the dataset of fresh samples, regardless of the percentage of inclusion, cannot be indicated for routine use in the laboratory analysis of the quality of Piatã grass.
Acknowledgements
To the Brazilian National Council for Scientific and Technological Development (CNPq) for funding this research and for the grant awarded to I.Y.M.; and to the Coordination for the Improvement of Higher Education Personnel (CAPES) for the grant awarded to M.C.A.R
Disclosure statement
No potential conflict of interest was reported by the author(s).
References
- Alomar D, Fuchslocher R, Cuevas J, Mardones R, Cuevas E. 2009. Prediction of the composition of fresh pastures by near infrared reflectance or interactance-reflectance spectroscopy. Chil J Agric Res. 69(2):198–206.
- AOAC. 2003. Official methods of analysis. 17th ed., 2nd revision. Gaithersburg (MD): Association of Official Analytical Chemists.
- AOAC. 2005. Official methods of analysis. 18th ed. Gaithersburg (MD): Association of Official Analytical Chemists.
- Arzani H, Sanaei A, Barker AV, Ghafari S, Motamedi J. 2015. Estimating nitrogen and acid detergent fiber contents of grass species using Near Infrared Reflectance Spectroscopy (NIRS). J Rangel Sci. 5(4):260–268.
- Burns DA, Ciurczak EW. 2007. Handbook of near- infrared analysis. Boca Raton (FL): CRC Press.
- Cappelle ER, Valadares Filho SC, Silva JFC, Cecon PR. 2001. Estimativa do valor energético a partir de características químicas e bromatológicas dos alimentos [Estimates of the energy value from chemical characteristics of the feedstuffs]. Rev Bras de Zootec. 30(6):1837–1856. Portuguese.
- Cozzolino D. 2014. Use of infrared spectroscopy for in-field measurement and phenotyping of plant properties: instrumentation, data analysis, and examples. Appl Spectrosc Rev. 49(7):564–584.
- Deepa K, Senthilkumar S, Kalpana K, Suganya T, Sasikumar P, Thirumalaisamy G, Sureshkumar R, Vasanthakumar P. 2016. NIRS in animal sciences. Int J Sci Environ Technol. 5(2):605–610.
- Detmann E, Souza MA, Valadares Filho SC, Queiroz AC, Berchielli TT, Saliba EOS, Cabral LS, Pina DS, Ladeira MM, Azevedo JAG. 2012. Métodos para Análise de Alimentos [Methods for food analysis]. Visconde do Rio Branco (MG): UFV. Portuguese.
- Dias DG, Pegaroro RF, Alves DD, Porto EMV, Santos Neto JA, Aspiazú I. 2015. Produção do capim Piatã submetido a diferentes fontes de fósforo [Production of Piata grass under diferente phosphorus sources]. Rev Bras Eng Agric Ambient. 19(4):330–335. Portuguese.
- Fekadu D, Bediye S, Kehaliw A, Daba T, Kitaw G, Assefa G. 2010. Near infrared spectroscopy (NIRS) for determination of chemical entities of natural pasture from Ethiopia. Agric Biol J N Am. 1(5):919–922.
- EMBRAPA – Empresa Brasileira de Pesquisa Agropecuária. BRS Piatã. [Accessed 21 September 2022]. Available from: <http://amaranto.cpac.embrapa.br/agrobsb/Arquivos/forrageiras/BRSPiata.pdf>.
- Fernandes AMF. 2015. Uso da espectroscopia de reflectância do infravermelho próximo (NIRS) para previsão da composição bromatológica de vagens de algaroba e palma forrageira [dissertation]. Sobral (CE): Universidade Estadual Vale do Acaraú.
- Goldshleger N, Chudnovsky A, Ben-binyam R. 2013. Predicting salinity in tomato using soil reflectance spectra. Int J Remote Sens. 34(17):6079–6093.
- Kennard RW, Stone LA. 1969. Computer aided design of experiments. Technometrics. 11(1):137–148.
- Kragten SA, Wyss U. 2014. Les fourrages à la lumière du proche infrarouge (NIRS) [Forages in the light of NIRS]. Rech Agron em Suisse. 5(5):204–2011. French.
- Lobos I, Gou P, Hube R, Saldaña R, Alfaro M. 2013. Evaluation of potencial NIRS to predict pastures nutritive value. J Soil Sci Plant Nutr. 13(2):463–468.
- Lugassi R, Chudnovsky A, Zaady E, Dvash L, Goldshleger N. 2015. Estimating pasture quality of fresh vegetation based on spectral slope of mixed data of dry and fresh vegetation – method development. Remote Sens. 7(6):8045–8066.
- Melo JCR. 2017. Uso da espectroscopia de reflectância do infravermelho próximo (NIRS) para previsão da composição bromatológica da torta de algodão e feijão guandu [Use of near infrared reflectance spectroscopy (NIRS) to predict the bromatological composition of cotton cake and Guandu beans] [dissertation]. Sobral (CE): Universidade Estadual Vale do Acaraú.
- Monrroy M, Gutiérrez D, Miranda M, Hernández K, García JR. 2017. Determination of Brachiaria spp. forage quality by near-infrared spectroscopy and partial least squares regression. J Chil Chem Soc. 62(2):3472–3477.
- Morón A, García A, Sawchik J, Cozzolino D. 2007. Preliminary study on the use of near-infrared reflectance spectroscopy to assess nitrogen content of undried wheat plants. J Sci Food Agric. 87(1):147–152.
- Parrini S, Acciaioli A, Franci O, Pugliese C, Bozzi R. 2019. Near infrared spectroscopy technology for prediction of chemical composition of natural fresh pastures. J Appl Anim Res. 47(1):514–520.
- Parrini S, Acciaioli A, Crovetti A, Bozzi R. 2018. Use of FT-NIRS for determination of chemical components and nutritional value of natural pasture. Ital J Anim Sci. 17(1):87–91.
- Pereira LFS. 2017. Espectroscopia no NIR e processamento de imagens digitais para classificação de mamão papaia (Carica papaya L.) Golden [NIR spectroscopy and digital images processing to Golden papaia (Carica papaya L.) grading] [dissertation]. Campinas (SP): Universidade Estadual de Campinas.
- Rambo MKD, Ferreira MMC. 2018. Análise de resíduos lignocelulósicos por espectroscopia NIR associada a pré-tratamentos multivariados dentro do contexto de química verde [Analysis of lignocellulosic residues by NIR spectroscopy associated to multivariate pre-treatments in the context of green chemistry]. Rev Virtual Quim. 10(2):421–431. Portuguese.
- Ribeiro AF, Messana JD, Dian PHM, Reis RA, Ruggieri AC, Malheiros EB, Berchielli TT. 2014. Chemical composition, in vitro digestibility and gas production of Brachiaria managed under different forage allowances. Ital J Anim Sci. 13(1):36–43.
- Serafim CC, Guerra GL, Mizubuti IY, Castro FAB, Prado-Calixto OP, Galbeiro S, Parra ARP, Bumbieris Junior VH, Pértile SFN, Rego FCA. 2021. Use of near-infrared spectroscopy f chemical composition of Tifton 85 grass. Semin Cienc Agrar. 42(3):1287–1302.
- Shenk JS, Westerhaus MO. 1991. Population definition, sample selection, and calibration procedures for near infrared reflectance spectroscopy. Crop Sci. 31(2):469–474.
- Souza DM, Madari BE, Guimarães FF. 2012. Aplicação de técnicas multivariadas e inteligência artificial na análise de espectros de infravermelho para determinação de matéria orgânica em amostras de solos [Application of multivariate calibration and artificial intelligence in the analysis of infrared spectra to quantify organic matter in soil samples]. Quim Nova. 35(9):1738–1745. Portuguese.
- Tran H, Salgado P, Tillard E, Dardenne P, Nguyen XT, Lecomte P. 2010. “Global” and “local” predictions of dairy diet nutritional quality using near infrared reflectance spectroscopy. J Dairy Sci. 93(10):4961–4975.
- Van Soest PJ, Robertson JB, Lewis BA. 1991. Methods for dietary fiber, neutral detergent fiber, and nonstarch polysaccharides in relation to animal nutrition. J Dairy Sci. 74(10):3583–3597.
- Williams PC, Sobering DC. 1993. Comparison of commercial near infrared transmittance and reflectance instruments for analysis of whole grains and seeds. J Near Infrared Spectrosc. 1(1):25–33.
- Windham WR, Mertens DR, Barton FE. 1989. Protocol for NIRS calibration: sample selection and equation development and validation. In: Marten GC, Shenk JS, Barton FE II, editor. Near infrared reflectance spectroscopy (NIRS): analysis of forage quality. Washington (DC): USDA-Agricultural Research Service; p. 96–103.
- Yang Z, Nie G, Pan L, Zhang Y, Huang L, Ma X, Zhang X. 2017. Development and validation of near-infrared spectroscopy for the prediction of forage quality parameters in Lolium multiforum. PeerJ Comput Sci. 5(10):1–20.