
ABSTRACT
The functions of tumour protein, translationally controlled 1 (TPT1), have been extensively researched in various cell types. Although TPT1 was reported to have accelerating effects on the lipid deposition of mouse hepatocytes, and the activation roles in phosphatidylinositol 3 kinase (PI3K/AKT) pathway, its role in the differentiation of ovine stromal vascular fractions (SVFs) and their underlying mechanisms have not been addressed. Therefore, the objective of this study was to explore whether TPT1 participates in the adipogenic differentiation regulation of ovine SVFs and the underlying mechanisms. The results from this study revealed that TPT1 was abundant in the tail fat of sheep and the protein was located in the nucleus of C3H10T1/2 cell line and ovine SVFs. Moreover, TPT1 expression was up-regulated during the adipogenic differentiation of SVFs. The overexpression of TPT1 dramatically accelerated the adipogenic differentiation of SVFs, accompanied by the up-regulation of adipogenic marker genes, while TPT1 inhibition had opposite effects. TPT1 also had a negative effect on forkhead box O1 (FOXO1). The PI3K/AKT pathway was involved in the promotion of adipogenesis induced by overexpressing TPT1. We concluded that TPT1 promotes the adipogenic differentiation of ovine SVFs through PI3K/AKT-dependent pathway and attenuates the expression of FOXO1 in ovine SVFs.
Introduction
The deposition of the tail fat of sheep is an important phenotypic trait and plays an essential role in storing energy to resist extreme cold environments for sheep (Bakhtiarizadeh and Salami Citation2019; Fan et al. Citation2019). However, with the elevation of living standards and reduction of demand for high-fat mutton, excessive tail fat deposition increases the feeding cost and decreases the carcass quality. Therefore, exploring the regulation mechanism of tail fat deposition has become the research object of many researchers. The adipose deposition is a complex process that is regulated by several factors (Sebo and Rodeheffer Citation2019). TPT1 was first identified in mouse sarcoma cells (Yenofsky et al. Citation1982) and subsequently in several cancer cells and normal cells (Li et al. Citation2001; Ma and Zhu Citation2012; Jin et al. Citation2015). Notably, TPT1 is a highly conserved protein and contributes to several biological processes, such as cell proliferation (Jin et al. Citation2015), survival (Chen et al. Citation2013), autophagy (Bae et al. Citation2017) and epithelial–mesenchymal transition (Mishra et al. Citation2018). In addition, TPT1 was reported to be involved in glucose and lipid metabolism. For example, TPT1 was transferred partly from the cytoplasm to the nucleus and mitochondrion under the regulation of glucose in pancreatic beta cells (Diraison et al. Citation2011). Furthermore, recent research investigating the role of TPT1 in mouse hepatocytes has shown that decreased TPT1 expression impaired adipogenic differentiation and the formation of lipid droplets (Lin et al. Citation2020). TPT1 should be a potential target for glucose and lipid metabolism. Besides, TPT1 is required for cell growth and proliferation; for example, Drosophila TCTP regulated the GTPase activity of Rheb to control cell growth and proliferation (Hsu et al. Citation2007). However, due to the different characters among species, it is essential to comprehensively understand the roles of TPT1 in sheep.
Accumulating evidence revealed that TPT1 could upregulate the PI3K/AKT pathway, which is a master regulator for adipose tissue development (Kim et al. Citation2009; Lin et al. Citation2020). PI3K/AKT plays an essential role in the phosphorylation of numerous proteins such as the mechanistic target of rapamycin complex 1 (mTORC1) (Peterson et al. Citation2011), thus affecting the protein activity and numerous biological activities. Moreover, PI3K/AKT regulates the transcription of adipogenic marker genes, like sterol regulatory element binding protein (SREBP) (Porstmann et al. Citation2005). However, the molecular mechanism underlying the TPT1 and PI3K/AKT interacting effects and their roles in adipogenic differentiation have not been fully understood. Additionally, there were some research studies on the regulatory relationship between TPT1 and FOXO1. The inhibition of TPT1 led to increased FOXO1 expression and reduced insulin secretion in β-cell (Tsai et al. Citation2014). FOXO1 protein is a key transcript factor, involved in the regulation of lipid metabolism and adipocyte differentiation. Research has shown that FOXO1 regulated lipid droplet size and number via autophagy (Liu et al. Citation2016). Moreover, RNA sequencing for the HepG2 cell with TPT1 knock-down reveals that the FOXO1 signalling pathway is one of the enriched signalling pathways, suggesting that the expression of FOXO1 may be changed under the pressure of highly expressed TPT1 (Dong et al. Citation2021). However, the relationship between TPT1 and FOXO1 during the adipogenic differentiation of ovine SVFs is yet to be validated.
The aim of this study was to elucidate the function of TPT1 in the adipogenic differentiation of ovine SVFs and whether the PI3K/AKT pathway and FOXO1 participate in the regulation of ovine SVF differentiation. TPT1 was found to be expressed throughout the SVF adipogenic differentiation process and to play a positive regulatory role in this process. We further demonstrated that the inhibition of the PI3K/AKT pathway in the TPT1-overexpressed adipocytes could induce the suppression of key adipogenic regulators. TPT1 decreased the expression of FOXO1 which is required for adipogenic differentiation. Overall, these findings contribute to a better understanding of the functional role and mechanism of TPT1 in the adipogenesis of sheep.
Materials and methods
Ethics statement
All experiments performed followed the National Research Council Guide for the Care and Use of Laboratory Animals. All animal procedures were approved by the Animal Care and Ethical Committee of Shanxi Agricultural University, China.
Tissue cell lines
Four sheep were used as experimental samples in this experiment. All the tissue samples were collected from 1-month-old sheep (n = 3). The C3H10T1/2 cells and 293 T cells were originally stored in the laboratory. SVFs were isolated from the tail adipose tissue of a 7-day-old lamb under aseptic conditions. The tail adipose tissues were collected and minced using ophthalmic scissors, subsequently digested by 2 mg/mL collagenase type II (C8150, Solarbio, China) for 60 min at 37℃. The mixture was centrifuged at 1000 g for 10 min, after which the precipitate was resuspended in a growth culture medium with 89% low-glucose Dulbecco’s modified Eagle’s medium (DMEM, 11965118, Gibco, USA), 10% fetal bovine serum (FBS, 10099141, Gibco, USA) and 1% penicillin–streptomycin (15140163, Gibco, USA). SVFs were obtained after being filtered with 75 and 37.5 μm nylon meshes. The cell suspension obtained was cultured in a growth culture medium. C3H10T1/2 cells and 293 T cells also were cultured in a growth culture medium. They were all cultured at 37°C with 5% CO2 and the medium was refreshed every 2 days.
Adipogenic differentiation and Oil Red O staining
When the cell density reached 90%, the growth culture medium was replaced with the inductive differentiation medium, which contained DMEM basic, 3 mg/mL bovine insulin (I8040, Solarbio, China), 1.4 mg/mL 3-isobutyl-1-methylxanthine (I8450, Solarbio, China), 1 mg/mL dexamethasone (D8040, Solarbio, China), 10 mM rosiglitazone (Cayman Chemical, Ann Arbor, MI, USA), 1% penicillin–streptomycin solution and 10% FBS. The inductive differentiation medium was refreshed every 2 days. Mature adipocytes were stained with Oil Red O (ORO) (O8010, Solarbio, China). The cells were washed with PBS (P1010, Solarbio, China) three times and fixed for 30 min in 4% paraformaldehyde at room temperature. After incubation with 60% isopropanol for 5 min, cells were stained with the ORO working solution for 1 h and washed with water three times. Then images were captured using a microscope (Leica, Wetzlar, Germany).
Lentivirus production
The coding sequence of TPT1 was inserted into the lentivirus vector pHBLV-CMIVE-ZsGreen-T2A-puro (Hanbio, China). The short hairpin oligonucleotides (shRNAs) specifically targeted the coding sequence of TPT1 were designed and synthesized. shRNAs were inserted into lentivirus vector pHBLV-U6-ZsGreen-T2A-puro plasmid (Hanbio, China). All the oligonucleotides were inserted between BamH I and EcoR I restriction sites. The amplification primers and shRNA sequences targeting the coding sequence of TPT1 are listed in . When the lentivirus packaging experiment was performed, the recombinant plasmids and packaging plasmids PMD2G and PSPAX2 (both purchased from Hanbio) were co-transfected into 293 T cells. The packed lentiviruses were collected 48 and 72 h after transfection. The virus supernate was used to infect SVFs when the SVFs’ density reached 50%. When SVFs’ density reached 90%, the growth culture medium was replaced with an inductive differentiation culture medium. The cells were collected for qRT-PCR, Western blotting and ORO staining 12 days after adipogenic induction.
Table 1. Amplification primers and shRNA sequences for TPT1.
Interference of the PI3K/AKT pathway using LY294002
In this section, TPT1-overexpressing SVFs were divided into two groups: the negative group and the TPT1 + LY294002 group. When the cell density reached about 60%, the TPT1 + LY294002 group was intervened with 1 μmol/L LY294002 (HY-10108, MCE, China) for 12 h. After cell density reached 90%, the inductive differentiation medium was added and refreshed every two days. 12 days after adipogenic induction, cells were collected for qPCR, Western blotting and Oil Red O staining.
Immunofluorescence
C3H10T1/2 cells and ovine SVFs were cultured for locating the TPT1 protein. When the cell density reaches 75%, cells were fixed in PBS containing 4% paraformaldehyde for 30 min at room temperature and washed twice with cold PBS. The washed cells were made transparent with PBS containing 0.25% TritonX-100 for 10 min and washed with PBS three times. After being blocked with 1% BSA for 30 min, cells were incubated with the primary antibody (diluted with PBST containing 1% BSA) at 4℃ overnight and then washed with PBS three times. After that, cells were incubated with the second antibody in 1% BSA for 1 h at room temperature and washed with PBS three times. Then the cells were incubated in 1 μg/ml DAPI (C0065, Solarbio, China) for 1 min and washed with PBS three times. Finally, a microscope was used to observe the location of TPT1 in cells.
Quantitative real-time PCR
RNAiso Plus (9108, Takara) was used to collect the total RNAs. PrimeScript RT reagent Kit with gDNA Eraser (RR047A, Takara) was used for reverse transcription. According to the previous quantitative real-time PCR (qPCR) amplification procedure (Wijayanti et al. Citation2022), qPCR was conducted on the BIO-RAD CFX Connect Real-Time System using TB Green Premix Ex Taq II (RR820A, Takara). The β-actin was used as an internal reference to evaluate the level of genes. All primers used in this study are shown in . The 2-ΔΔCT method was used to calculate the relative expression of mRNAs.
Table 2. qPCR primers used to amplify mRNAs.
Western blotting
The cultured SVFs were lysed by a lysis buffer with protease inhibitors (P6730, Solarbio), phosphatase inhibitors (P1260, Solarbio) and phenylmethylsulphonyl fluoride (PMSF, P8340, Solarbio). The collected protein was separated by 10% SDS polyacrylamide gels and transferred to nitrocellulose filter membranes (HATF00010, Solarbio). The membranes were blocked with 5% skim milk for 1 h at room temperature, then incubated with primary antibodies (anti-TPT1: ab37506, Abcam, UK; anti-β-actin: YM3214, Immunoway; anti-FOXO1: 2880; Cell Signaling Technology, USA; anti-AKT: 4060; Cell Signaling Technology, USA) at 4℃ overnight. The membranes were washed three times with PBS-T and incubated with diluted secondary antibody (926-32210, LI-COR) for 1 h at room temperature. Images were captured and the grey values of protein bands were analysed using the Odyssey CLX imaging system (LI-COR, Lincoln, USA).
Statistical analysis
Each result was verified in three independent experiments. The two groups of samples were compared by an unpaired Student’s t-test, and multiple groups of samples were analysed by one-way ANOVA. For all analyses, P < 0.05 was considered to indicate a significant difference. All data were analysed using the GraphPad Prism software (Version 8, San Diego, CA, USA) and presented as means ± SEM.
Results
Expression patterns and the localization of TPT1
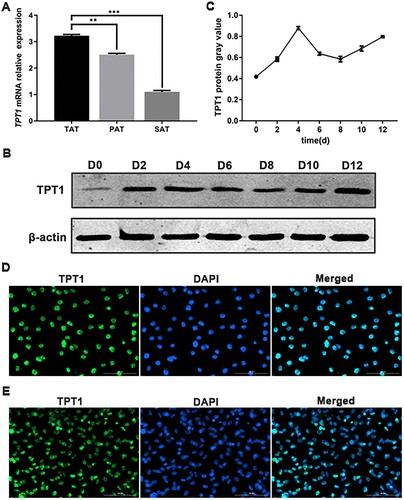
To investigate the role of TPT1 in fat metabolism, the TPT1 mRNA expression in ovine adipose tissues was detected using qPCR. TPT1 mRNA expression in the tail adipose tissue was significantly higher than in the perirenal tissue (P < 0.01) (A). Following an established protocol, SVFs of sheep were isolated and cultured. Cells showed spindle or triangular shapes and could be induced for adipogenic differentiation. The adipogenic-induced SVFs were cultured for 0, 2, 4, 6, 8, 10 and 12 days, which represented the different stages of adipogenic differentiation. We found that TPT1 protein expression showed distinctive kinetics during the adipogenic differentiation of SVFs (B). Quantitative analysis of the Western blots of TPT1 protein showed that the expression tendency was first increased, then decreased and finally increased to a relatively high level (C). The TPT1 protein localization was examined which showed that the TPT1 protein had been mainly distributed in the cell nucleus (D,E). These data indicated that TPT1 may be required for lipid metabolism and adipocyte differentiation.
Figure 1. Expression patterns and localization of TPT1. (A) mRNA expression of TPT1 in the tail adipose tissue (TAT), perirenal adipose tissue (PAT) and subcutaneous adipose tissue (SAT). (B, C) The protein and mRNA expression profiles of TPT1 in the adipogenesis of ovine SVFs, respectively. (D) Immunofluorescence indicates the TPT1 protein is located in the nucleus of C3H10T1/2 cells. (E) Immunofluorescence indicates the TPT1 protein is located in the nucleus of ovine SVFs. *P < 0.05, **P < 0.01, ***P < 0.001.
TPT1 promotes the adipogenic differentiation of ovine SVFs
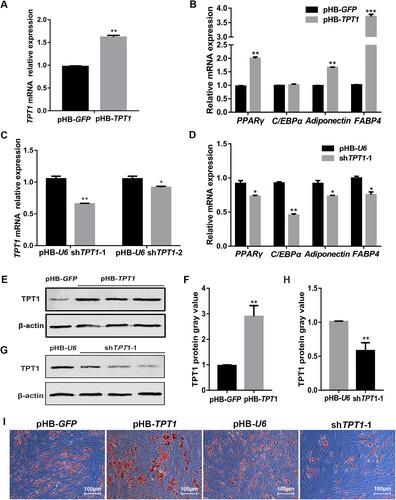
The gain and loss of gene function approaches were used to prove the influence of TPT1 on the adipogenic differentiation of ovine SVFs. TPT1 gain-of-function of TPT1 significantly increased its mRNA expression in ovine SVFs (P < 0.01) (A). Meanwhile, the expression of adipogenic markers, such as peroxisome proliferator-activated receptor gamma (PPARγ) (P < 0.01), Adiponectin (P < 0.01) and fatty acid-binding protein 4 (FABP4) (P < 0.001), was significantly increased. However, the CCAAT enhancer binding protein α (C/EBPα) showed no significant change (B). Interfering for TPT1 significantly decreased its mRNA expression in ovine SVFs (C). Considering the interfering effect of shTPT1-1 is better than the shTPT1-2 (P < 0.01), we used the cell infected with shTPT1-1 for the follow-up experiments. Simultaneously, PPARγ (P < 0.05), Adiponectin (P < 0.05), FABP4 (P < 0.05) and C/EBPα (P < 0.01) were significantly decreased in the TPT1-interfering SVFs (D). Western blotting and quantitative analysis of the blots also confirmed that the gain-of-function (E,F) and loss-of-function (G,H) of TPT1 experiments significantly changed the expression of TPT1 protein. Oil Red O staining showed that TPT1 overexpression promotes the accumulation of lipid droplets in ovine SVFs (I). And TPT1 interference led to the opposite result (I). These results showed that TPT1 promotes the adipogenic differentiation of ovine SVFs.
Figure 2. Effect of TPT1 on adipogenic differentiation of ovine SVFs. (A) The mRNA expression of TPT1 after overexpression (pHBLV-TPT1) compared with that in a control condition (pHBLV-GFP). (B) The mRNA expression of adipogenic markers in TPT1-overexpressing SVFs. (C) The mRNA expression of TPT1 after interference (shTPT1) compared with that in a control condition (pHB-U6). (D) The mRNA expression of adipogenic markers in SVFs infected with shTPT1-1. (E) Western blotting implying TPT1 protein levels in TPT1-overexpressing SVFs. (F) Analysis of the grey values of TPT1 blots in TPT1-overexpressing SVFs based on Western blotting. (G) Western blotting implying TPT1 protein levels in SVFs infected shTPT1-1. (H) Analysis of the grey values of TPT1 blots in SVFs infected shTPT1-1 based on Western blotting. (I) Oil Red O staining 12 days after adipogenic differentiation in TPT1-overexpressing and TPT1-inhibiting SVFs compared with negative control. *P < 0.05, **P < 0.01, ***P < 0.001.
TPT1 promotes the adipogenic differentiation of ovine SVFs through the PI3K/AKT signalling pathways
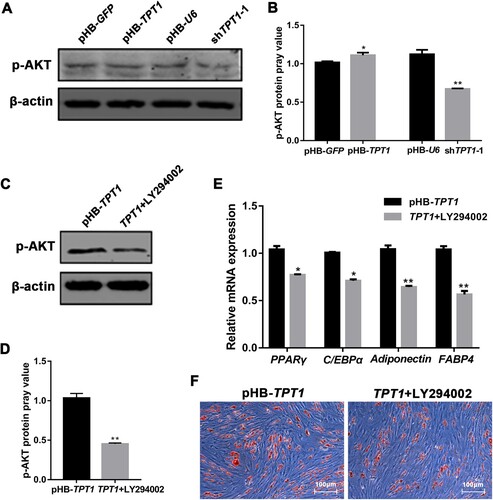
To gain further insights into the molecular mechanism of whether the PI3K/AKT signalling pathway participates in TPT1-mediated adipogenic differentiation of ovine SVFs, we also detected the protein expression of p-AKT after the overexpression and inhibition of TPT1. We found that the expression level of p-AKT significantly increased after the overexpression of TPT1 (P < 0.05), and significantly decreased after the inhibition of TPT1 (P < 0.01) (A,B). Then we treated TPT1-overexpressing SVFs with a PI3K/AKT inhibitor (LY294002). The results showed that the expression level of p-AKT was significantly decreased after the addition of LY294002 (P < 0.01) (C,D). Furthermore, the expression of PPARγ (P < 0.05), Adiponectin (P < 0.01), FABP4 (P < 0.01), C/EBPα (P < 0.05) significantly decreased after being treated with LY294002 in TPT1-overexpressing SVFs compared with the TPT1 overexpressing-only group (E). Oil Red O staining on the 12th day revealed that the lipid droplets in the TPT1 + LY294002 group were significantly reduced compared to those in the TPT1 overexpression-only group (F). The results suggest that LY294002 may result in impaired TPT1-induced adipogenesis through the PI3K/AKT-dependent signalling pathway.
Figure 3. Effects of TPT1 and PI3K/AKT on adipocyte differentiation. (A) The expression of p-AKT protein in TPT1-overexpressing and TPT1-inhibiting SVFs compared with the negative controls. (B) Analysis of the grey values of p-AKT bots in TPT1-overexpressing and TPT1-inhibiting SVFs based on Western blotting. (C) The expression of p-AKT protein in TPT1-overexpressing SVFs treated with LY294002. (D) Analysis of the grey values of p-AKT blots in TPT1-overexpressing SVFs treated with LY294002 based on Western blotting. (E) The mRNA expression of adipogenic markers in TPT1-overexpressing SVFs treated with LY294002. (F) Oil Red O staining results at 12 days after adipogenic differentiation in TPT1-overexpressing SVFs that were treated with LY094002. *P < 0.05, **P < 0.01, ***P < 0.001.
TPT1 negatively regulates FOXO1 in ovine SVFs
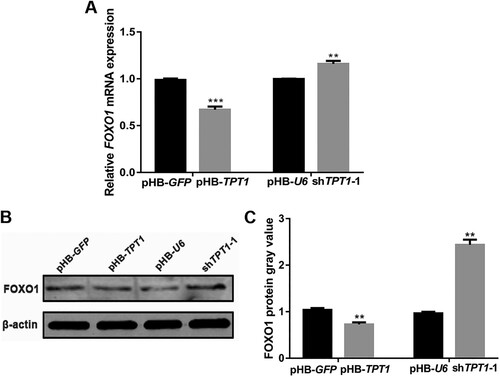
To investigate whether FOXO1 participates in TPT1-mediated adipogenic differentiation of ovine SVFs, the FOXO1 expression after the activation and inhibition of TPT1 was examined. As shown in A, the mRNA expression of FOXO1 remarkably decreased in TPT1-activated ovine SVFs (P < 0.001), but remarkably increased in TPT1-inhibited ovine SVFs (P < 0.01). In addition, we detected FOXO1 protein expression by Western blotting (B,C), which was consistent with qPCR results.
Figure 4. Effect of TPT1 on FOXO1 expression in ovine SVFs. (A) The mRNA expression of FOXO1 in TPT1-overexpressing and TPT1-inhibiting SVFs compared with the negative controls. (B) Western blotting implying FOXO1 protein levels in TPT1-overexpressing and TPT1-inhibiting SVFs compared with the negative controls. (C) Analysis of the grey values of FOXO1 blots in TPT1-overexpressing and TPT1-inhibiting SVFs based on Western blotting. *P < 0.05, **P < 0.01, ***P < 0.001.
Discussion
Adipose tissue is widely spread in animals, and different fat deposits have different functional properties (Monziols et al. Citation2007). For example, visceral fat is deposited around the viscera and protects the viscera, however, with less energy storage capacity. Correspondingly, subcutaneous fat refers to all the underlying adipose tissue of the skin, which has an insulating function and stronger energy storage ability (Ibrahim Citation2010). For ovine adipose tissues, we found that TPT1 mRNA is highly expressed in tail adipose tissues, which also belong to subcutaneous adipose tissues. Therefore, we chose to use SVFs isolated from tail adipose tissues to explore the role of TPT1 and its regulatory mechanism in adipogenic differentiation. In addition, the elevated expression of TPT1 was closely associated with the adipogenic differentiation and lipid accumulation of ovine SVFs and is located in the nucleus in C3H101/2 cells and ovine SVFs. TPT1 as a nuclear protein is dependent on the ovine SVF differentiation. Previous studies have shown that there is no obvious nuclear localization sequence in the TPT1 protein sequence (Li et al. Citation2001) but is mainly located in the nucleus and functions as a transcription factor (Chen et al. Citation2013; Goodman et al. Citation2017). However, its specific effect on the adipogenic differentiation of ovine SVFs needs further study.
Numerous transcription factors and genes are involved in the complicated regulatory mechanism of adipogenesis. One of the transcription factors is PPARγ, which is demonstrated by the result that PPARγ agonists induced adipogenic differentiation of cultured mouse epithelial cells (Kim et al. Citation2016). In addition, C/EBPα also is a part of adipogenesis-related genes, which can be induced by C/EBPβ that is expressed at the early stage of differentiation (Kita et al. Citation2018). Adiponectin is a kind of adipokine produced in adipose tissues, and the mice overexpressed with Adiponectin showed morbid obesity and increased subcutaneous fat (Torre-Villalvazo et al. Citation2018), suggesting that Adiponectin is critical for adipogenesis. Moreover, it has been confirmed that FABP4 and FABP5 were less expressed in adipose-derived stem cells (ADSCs), but they were induced and secreted by ADSCs after differentiation (Yamamoto et al. Citation2013). All of the above-mentioned genes were suppressed when the TPT1 gene was interfering during the adipogenic differentiation of ovine SVFs in this research. It was proven that the ablation of TPT1 decreased hepatocyte proliferation and impaired lipid metabolism (Lin et al. Citation2020). To visualize the effect of TPT1 on the adipogenic differentiation of ovine SVFs, we performed the ORO staining assay and found that TPT1 predominantly increased the accumulation of lipid droplets in adipogenic-differentiated SVFs. Consistent with this, previous data have also shown that intracellular triglyceride and total cholesterol levels in HepG2 cells were lower when shTPT1 was infected (Dong et al. Citation2021). However, a study has found that TPT1 expression in 3T3-L1 cells was decreased when treated with rosiglitazone which can strengthen the function of insulin, thus promoting 3T3-L1 preadipocyte adipogenesis (Pal et al. Citation2013). This is not consistent with the results of our study. We speculated that this may be due to species differences.
PI3Ks is a member of signal transducing enzymes, which accelerates plenty of gene expressions related to lipid synthesis, including SREBP (Porstmann et al. Citation2005), insulin-induced gene 2 (INSIG2) (Yecies et al. Citation2011) and patatin like phospholipase domain containing 2 (ATGL) (Chakrabarti and Kandror Citation2009). The previous studies found that PI3K/AKT signalling pathways were enhanced after overexpressing TPT1 (Kim et al. Citation2009; Lin et al. Citation2020). Consistent with this, we also found that TPT1 enhanced the expression of p-AKT. And our results showed that co-treated with TPT1-overexpression and the PI3K/AKT inhibitor LY294002 significantly reduced the expression levels of PPARγ, Adiponectin, FABP4 and C/EBPα, decreased the cellular lipid droplets compared to just overexpressing TPT1 during adipogenic differentiation of ovine SVFs. Consequently, we suggest that TPT1 facilitates the adipogenic differentiation of SVFs via the PI3K/AKT signalling pathway.
Recent research studies have shown that TPT1 negatively regulate the autophagy process (Bae et al. Citation2017; Cai et al. Citation2019), but FOXO1 exerted an adverse function (Zhang et al. Citation2015), suggesting it may be regarded as an example of antagonism. We found that TPT1 could negatively regulate FOXO1 expression at the mRNA level and protein level. Studoes have shown that the FOXO1 takes up the PPARγ gene promoter −237 site in mice, thus repressing adipogenesis (Song et al. Citation2010). All the above data indicated that one of the possible regulation mechanisms is the FOXO1/PPARγ pathway at the TPT1 function gain and loss experiment. Nevertheless, whether TPT1 promotes the adipogenic differentiation of ovine SVFs by inhibiting FOXO1 expression and then regulating PPARγ is still unclear. These are topics that we can address in further studies.
In conclusion, TPT1 positively regulates the adipogenic differentiation of ovine SVFs by the PI3K/AKT signalling pathway and FOXO1. Our results are helpful for uncovering the regulatory mechanism of TPT1 during the adipogenic differentiation of SVFs in sheep.
Acknowledgements
The authors thank the staff of the Laboratory of Animal Genetics, Breeding and Reproduction, Shanxi Agricultural University, for providing the research facilities.
Disclosure statement
No potential conflict of interest was reported by the author(s).
Additional information
Funding
References
- Bae SY, Byun S, Bae SH, Min DS, Woo HA, Lee K. 2017. TPT1 (tumor protein, translationally-controlled 1) negatively regulates autophagy through the BECN1 interactome and an MTORC1-mediated pathway. Autophagy. 13(5):820–833. Epub 2017/04/15. PubMed PMID: 28409693. doi:10.1080/15548627.2017.1287650
- Bakhtiarizadeh MR, Salami SA. 2019. Identification and expression analysis of long noncoding RNAs in fat-tail of sheep breeds. G3 (Bethesda). 9(4):1263–1276. Epub 2019/02/23. PubMed PMID: 30787031. doi:10.1534/g3.118.201014
- Cai W, Fujita T, Hidaka Y, Jin H, Suita K, Shigeta M, Kiyonari H, Umemura M, Yokoyama U, Sadoshima J, et al. 2019. Translationally controlled tumor protein (TCTP) plays a pivotal role in cardiomyocyte survival through a Bnip3-dependent mechanism. Cell Death Dis. 10(8):549-562. Epub 2019/07/20. PubMed PMID: 31320615. doi:10.1038/s41419-019-1787-7
- Chakrabarti P, Kandror KV. 2009. FoxO1 controls insulin-dependent adipose triglyceride lipase (ATGL) expression and lipolysis in adipocytes. J Biol Chem. 284(20):13296–13300. Epub 2009/03/20. PubMed PMID: 19297333. doi:10.1074/jbc.C800241200
- Chen W, Wang H, Tao S, Zheng Y, Wu W, Lian F, et al. 2013. Tumor protein translationally controlled 1 is a p53 target gene that promotes cell survival. Cell Cycle. 12(14):2321–2328. Epub 2013/09/27. PubMed PMID: 24067374. doi:10.4161/cc.25404
- Diraison F, Hayward K, Sanders KL, Brozzi F, Lajus S, Hancock J, et al. 2011. Translationally controlled tumour protein (TCTP) is a novel glucose-regulated protein that is important for survival of pancreatic beta cells. Diabetologia. 54(2):368–379. Epub 2010/11/11. PubMed PMID: 21063673. doi:10.1007/s00125-010-1958-7
- Dong K, Zhao Q, Xue Y, Wei Y, Zhang Y, Yang Y. 2021. TCTP participates in hepatic metabolism by regulating gene expression involved in insulin resistance. Gene. 768:145263. Epub 2020/10/31. PubMed PMID: 33122078. doi:10.1016/j.gene.2020.145263
- Fan H, Hou Y, Sahana G, Gao H, Zhu C, Du L, et al. 2019. A transcriptomic study of the tail Fat deposition in two types of Hulun Buir sheep according to tail size and Sex. Animals (Basel). 9(9). Epub 2019/09/08. PubMed PMID: 31491862. doi: 10.3390/ani9090655
- Goodman CA, Coenen AM, Frey JW, You JS, Barker RG, Frankish BP, et al. 2017. Insights into the role and regulation of TCTP in skeletal muscle. Oncotarget. 8(12):18754–18772. Epub 2016/11/05. PubMed PMID: 27813490. doi:10.18632/oncotarget.13009
- Hsu YC, Chern JJ, Cai Y, Liu M, Choi KW. 2007. Drosophila TCTP is essential for growth and proliferation through regulation of dRheb GTPase. Nature. 445(7129):785–788. Epub 2007/02/16. PubMed PMID: 17301792. doi:10.1038/nature05528
- Ibrahim MM. 2010. Subcutaneous and visceral adipose tissue: structural and functional differences. Obes Rev. 11(1):11–18. Epub 2009/08/07. PubMed PMID: 19656312. doi:10.1111/j.1467-789X.2009.00623.x
- Jin H, Zhang X, Su J, Teng Y, Ren H, Yang L. 2015. RNA interferencemediated knockdown of translationally controlled tumor protein induces apoptosis, and inhibits growth and invasion in glioma cells. Mol Med Rep. 12(5):6617–6625. Epub 2015/09/04. PubMed PMID: 26328748. doi:10.3892/mmr.2015.4280
- Kim J, Lee YJ, Kim JM, Lee SY, Bae MA, Ahn JH, et al. 2016. PPARγ agonists induce adipocyte differentiation by modulating the expression of Lipin-1, which acts as a PPARγ phosphatase. Int J Biochem Cell Biol. 81(Pt A):57–66. Epub 2016/10/27. PubMed PMID: 27780754. doi:10.1016/j.biocel.2016.10.018
- Kim M, Jung J, Lee K. 2009. Roles of ERK, Roles of ERK, PI3 kinase, and PLC-γ pathways induced by overexpression of translationally controlled tumor protein in HeLa cells. Arch Biochem Biophys. 485(1):82–87. Epub 2009/04/24. PubMed PMID: 19388149. doi:10.1016/j.abb.2009.02.002
- Kita Y, Katayama Y, Shiraishi T, Oka T, Sato T, Suyama M, et al. 2018. The autism-related protein CHD8 cooperates with C/EBPβ to regulate adipogenesis. Cell Rep. 23(7):1988–2000. Epub 2018/05/17. PubMed PMID: 29768199. doi:10.1016/j.celrep.2018.04.050
- Li F, Zhang D, Fujise K. 2001. Characterization of fortilin, a novel antiapoptotic protein. J Biol Chem. 276(50):47542–47549. Epub 2001/10/13. PubMed PMID: 11598139. doi:10.1074/jbc.M108954200
- Lin Z, Zhang X, Wang J, Liu W, Liu Q, Ye Y, et al. 2020. Translationally controlled tumor protein promotes liver regeneration by activating mTORC2/AKT signaling. Cell Death Dis. 11(1):58–72. Epub 2020/01/25. PubMed PMID: 31974368. doi:10.1038/s41419-020-2231-8
- Liu L, Zheng LD, Zou P, Brooke J, Smith C, Long YC, et al. 2016. FoxO1 antagonist suppresses autophagy and lipid droplet growth in adipocytes. Cell Cycle. 15(15):2033–2041. Epub 2016/06/05. PubMed PMID: 27260854. doi:10.1080/15384101.2016.1192732
- Ma YP, Zhu WL. 2012. Cytoplasmic and nuclear localization of TCTP in normal and cancer cells. Biochem Res Int. 2012(8):871728-871731. Epub 2012/06/06. PubMed PMID: 22666592. doi:10.1155/2012/871728
- Mishra DK, Srivastava P, Sharma A, Prasad R, Bhuyan SK, Malage R, et al. 2018. Translationally controlled tumor protein (TCTP) is required for TGF-β1 induced epithelial to mesenchymal transition and influences cytoskeletal reorganization. Biochim Biophys Acta Mol Cell Res. 1865(1):67–75. Epub 2017/09/30. PubMed PMID: 28958626. doi:10.1016/j.bbamcr.2017.09.014
- Monziols M, Bonneau M, Davenel A, Kouba M. 2007. Comparison of the lipid content and fatty acid composition of intermuscular and subcutaneous adipose tissues in pig carcasses. Meat Sci. 76(1):54–60. Epub 2007/05/01. PubMed PMID: 22064191. doi:10.1016/j.meatsci.2006.10.013
- Pal P, Kanaujiya JK, Lochab S, Tripathi SB, Sanyal S, Behre G, et al. 2013. Proteomic analysis of rosiglitazone and guggulsterone treated 3T3-L1 preadipocytes. Mol Cell Biochem. 376(1–2):81–93. Epub 2013/01/01. PubMed PMID: 23275126. doi:10.1007/s11010-012-1551-0
- Peterson TR, Sengupta SS, Harris TE, Carmack AE, Kang SA, Balderas E, et al. 2011. mTOR complex 1 regulates lipin 1 localization to control the SREBP pathway. Cell. 146(3):408–420. Epub 2011/08/06. PubMed PMID: 21816276. doi:10.1016/j.cell.2011.06.034
- Porstmann T, Griffiths B, Chung YL, Delpuech O, Griffiths JR, Downward J, et al. 2005. PKB/Akt induces transcription of enzymes involved in cholesterol and fatty acid biosynthesis via activation of SREBP. Oncogene. 24(43):6465–6481. Epub 2005/07/12. PubMed PMID: 16007182. doi:10.1038/sj.onc.1208802
- Sebo ZL, Rodeheffer MS. 2019. Assembling the adipose organ: adipocyte lineage segregation and adipogenesis in vivo. Development. 146(7). Epub 2019/04/06. PubMed PMID: 30948523. doi: 10.1242/dev.172098
- Song S, Attia RR, Connaughton S, Niesen MI, Ness GC, Elam MB, et al. 2010. Peroxisome proliferator activated receptor α (PPARα) and PPAR gamma coactivator (PGC-1α) induce carnitine palmitoyltransferase IA (CPT-1A) via independent gene elements. Mol Cell Endocrinol. 325(1–2):54–63. Epub 2010/07/20. PubMed PMID: 20638986. doi:10.1016/j.mce.2010.05.019
- Torre-Villalvazo I, Bunt AE, Aleman G, Marquez-Mota CC, Diaz-Villasenor A, Noriega LG, et al. 2018. Adiponectin synthesis and secretion by subcutaneous adipose tissue is impaired during obesity by endoplasmic reticulum stress. J Cell Biochem. 119(7):5970–5984. Epub 2018/03/27. PubMed PMID: 29575057. doi:10.1002/jcb.26794
- Tsai MJ, Yang-Yen HF, Chiang MK, Wang MJ, Wu SS, Chen SH. 2014. Tctp Is essential for β-cell proliferation and mass expansion during development and β-cell adaptation in response to insulin resistance. Endocrinology. 155(2):392–404. Epub 2013/11/20. PubMed PMID: 24248465. doi:10.1210/en.2013-1663
- Wijayanti D, Zhang S, Yang Y, Bai Y, Akhatayeva Z, Pan C, et al. 2022. Goat SMAD family member 1 (SMAD1): mRNA expression, genetic variants, and their associations with litter size. Theriogenology. 193:11–19. Epub 2022/09/19. PubMed PMID: 36116245. doi:10.1016/j.theriogenology.2022.09.001
- Yamamoto T, Furuhashi M, Sugaya T, Oikawa T, Matsumoto M, Funahashi Y, et al. 2013. Correction: calcium channel blockers, more than diuretics, enhance vascular protective effects of angiotensin receptor blockers in salt-loaded hypertensive rats. PLoS One. 8(12):e0167825. Epub 2016/12/10. PubMed PMID: 27936164. doi:10.1371/journal.pone.0167825
- Yecies JL, Zhang HH, Menon S, Liu S, Yecies D, Lipovsky AI, et al. 2011. Akt stimulates hepatic SREBP1c and lipogenesis through parallel mTORC1-dependent and independent pathways. Cell Metab. 14(1):21–32. Epub 2011/07/05. PubMed PMID: 21723501. doi:10.1016/j.cmet.2011.06.002
- Yenofsky R, Bergmann I, Brawerman G. 1982. Messenger RNA species partially in a repressed state in mouse sarcoma ascites cells. Proc Natl Acad Sci USA. 79(19):5876–5880. Epub 1982/10/01. PubMed PMID: 6964392. doi:10.1073/pnas.79.19.5876
- Zhang J, Ng S, Wang J, Zhou J, Tan SH, Yang N, et al. 2015. Histone deacetylase inhibitors induce autophagy through FOXO1-dependent pathways. Autophagy. 11(4):629–642. Epub 2015/04/29. PubMed PMID: 25919885. doi:10.1080/15548627.2015.1023981